
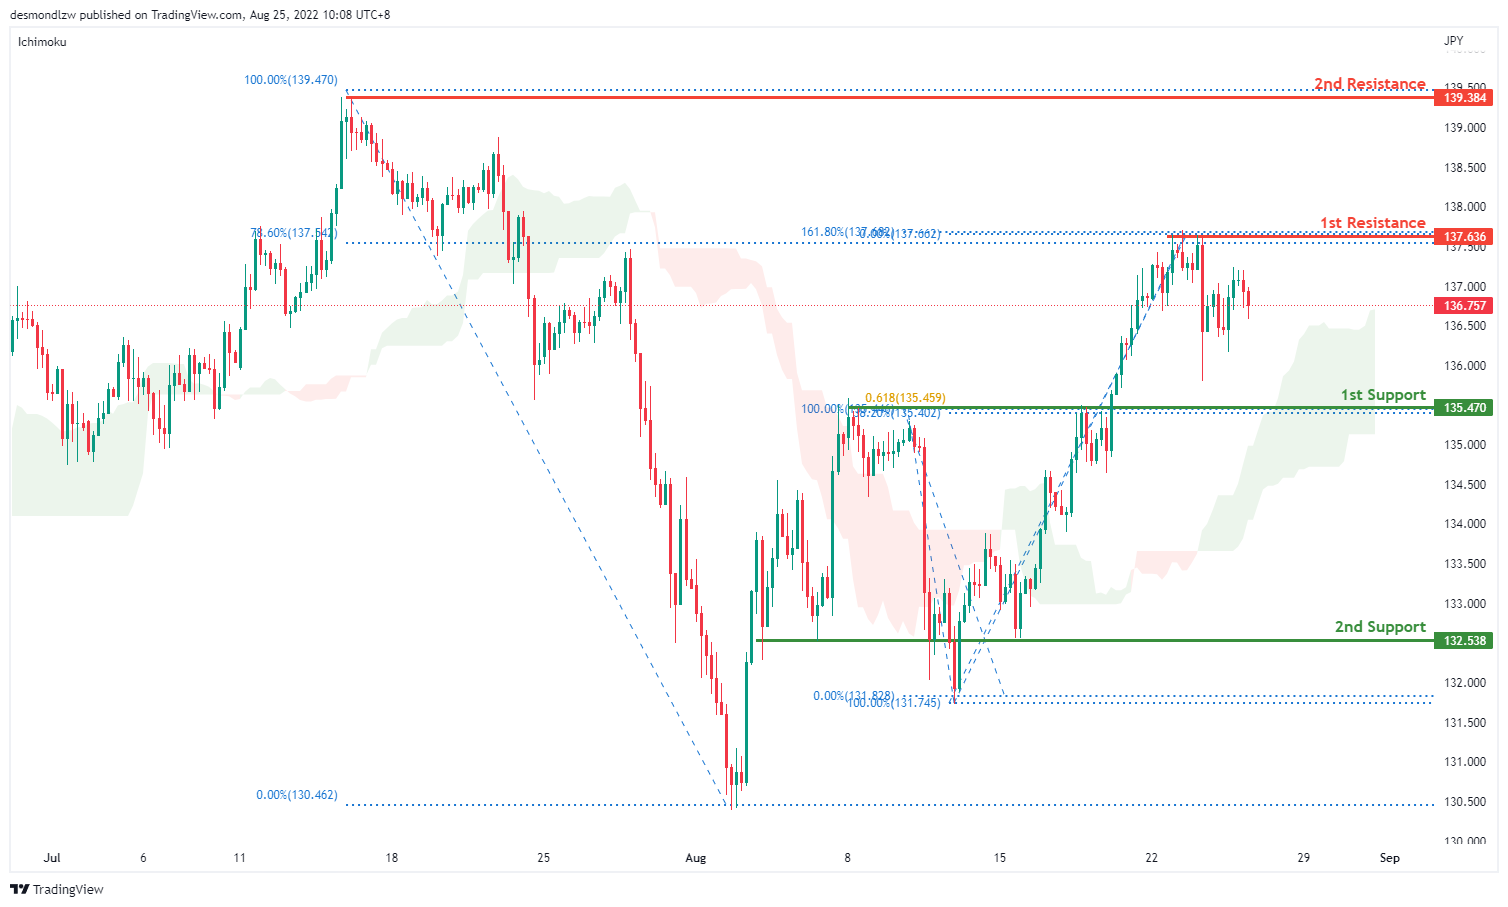
USD/JPY:
On the H4 chart, price has confirmed a bullish momentum breaking the previous high. We are bullish bias and are looking at price testing the first resistance at 137.636 where the 78.6% fibonacci retracement and 161.8% extension sits. It has pulled back slightly but if bullish momentum continues, it will bring the price to 139.397 where the swing high sits. Alternatively if price pulls back, it should test the first support at 135.470 where the 61.8% projection sits and the second support at 132.538 where the swing low sits
Areas of consideration:
- H4 time frame, 1st resistance at 137.636
- H4 time frame, 1st support at 135.470
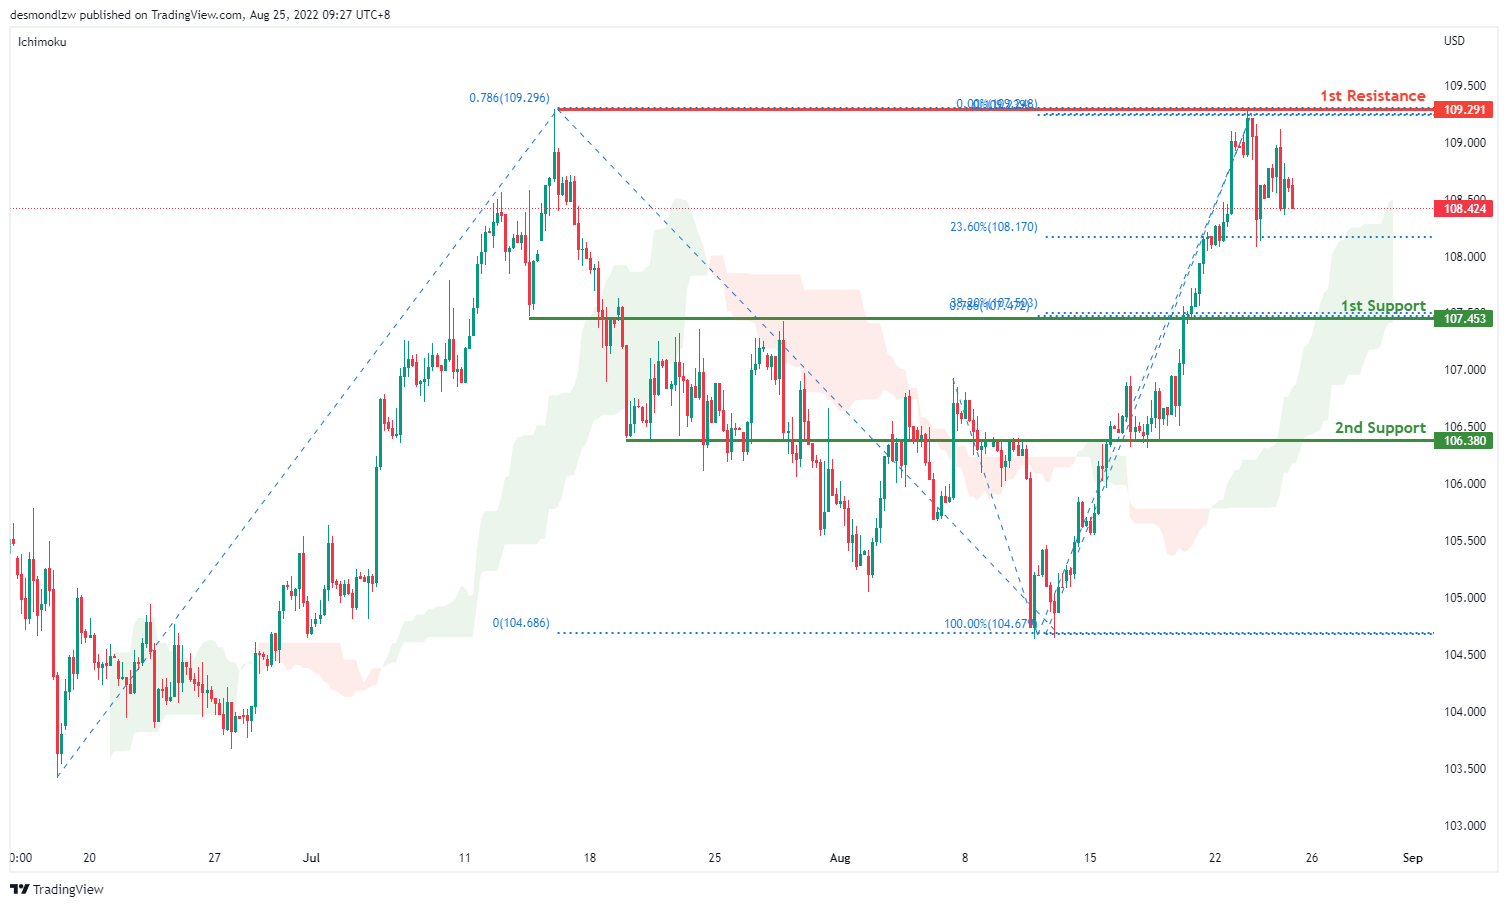
DXY:
On the H4, prices are still moving in an ascending trend and is in a bullish momentum. Price has tested first resistance at 109.291 where the 78.6% Fibonacci projection and the previous swing high sits and has pulled back slightly to the 23.6% retracement levels. If price fails to break the first resistance, it should pull back to test the first support at 107.453 where the 38.2% retracement and 78.6% projection sits and subsequently the second support at 106.380 where the 61.8% retracement sits
Areas of consideration:
- H4 time frame, 1st resistance at 109.291
- H4 time frame, 1st support at 107.453
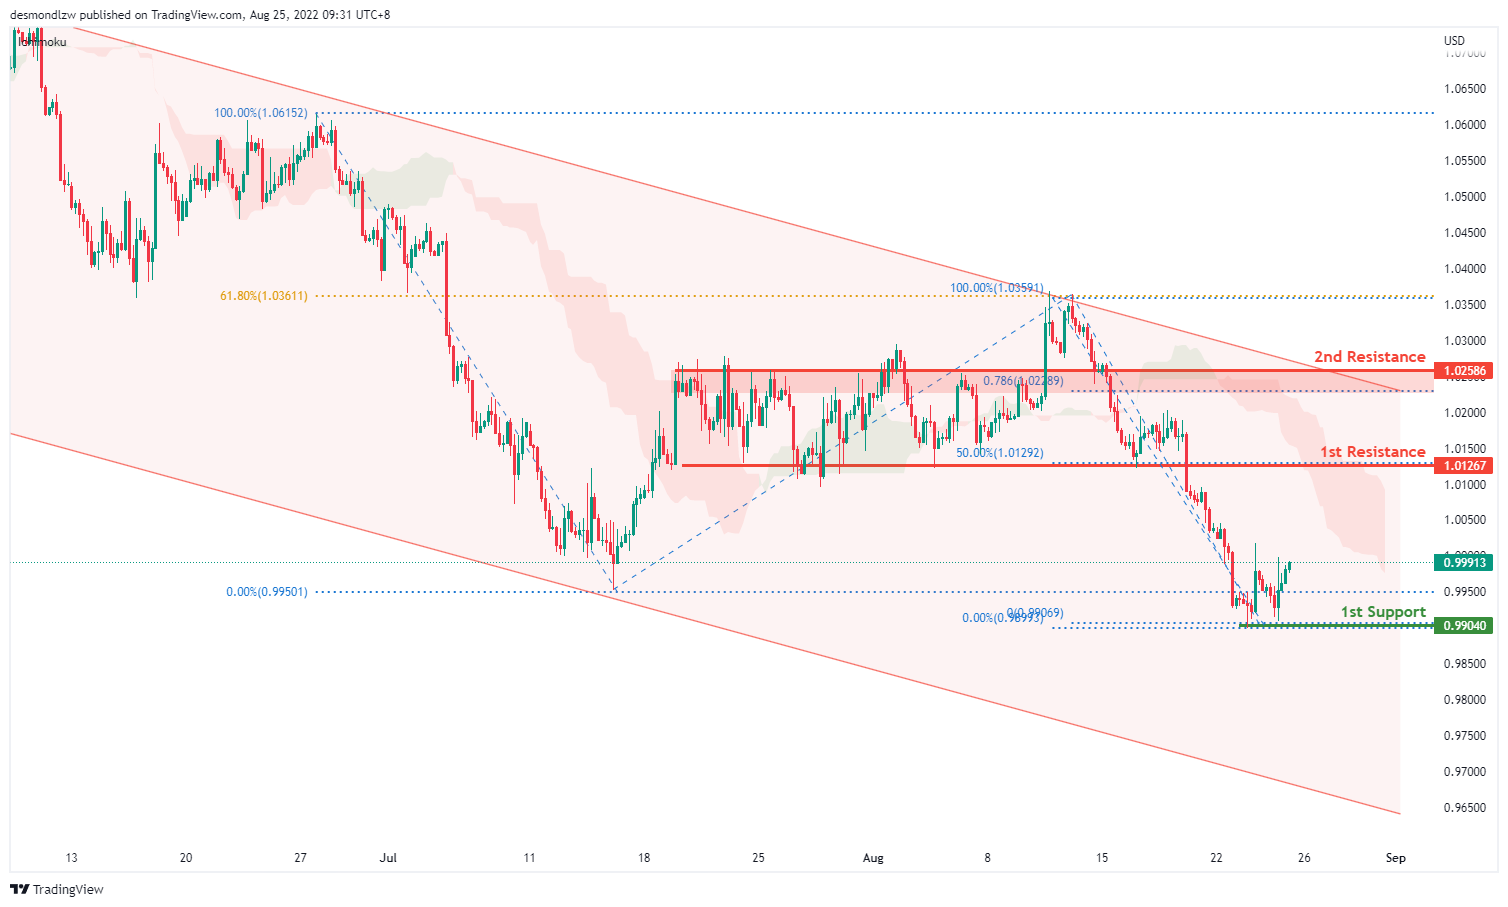
EUR/USD :
On the H4, prices are still in a descending trend and are below the ichimoku indicator, we are bearish bias. Prices have tested the first support at 0.9904 where the 61.8% projection sits. If it fails to break the first support, prices could pull back to test the first resistance at 1.0126 where the previous swing low and 50% retracement sits and subsequently the second resistance at 1.0258 where the 78.6% retracement and swing high sits
Areas of consideration :
- H4 1st resistance at 1.0126
- H4 1st support at 0.9904
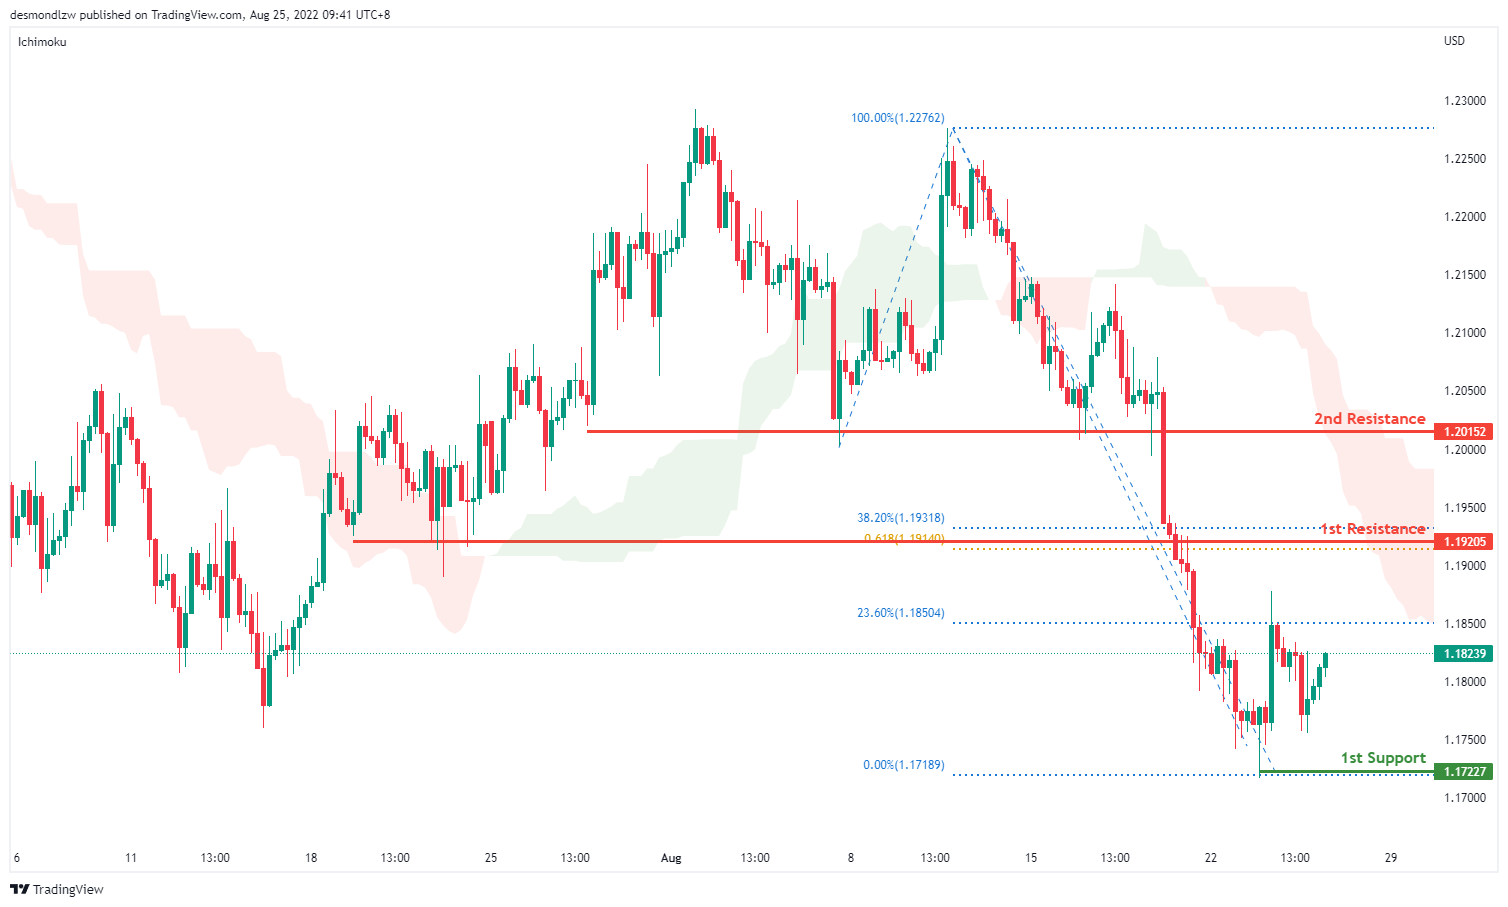
GBP/USD:
On the H4, prices seem to be in a bearish momentum and respecting the ichimoku cloud. It has tested the first support at 1.1722 where the swing low sits and has now slightly reversed. Alternatively, if price fails to break the first support at 1.1722, it can pull back to test the first resistance at 1.1920 where the 38.2% retracement and 61.8% projection sits. Subsequently testing the second resistance at 1.2015 where the swing low sits
Areas of consideration:
- H4 1st resistance at 1.1920
- H4 1st support at 1.1722
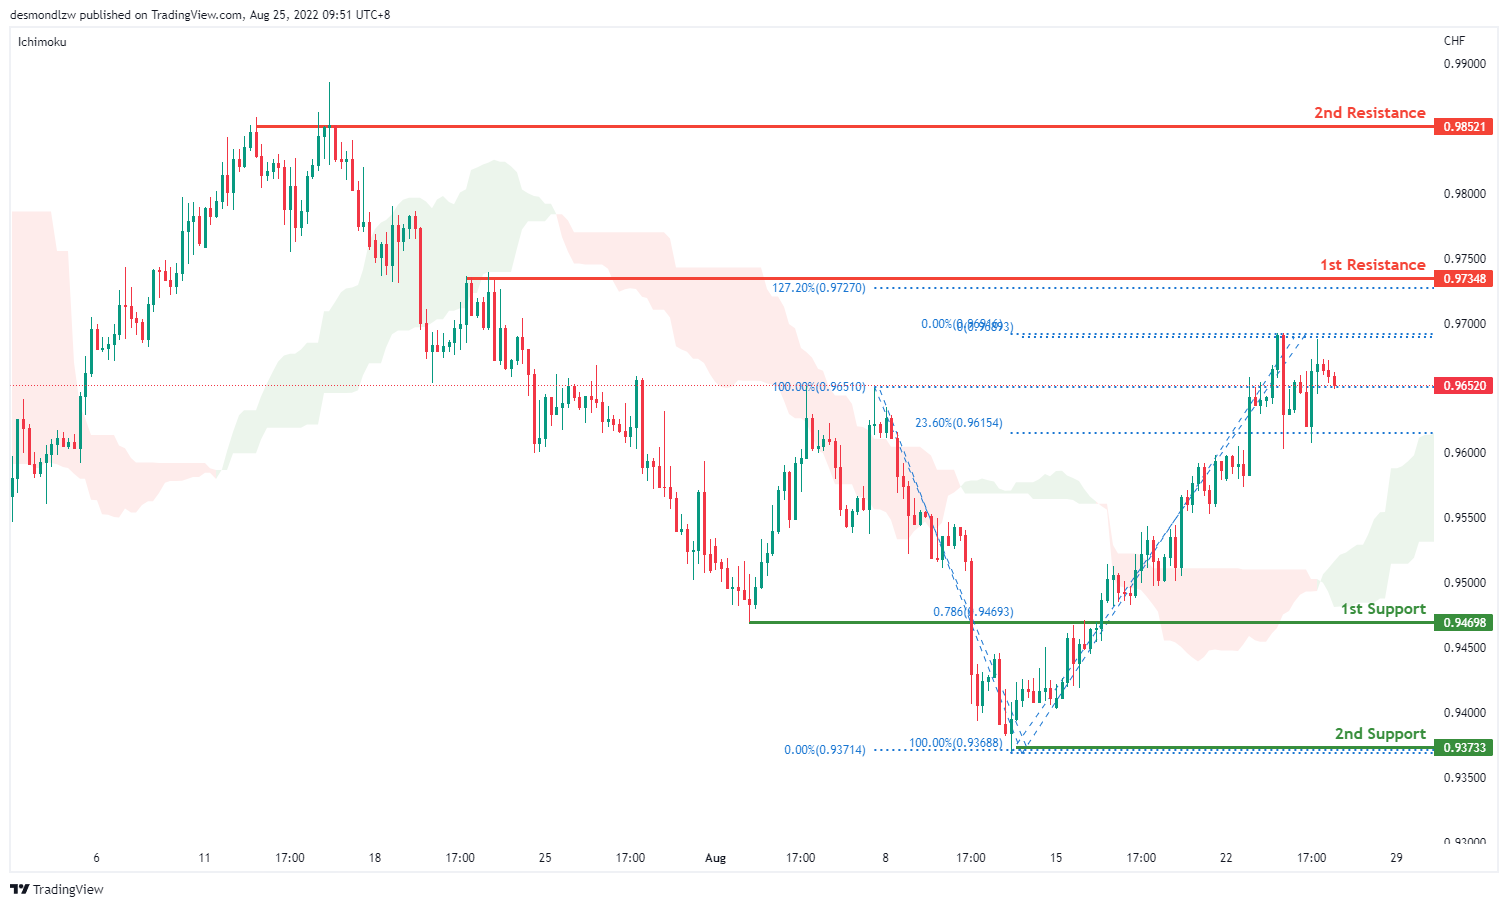
USD/CHF:
On the H4, with prices moving above the ichimoku cloud and breaking the descending trend, we are bullish bias. We’re looking at price to test the first resistance at 0.9734 where the 127.2% extension sits. If price continues with bullish momentum, it will bring price to second resistance at 0.9852. Alternatively, prices could test the intermediate support at 0.95500 where the swing low sits and then the first support at 0.9469 where the 78.6% fibonacci retracement sits
Areas of consideration
- H4 1st support at 0.9469
- H4 1st resistance at 0.9734
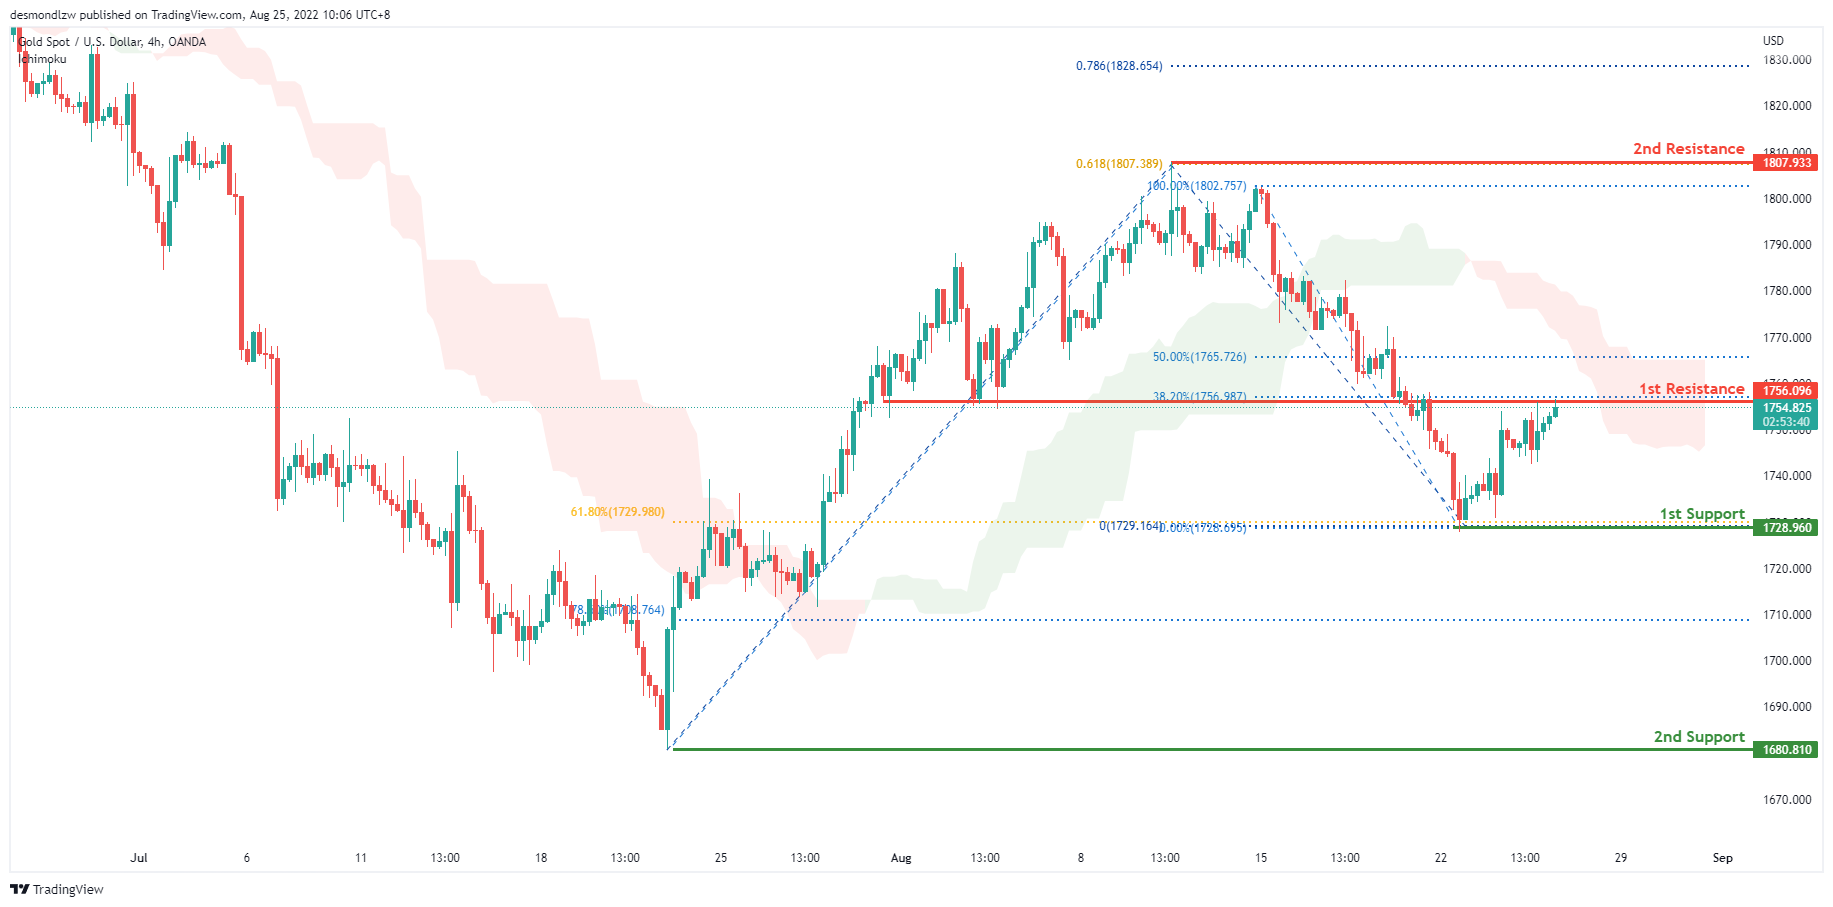
XAU/USD (GOLD):
On the H4, with prices moving within the descending trendline, below ichimoku cloud, we have a bearish bias. Prices are now pulling back slightly to test at the first resistance 1756.096 levels where the 38.2% retracement sits. If prices breaks this resistance, it may pull back further to test at the second resistance 1817.933 where the 61.8% projection sits. Alternatively, price should continue with the bearish trend, testing the first support at 1728.960 then the second support at 1680.810
Areas of consideration:
- H4 time frame, 1st support at 1728.960
- H4 time frame, 2nd support at 1680.810
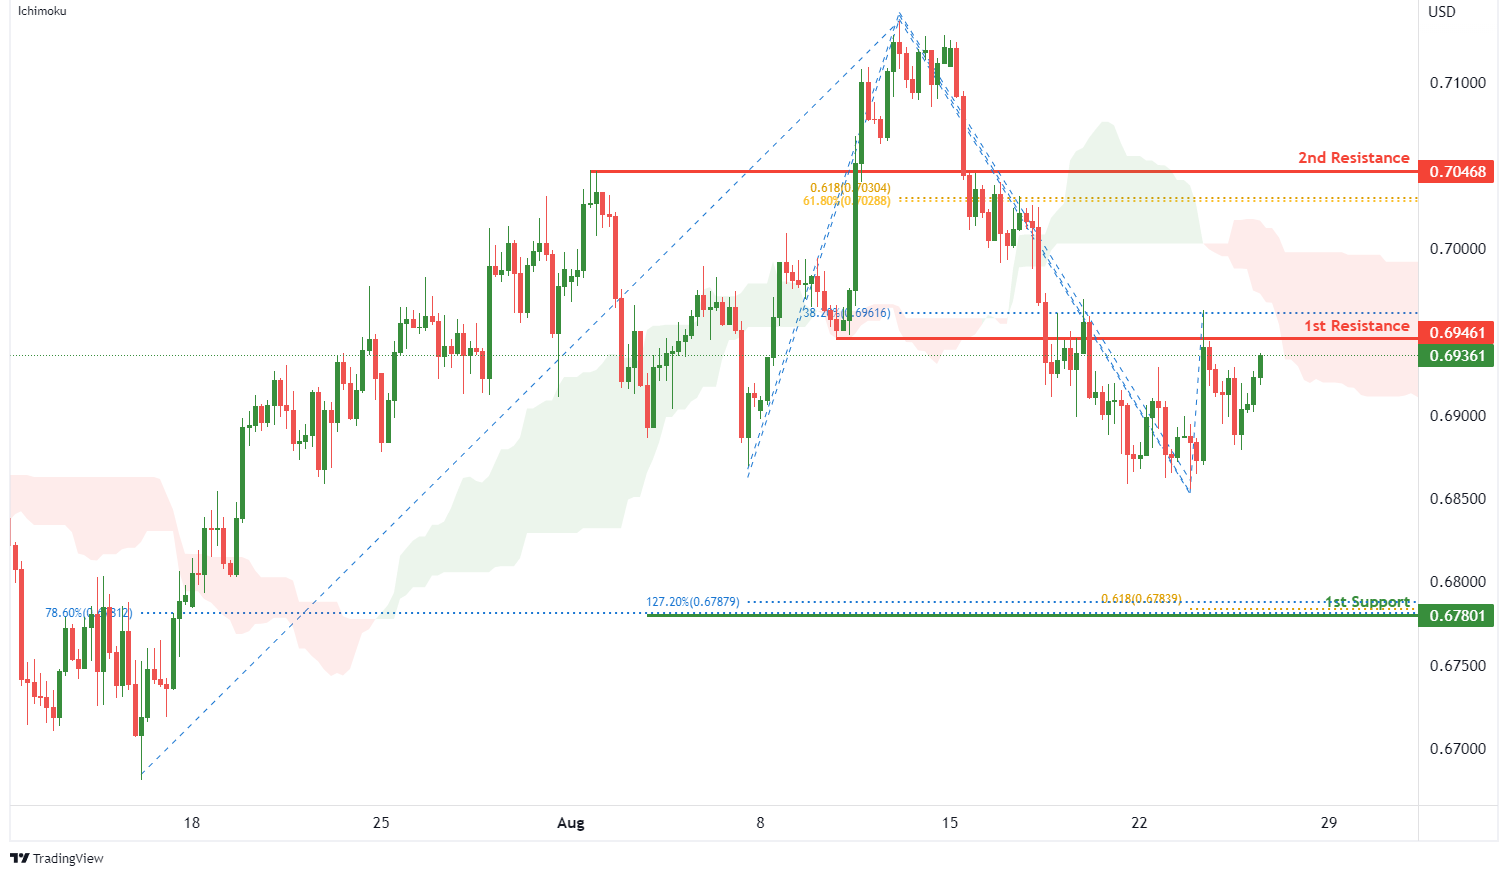
AUD/USD:
On the H4, with the price moving below ichimoku cloud, we have a bearish bias that the price will drop from 1st resistance at 0.69461 where the overlap resistance and 38.2% fibonacci retracement are to the 1st support at 0.67801 where the 78.6% fibonacci retracement, 127.2% fibonacci extension and 61.8% fibonacci projection are. Alternatively, price could break 1st resistance structure and rise to 2nd resistance at 0.70468 where the pullback resistance, 61.8% fibonacci retracement and 61.8% fibonacci projection are.
Areas of consideration
- H4 1st support at 0.67801
- H4 1st resistance at 0.69461
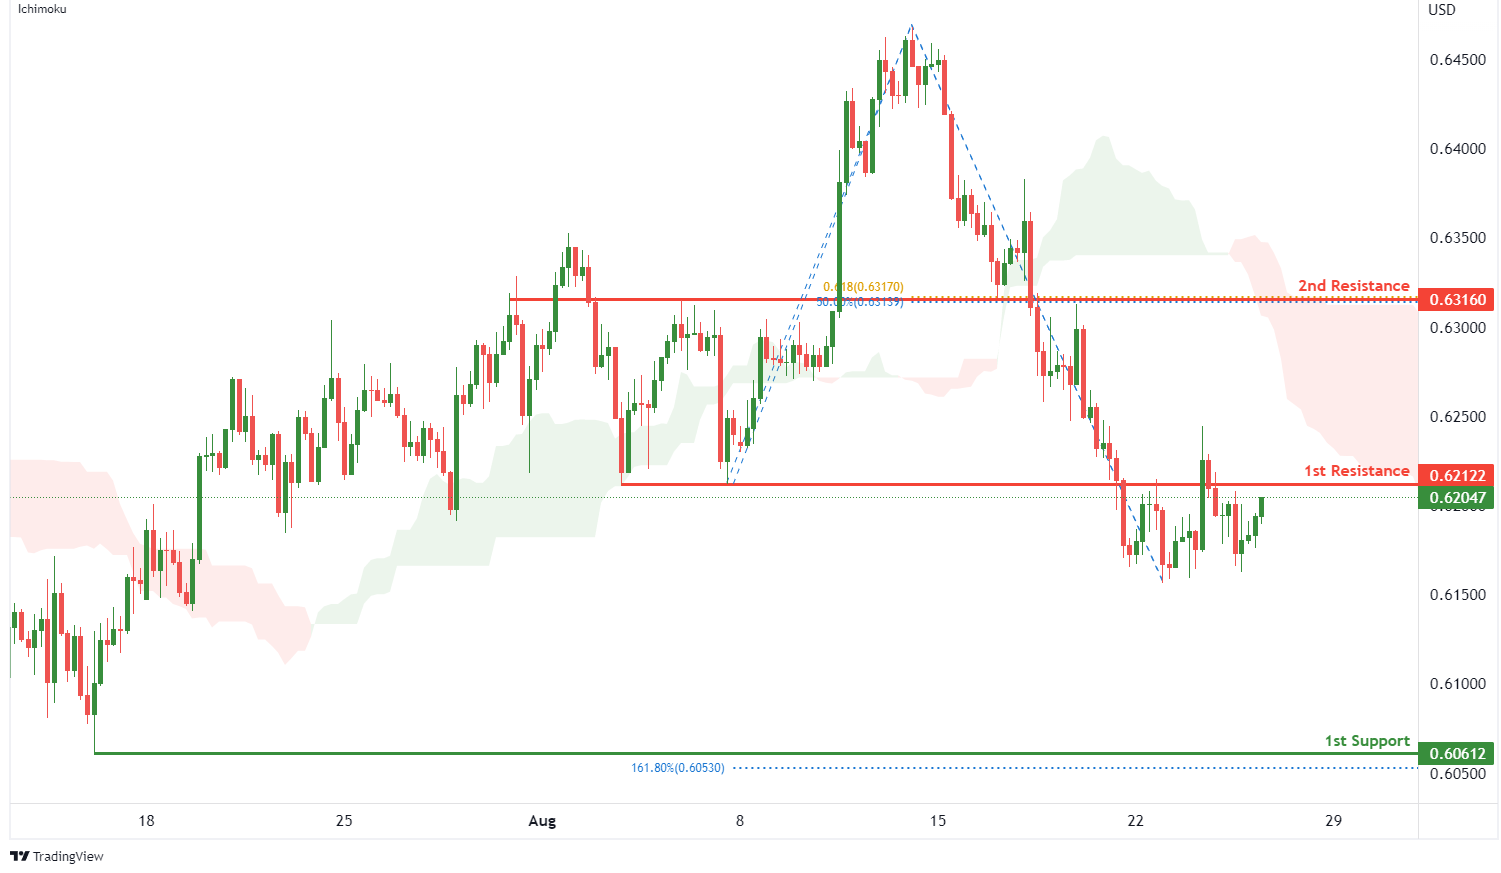
NZD/USD:
On the H4, with price moving below the ichimoku indicator, we have a bearish bias that price will drop from 1st resistance at 0.62122 where the pullback overlap resistance is to the 1st support at 0.60612 where the swing low support and 161.8% fibonacci extension are. Alternatively, price could break 1st resistance and rise to 2nd resistance at 0.63160 where the overlap resistance, 50% fibonacci retracement and 61.8% fibonacci projection are.
Areas of consideration:
- H4 time frame, 1st support at 0.60612
- H4 time frame, 1st resistance at 0.62122
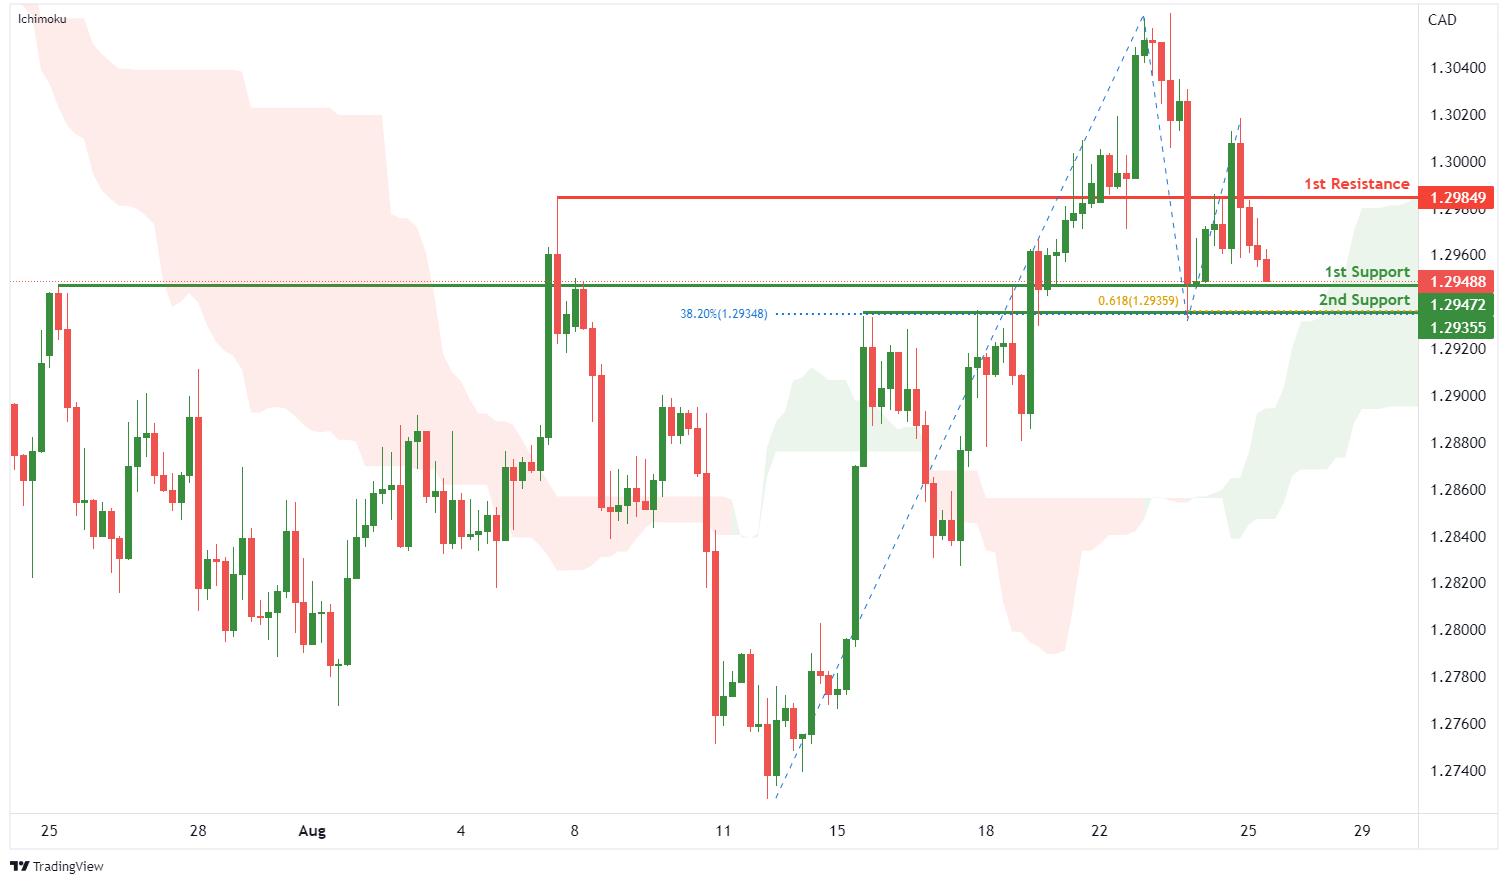
USD/CAD:
On the H4, with the price above the ichimoku cloud, we have a bullish bias that the price will rise from 1st support at 1.29472 where the overlap support is to the 1st resistance at 1.29849 where the pullback resistance is. Alternatively, price could break 1st support and drop to 2nd support at 1.29355 where the overlap support, 38.2% fibonacci retracement and 61.8% fibonacci projection are.
Areas of consideration:
- H4 time frame, 1st resistance at 1.29849
- H4 time frame, 1st support at 1.29472
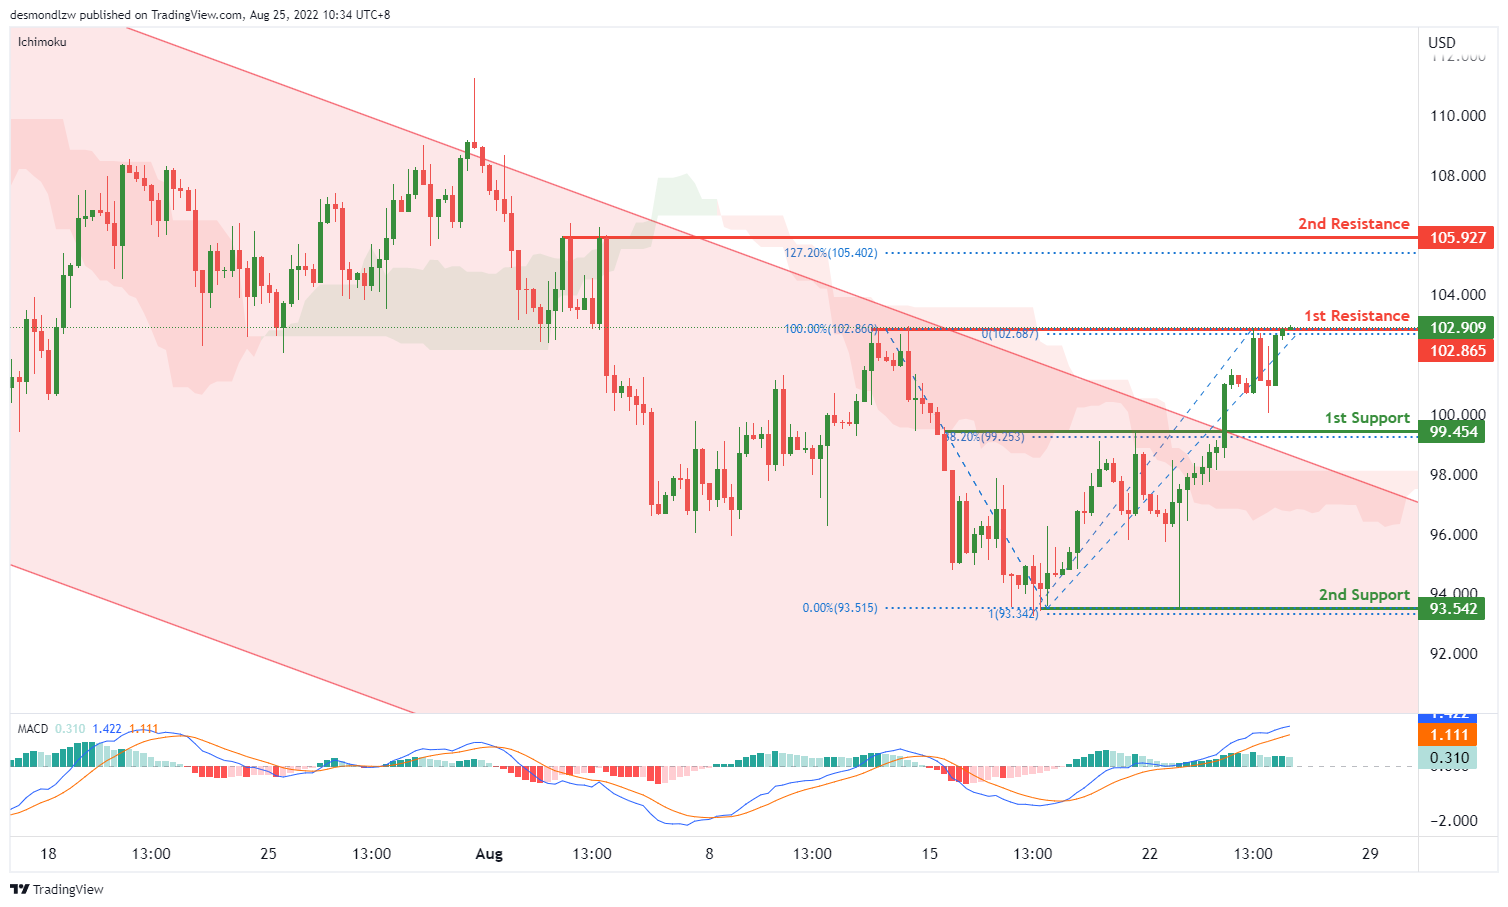
OIL:
On the H4, with price breaking the descending channel and above ichimoku cloud, we have a bullish bias. Prices are testing the 1st resistance at 102.453, where the 100% fibonacci projection and overlap resistance are. If the price breaks this level, we can expect the price to rise to the 2nd resistance at 105.927, where the 127.2% extension and swing highs are. Alternatively, the price may drop to the 1st support at 99.454, where the 23.6% fibonacci retracement and pullback support are.
Areas of consideration:
- H4 time frame, 1st resistance at 102.453
- H4 time frame, 2nd resistance at 105.927
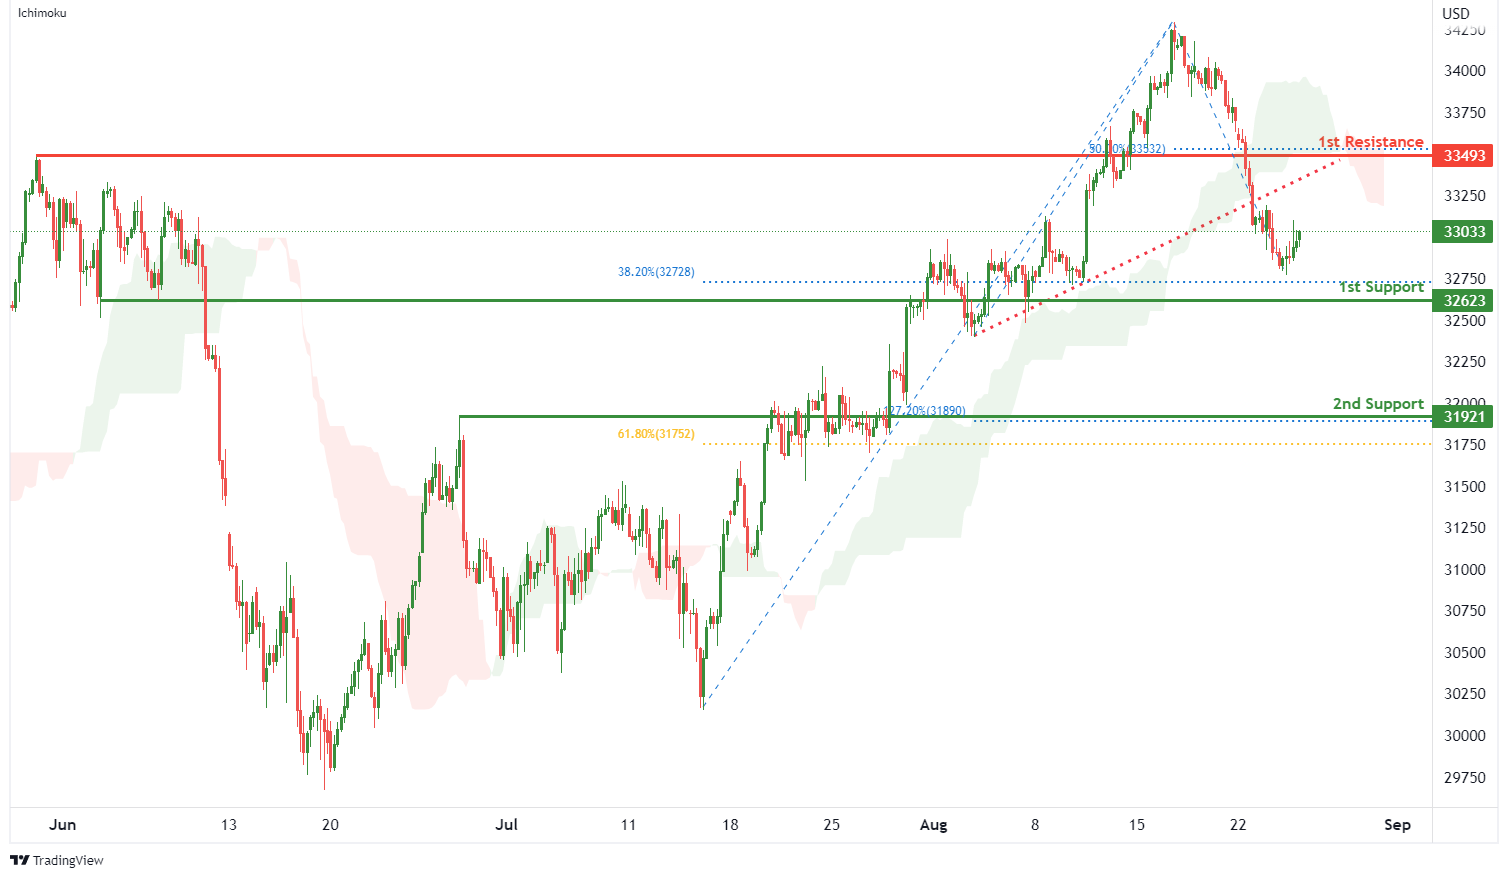
Dow Jones Industrial Average:
On the H4, with price breaking out of the ascending trendline and moving below the ichimoku indicator, we have a bearish bias that price will drop to 1st support at 32623 where the pullback support and 38.2% fibonacci retracement are. Once there is downside confirmation of price breaking 1st support, we would expect bearish momentum to carry price to 2nd support at 31921 where the pullback support, 61.8% fibonacci retracement and 127.2% fibonacci extension are. Alternatively, price could rise to 1st resistance at 33493 where the pullback resistance and 50% fibonacci retracement are.
Areas of consideration:
- H4 time frame, 1st resistance of 33493
- H4 time frame, 1st support at 32623
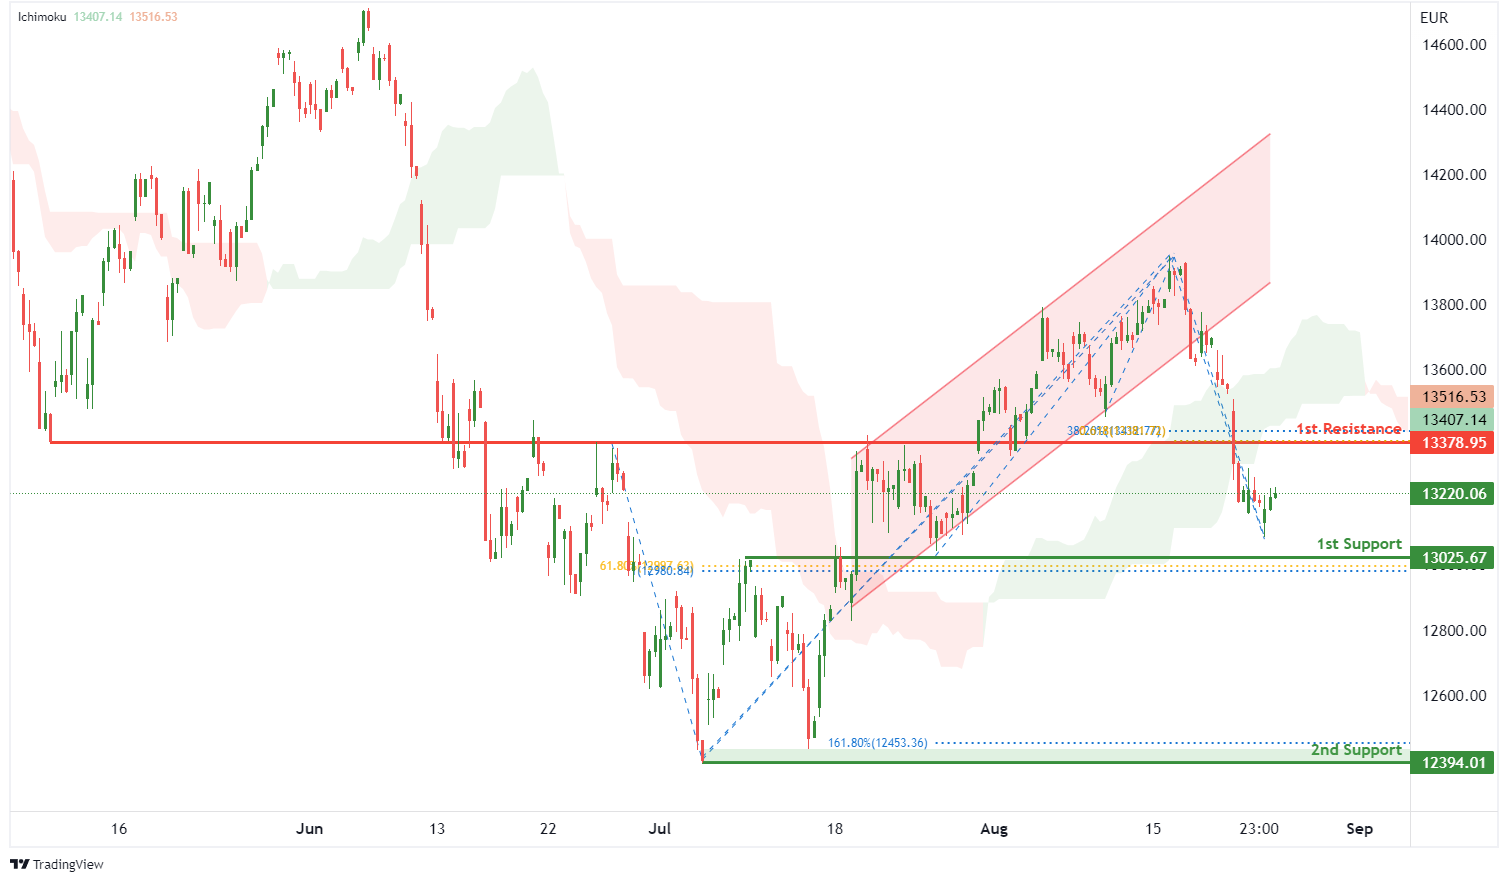
DAX:
On the H4, with price breaking out of an ascending channel and moving below the ichimoku indicator, we have a bearish bias that price will drop to the 1st support at 13025.67 where the pullback support, 61.8% fibonacci retracement and 100% fibonacci projection are. Once there is downside confirmation that price has broken 1st support, we would expect bearish momentum to carry price to 2nd support at 12394.01 where the swing low support and 161.8% fibonacci extension are. Alternatively, price could rise to 1st resistance at 13378.95 where the overlap resistance, 38.2% fibonacci retracement and 61.8% fibonacci projection.
Areas of consideration:
- H4 time frame, 1st resistance of 13378.95
- H4 time frame, 1st support at 13025.67
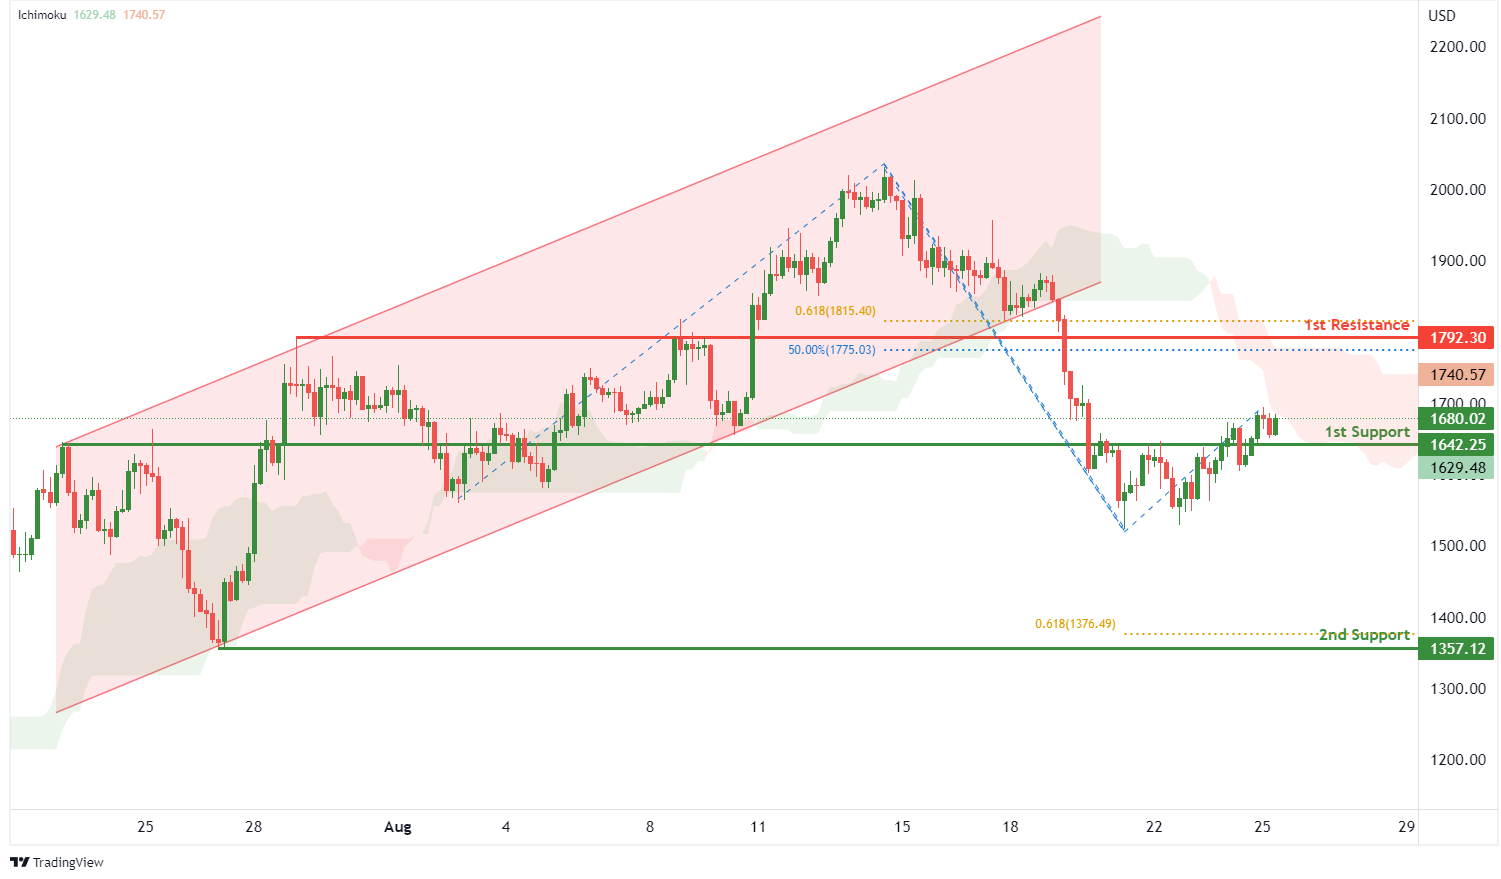
ETHUSD:
On the H4, with price breaking out of an ascending channel and moving below the ichimoku indicator, we have a bearish bias that price will drop to the 1st support at 1642.25 where the pullback support is. Once there is downside confirmation that price has broken 1st support, we would expect bearish momentum to carry price to 2nd support at 1357.12 where the swing low support and 61.8% fibonacci projection are. Alternatively, price could rise to 1st resistance at 1792.30 where the overlap resistance, 50% fibonacci retracement and 61.8% fibonacci projection are.
Areas of consideration:
- H4 time frame, 1st resistance of 1792.30
- H4 time frame, 1st support at 1642.25
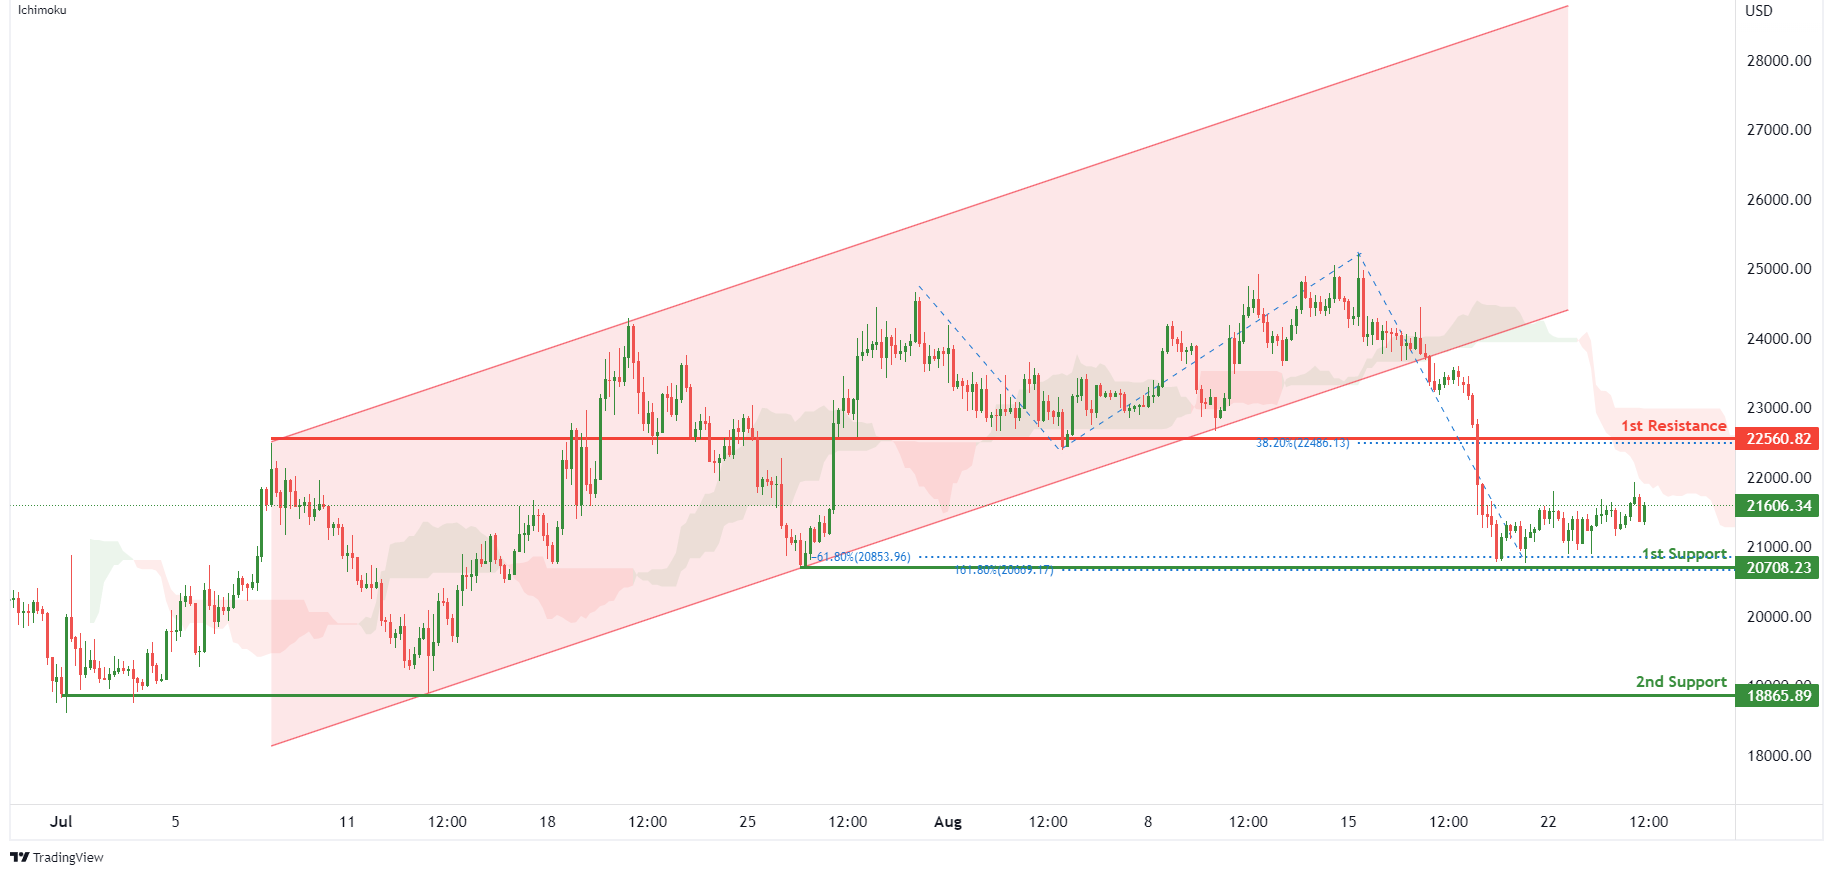
BTCUSD:
On the H4, with price breaking out of a bullish channel and moving below the ichimoku indicator, we have a bearish bias that price will drop to 1st support at 20708.23 where the -61.8% fibonacci expansion, 161.8% fibonacci extension and swing low support are. Once we have downside confirmation of price breaking 1st support structure,we would expect bearish momentum to carry price to 2nd support at 18865.89 where the swing low support is. Alternatively, price could rise to 1st resistance at 22560.82 where the pullback resistance and 38.2% fibonacci retracement are.
Areas of consideration:
- H4 time frame, 1st resistance of 22560.82
- H4 time frame, 1st support at 20708.23
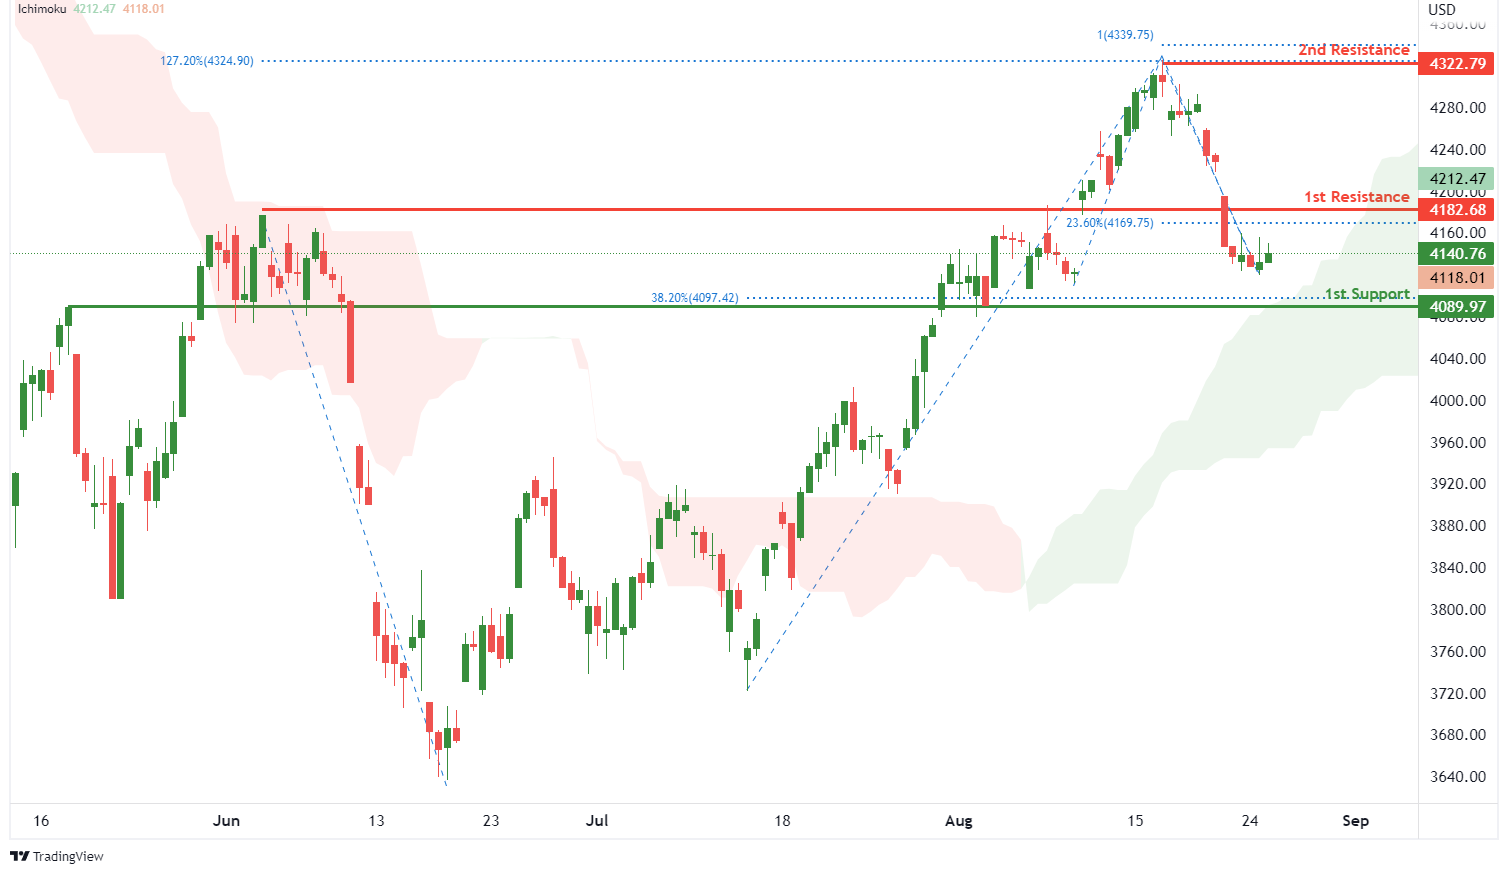
S&P 500:
On the H4, with prices moving above the ichimoku indicator, we have a bullish bias that the price will rise to 1st resistance at 4182.68 where the pullback resistance and 23.6% fibonacci retracement are. Once there is upside confirmation of price breaking 1st resistance structure, we would expect bullish momentum to carry price to 2nd resistance at 4322.79 where the swing high resistance, 100% fibonacci projection and 127.2% fibonacci extension are. Alternatively, price could drop to 1st support at 4089.97 where the pullback support and 38.2% fibonacci retracement are.
Areas of consideration:
- H4 time frame, 1st resistance of 4182.68
- H4 time frame, 1st support at 4089.97
The accuracy, completeness and timeliness of the information contained on this site cannot be guaranteed. IC Markets does not warranty, guarantee or make any representations, or assume any liability regarding financial results based on the use of the information in the site.
News, views, opinions, recommendations and other information obtained from sources outside of www.icmarkets.com.au, used in this site are believed to be reliable, but we cannot guarantee their accuracy or completeness. All such information is subject to change at any time without notice. IC Markets assumes no responsibility for the content of any linked site.
The fact that such links may exist does not indicate approval or endorsement of any material contained on any linked site. IC Markets is not liable for any harm caused by the transmission, through accessing the services or information on this site, of a computer virus, or other computer code or programming device that might be used to access, delete, damage, disable, disrupt or otherwise impede in any manner, the operation of the site or of any user’s software, hardware, data or property.