
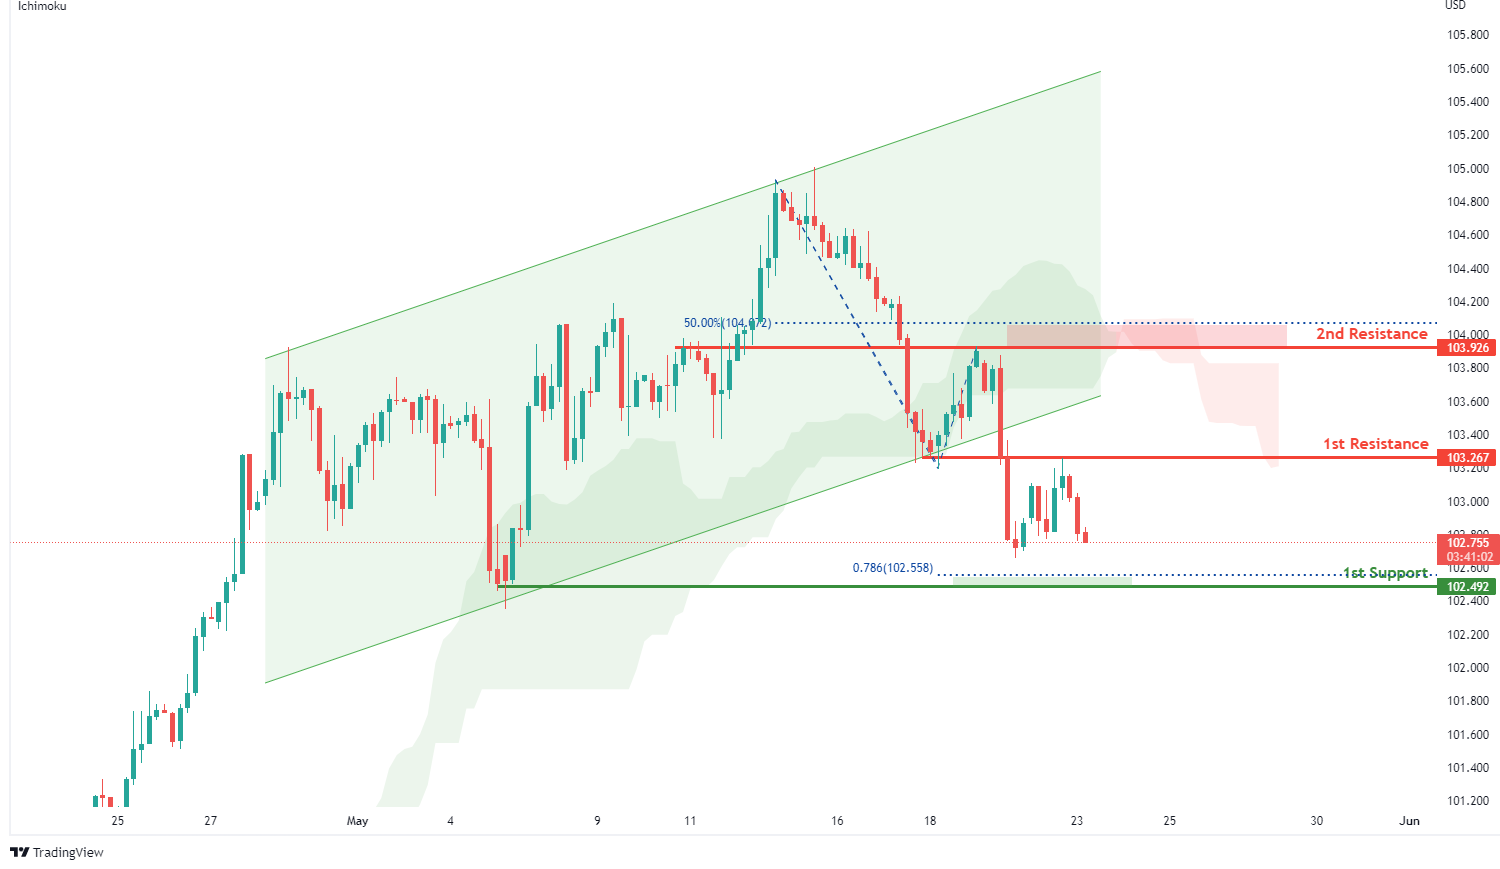
DXY:
On the H4, with prices below the ichimoku indicator and prices breakout of the ascending channel, we have a bearish bias that price will drop to our 1st support at 102.492 where the horizontal swing low support and 78.6% Fibonacci projection are from our 1st resistance at 103.267 in line with the horizontal pullback resistance. Alternatively, price may break 1st resistance structure and head for 2nd resistance at 103.926 where the horizontal swing high resistance and 50% Fibonacci retracement are.
Areas of consideration:
- H4 time frame, 1st resistance at 103.267
- H4 time frame, 1st support at 102.492
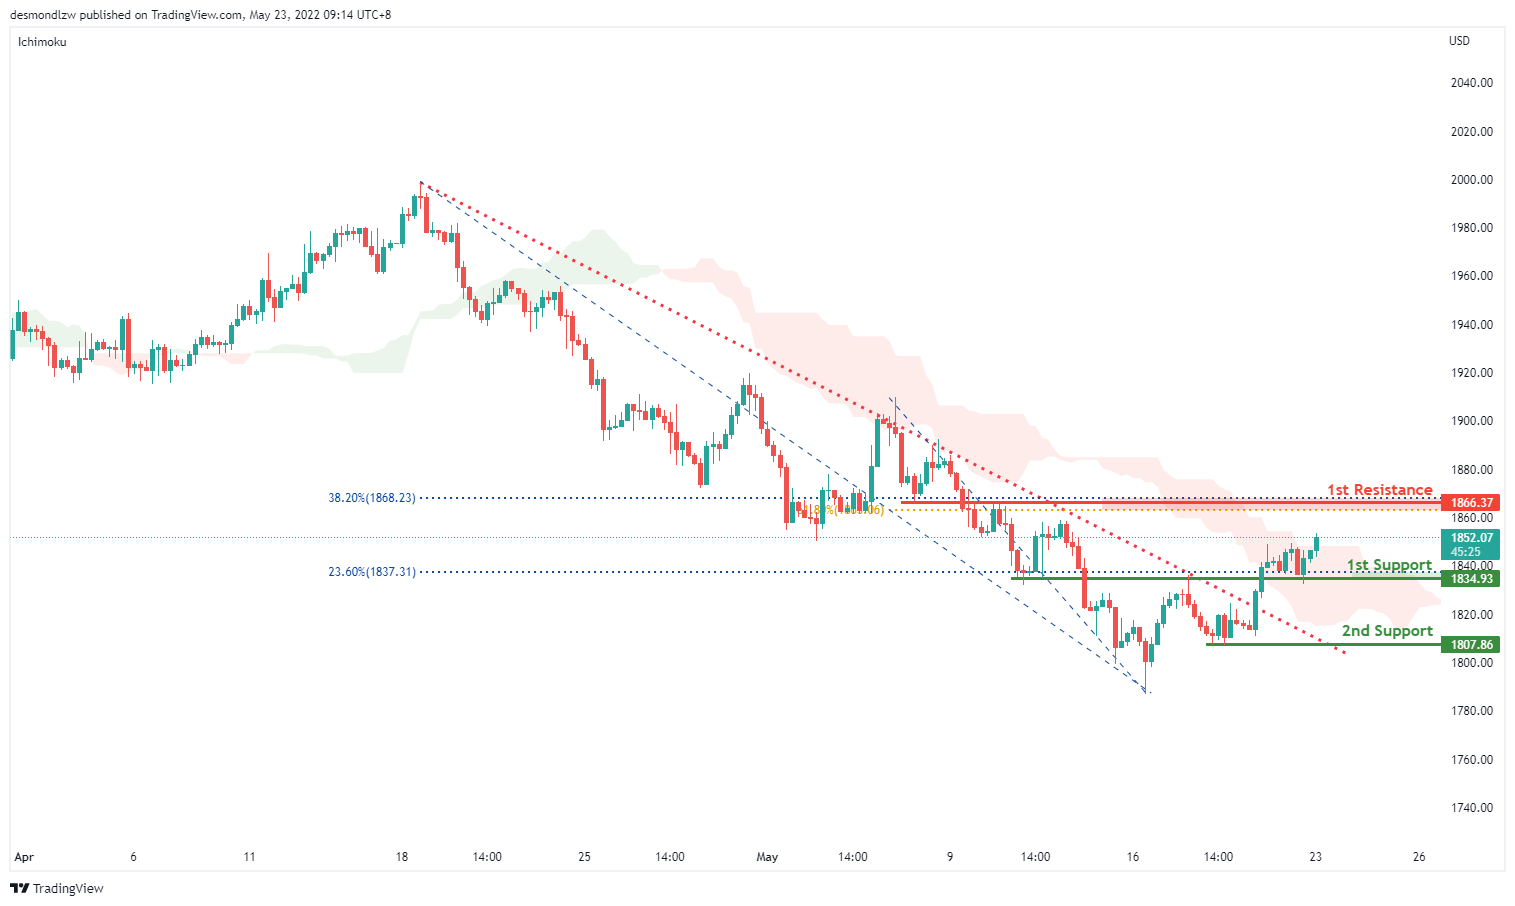
XAU/USD (GOLD):
On the H4, with prices moving above the ichimoku cloud and prices breaking out of the descending trendline,we have a bullish bias that price will rise from our 1st support at 1834.93 where the horizontal overlap support and 23.6% fibonacci retracement is to our 1st resistance at 1866.37 in line with the horizontal overlap resistance, 38.2% Fibonacci retracement and 61.8% Fibonacci retracement. Alternatively, price may break 1st support structure and head for 2nd support at 1807.86 where the horizontal swing low support is.
Areas of consideration:
- H4 time frame, 1st Resistance at 1866.37
- H4 time frame, 1st Support at 1834.93
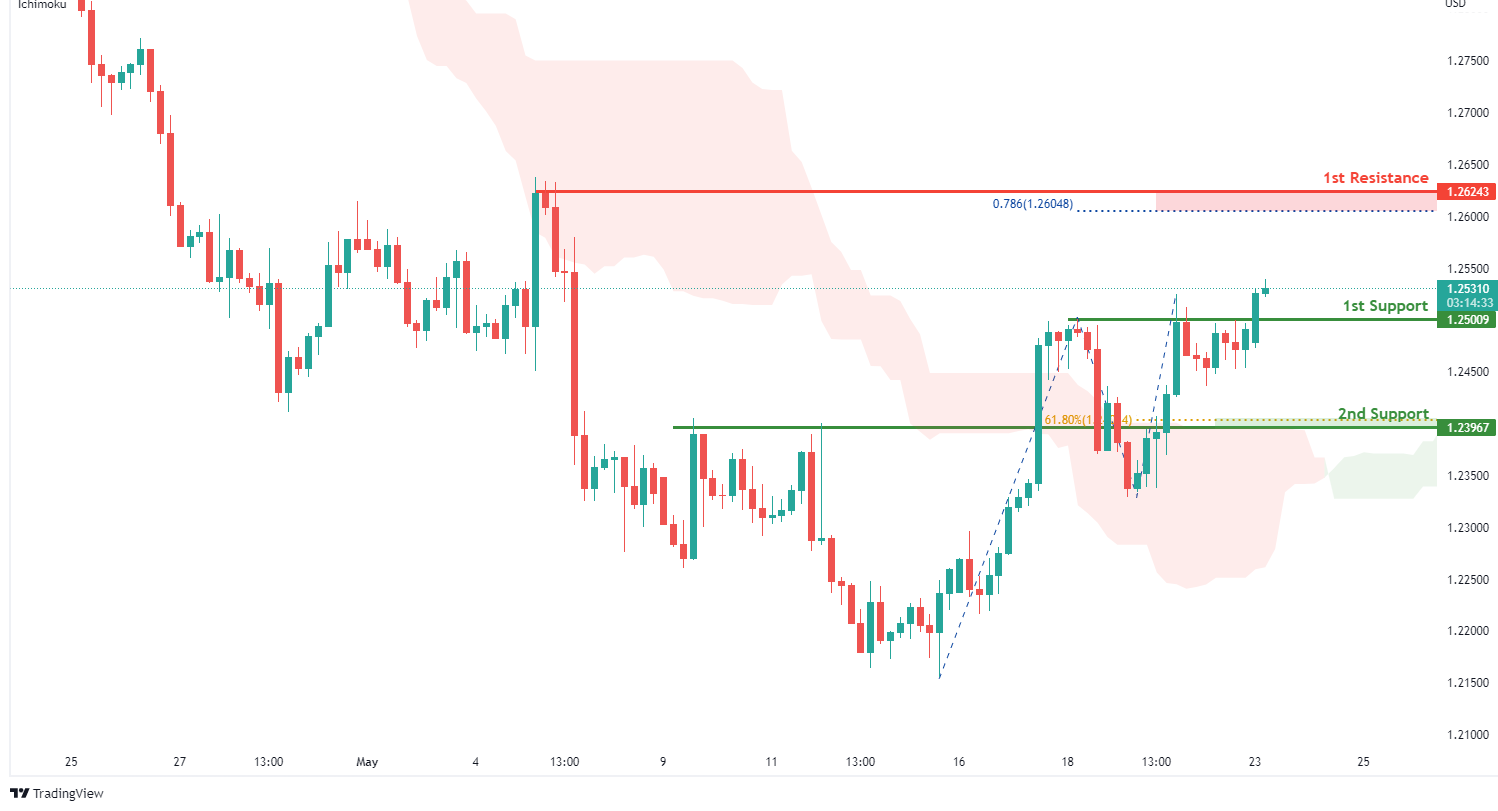
GBP/USD:
On the H4, with price moving above the ichimoku indicator, we have a bullish bias that price will rise from our 1st support at 1.25009 where the horizontal overlap support is to our 1st resistance at 1.26243 in line with the 78.6% Fibonacci projection and horizontal swing high resistance. Alternatively, price may break 1st support structure and head for 2nd support at 1.23967 where the horizontal overlap support and 61.8% Fibonacci retracement are.
Areas of consideration:
- H4 1st resistance at 1.26243
- H4 1st support at 1.25009
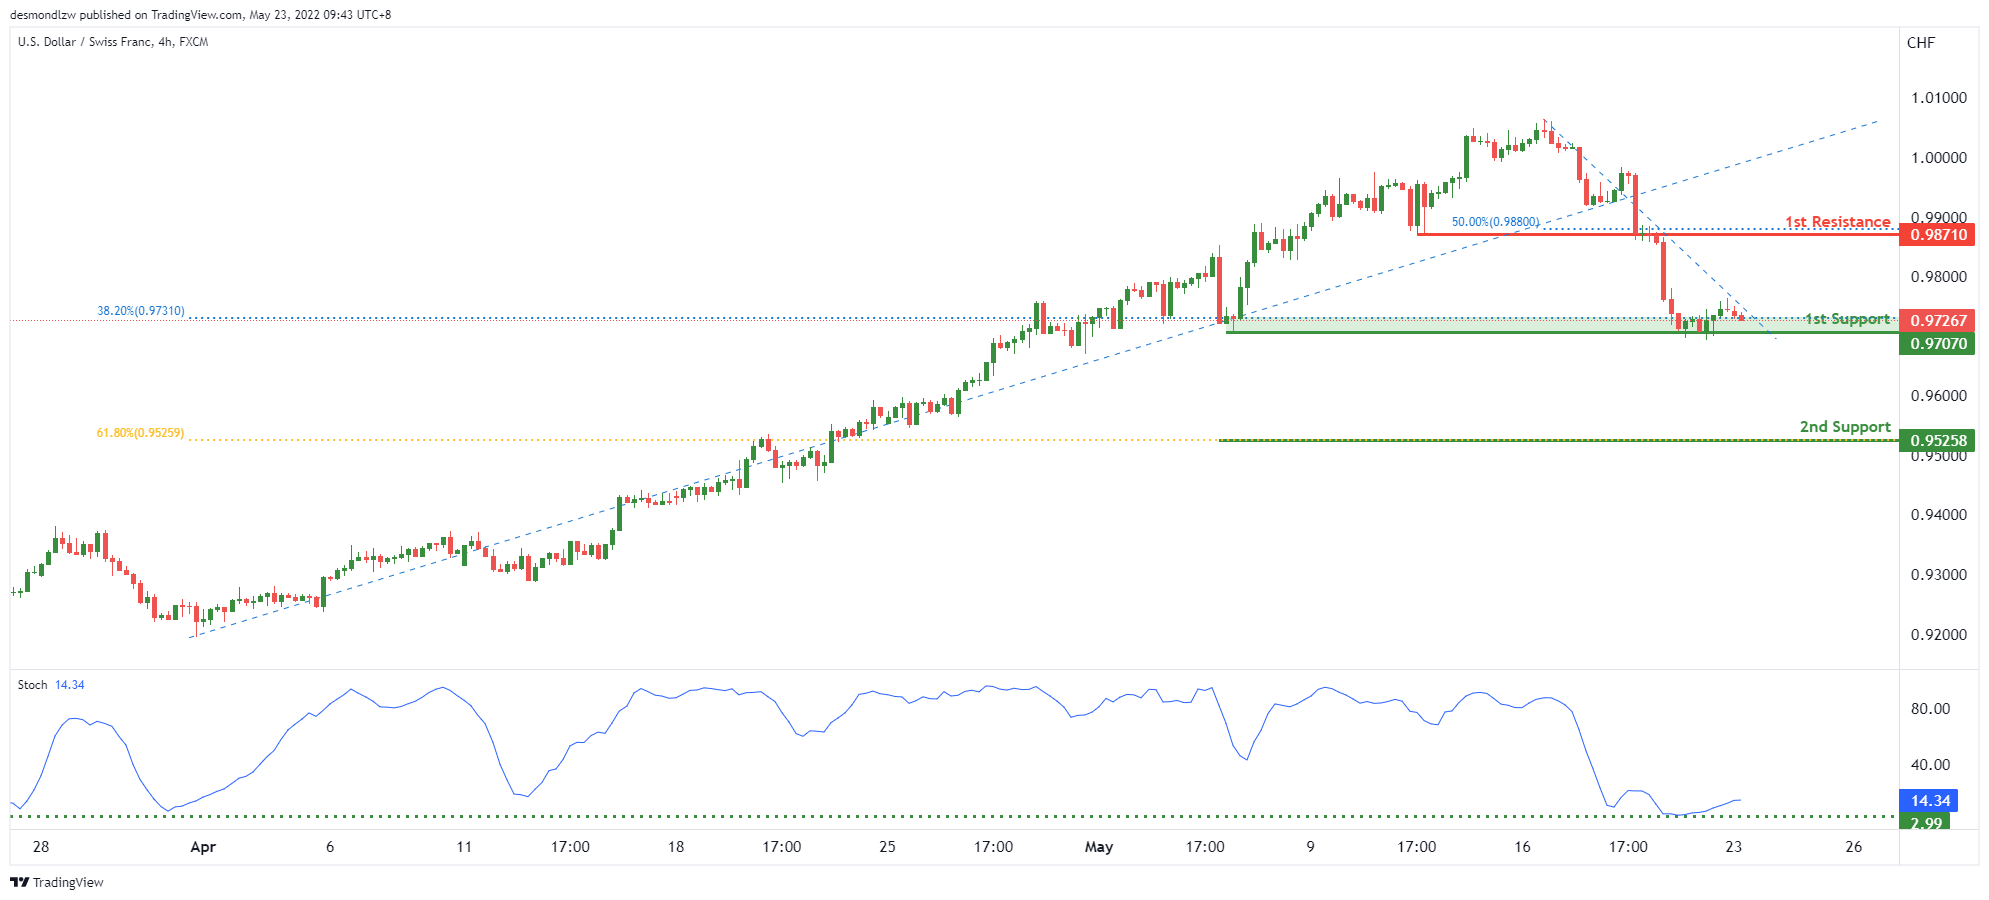
USD/CHF:
On the H4, with price moving above the ichimoku cloud, we have a bullish bias that price will rise to our 1st resistance at 0.98710 where the 50% Fibonacci retracement is from our 1st support at 0.97070 in line with the swing low support. Alternatively, price may break 1st resistance structure and head for 2nd resistance where the 61.8% Fibonacci retracement.
Areas of consideration
- 1st support level at 0.97070
- 1st resistance level at 0.98710
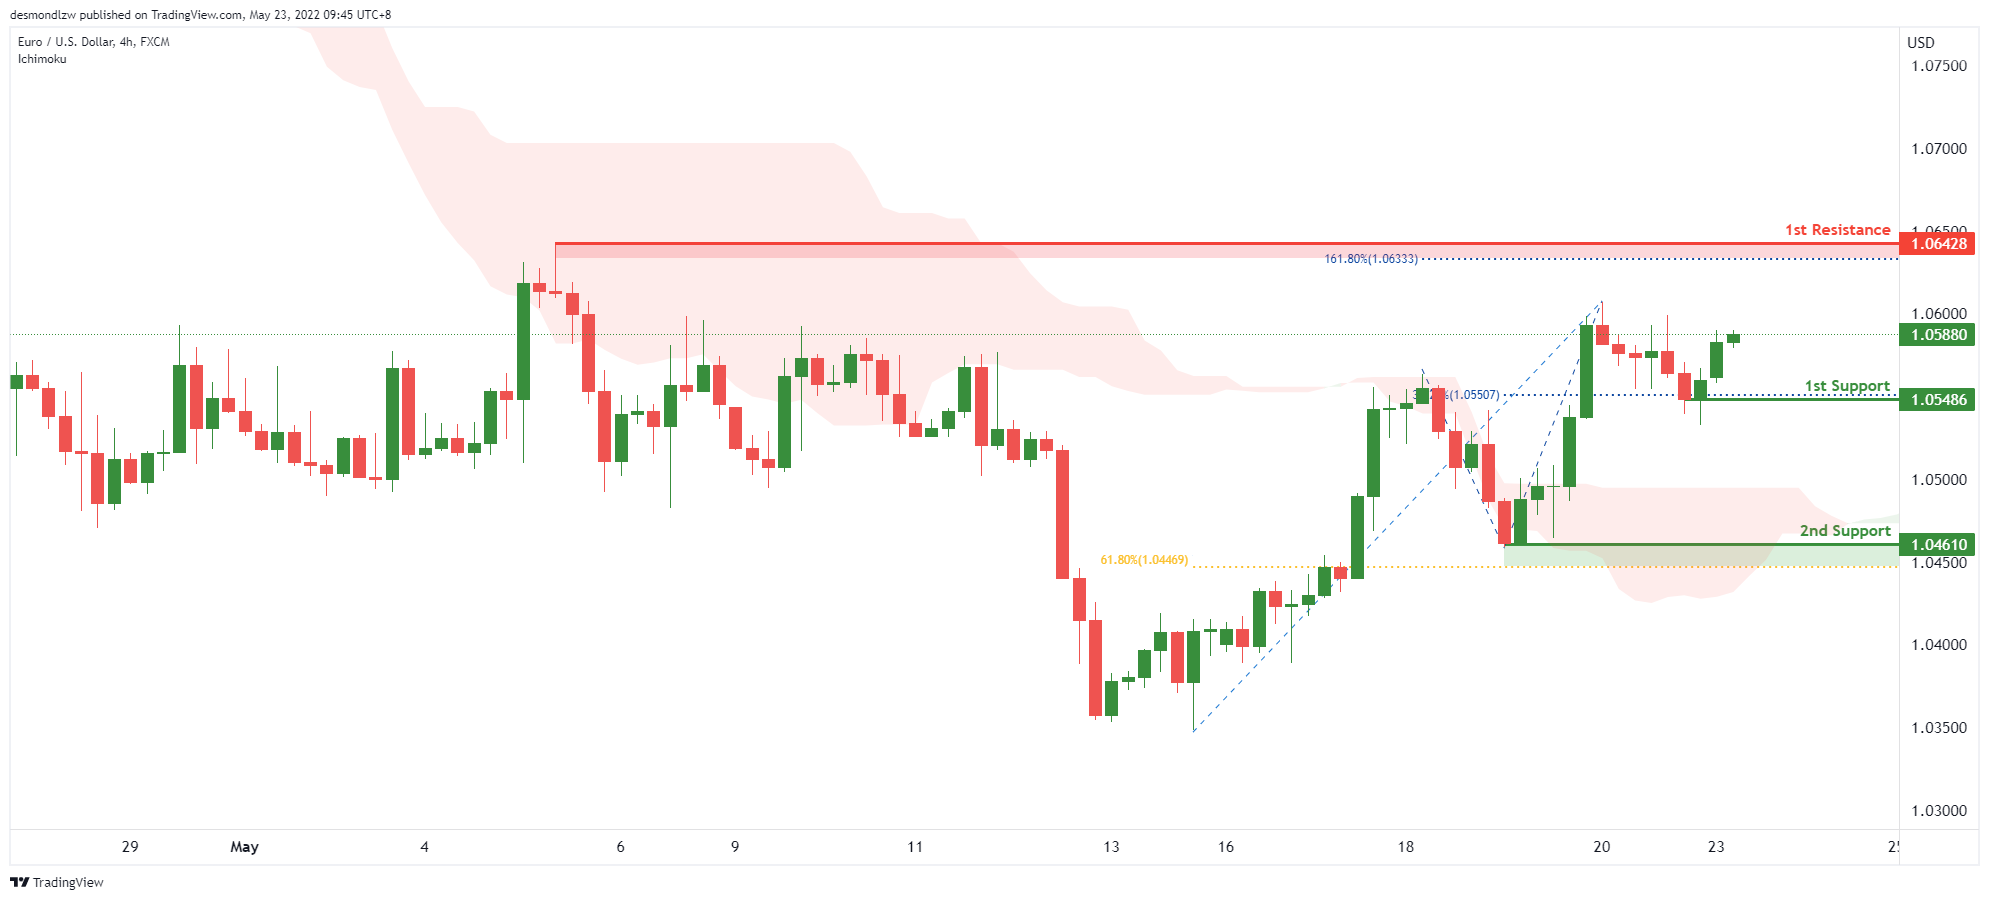
EUR/USD :
On the H4, with price moving above the ichimoku cloud, we have a bullish bias that price will rise to our 1st resistance at 1.06428 where the 161.8% Fibonacci extension is from our 1st support at 1.05486 in line with the pullback support. Alternatively, price may break 1st resistance structure and head for 2nd support where the 61.8% Fibonacci retracement.
Areas of consideration :
- H4 1st resistance at 1.06428
- H4 1st support at 1.05486
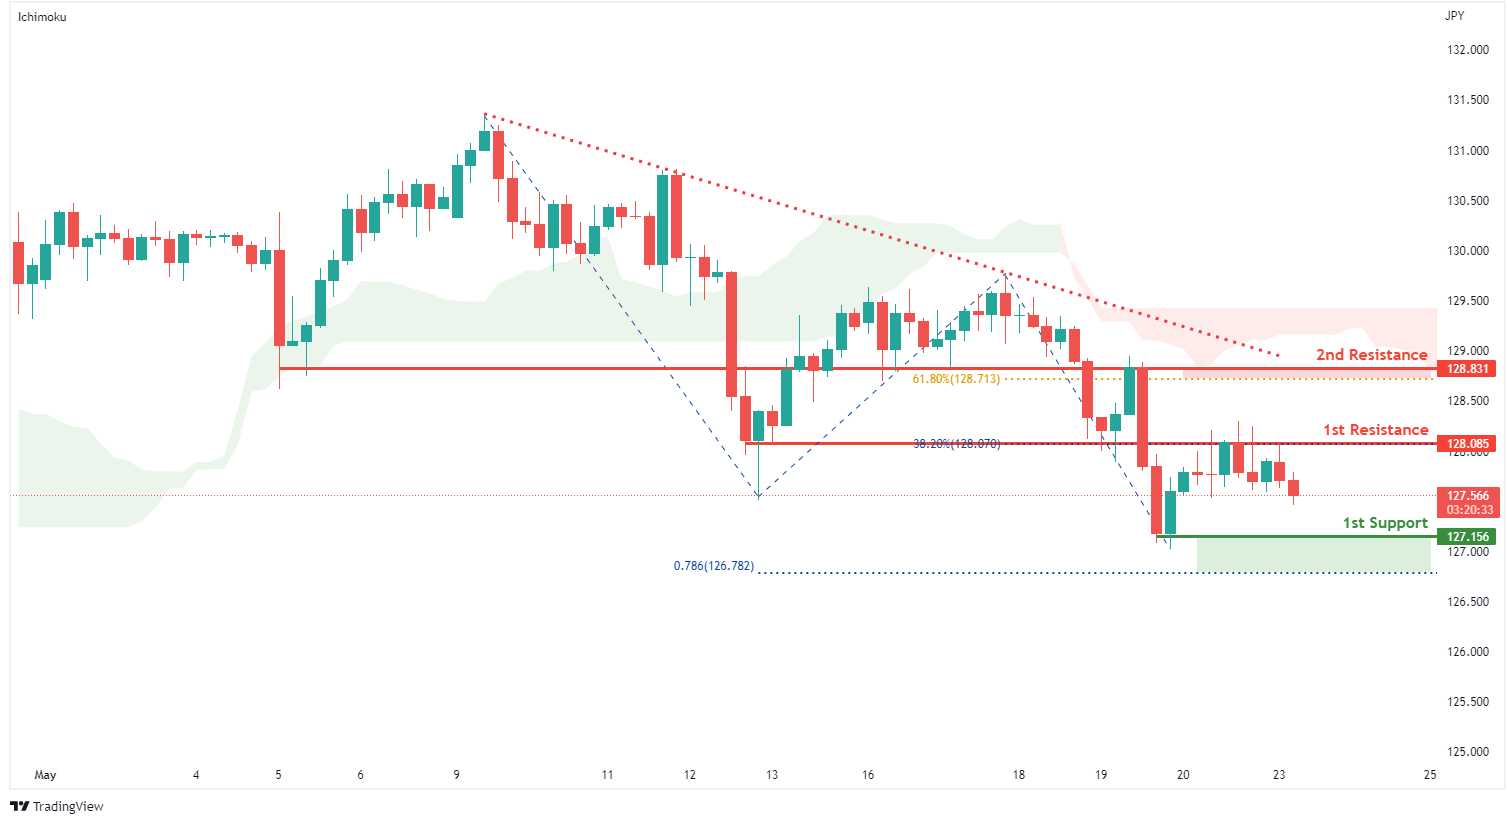
USD/JPY:
On the H4, with prices moving below the ichimoku indicator, we have a bearish bias that price will drop from our 1st resistance at 128.085 where the 38.2% Fibonacci retracement and horizontal overlap resistance is to our 1st support at 127.156 in line with the 78.6% Fibonacci projection and horizontal swing low support. Alternatively, price may break 1st resistance structure and head for 2nd resistance at 128.831 where the horizontal overlap resistance and 61.8% Fibonacci retracement is.
Areas of consideration:
- H4 time frame, 1st resistance at 128.085
- H4 time frame, 1st support at 127.156
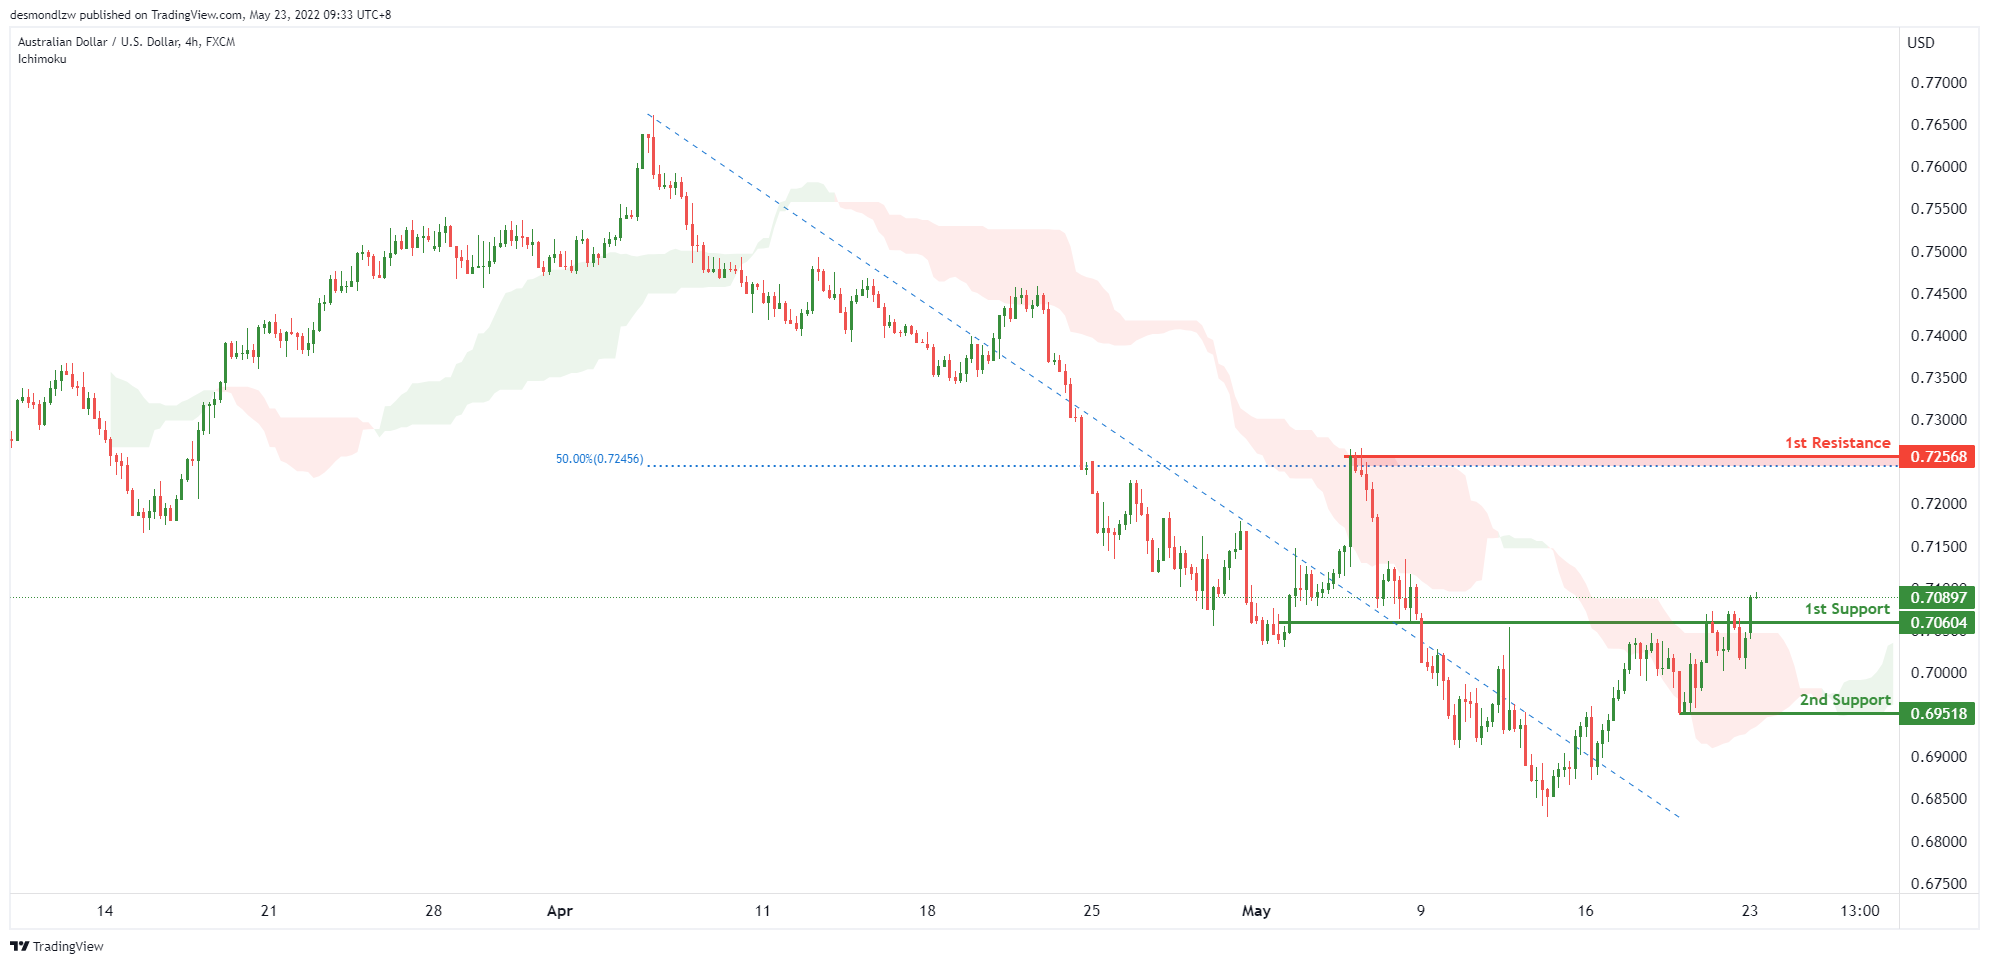
AUD/USD:
On the H4, with price moving above the ichimoku cloud, we have a bullish bias that price will rise to our 1st resistance at 0.72568 where the 50% Fibonacci retracement is from our 1st support at 0.70604 in line with the pullback support. Alternatively, price may break structure and head for 2nd support where the swing low support is.
Areas of consideration
- H4 1st resistance at 0.72568
- H4 1st support at 0.70604
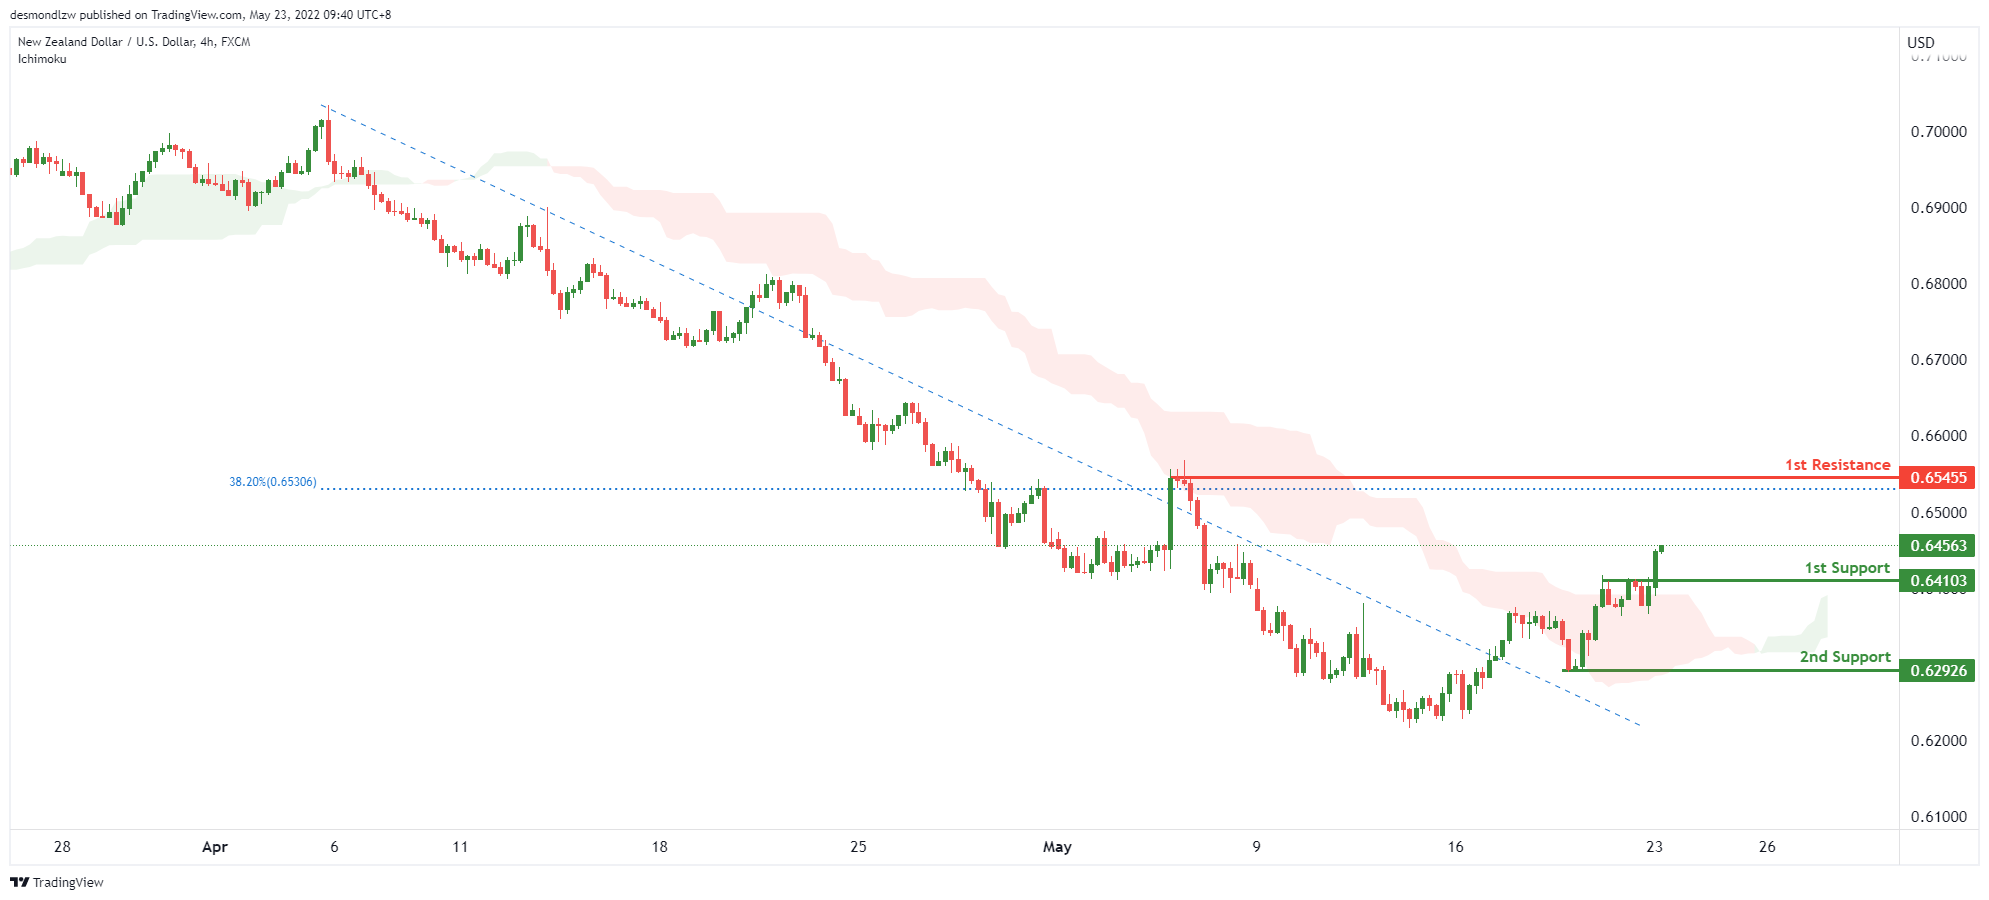
NZD/USD:
On the H4, with price moving above the ichimoku cloud, we have a bullish bias that price will rise to our 1st resistance at 0.65455 where the 38.2% Fibonacci retracement is from our 1st support at 0.64103 in line with the pullback support. Alternatively, price may break structure and head for 2nd support where the swing low support is.
Areas of consideration:
- H4 time frame, 1st support at 0.62288
- H4 time frame, 1st resistance at 0.63669
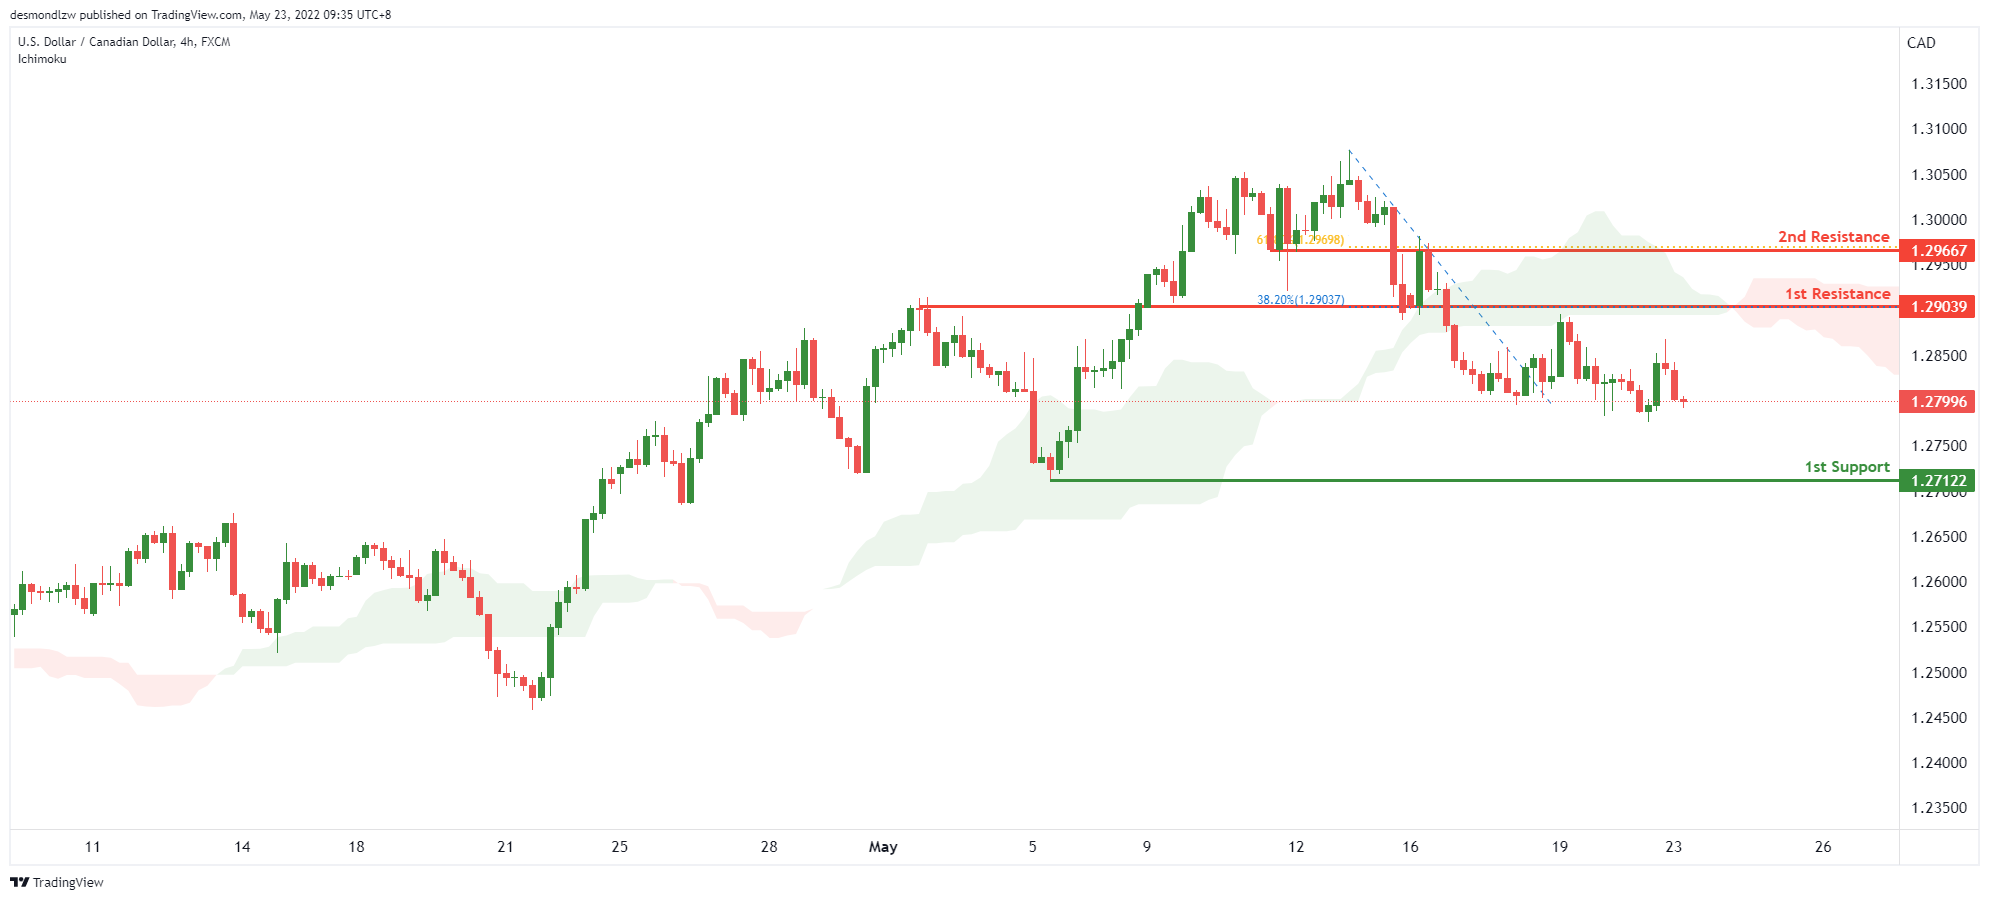
USD/CAD:
On the H4, with price moving below the ichimoku, we have a bearish bias that price will drop from our 1st resistance at 1.29039 where the horizontal pullback resistance is to our 1st support at 1.27122 in line with the swing low support. Alternatively, price may break 1st resistance structure and head for 2nd resistance where the horizontal swing high resistance is.
Areas of consideration:
- H4 time frame, 1st resistance at 1.29039
- H4 time frame, 1st support at 1.27122
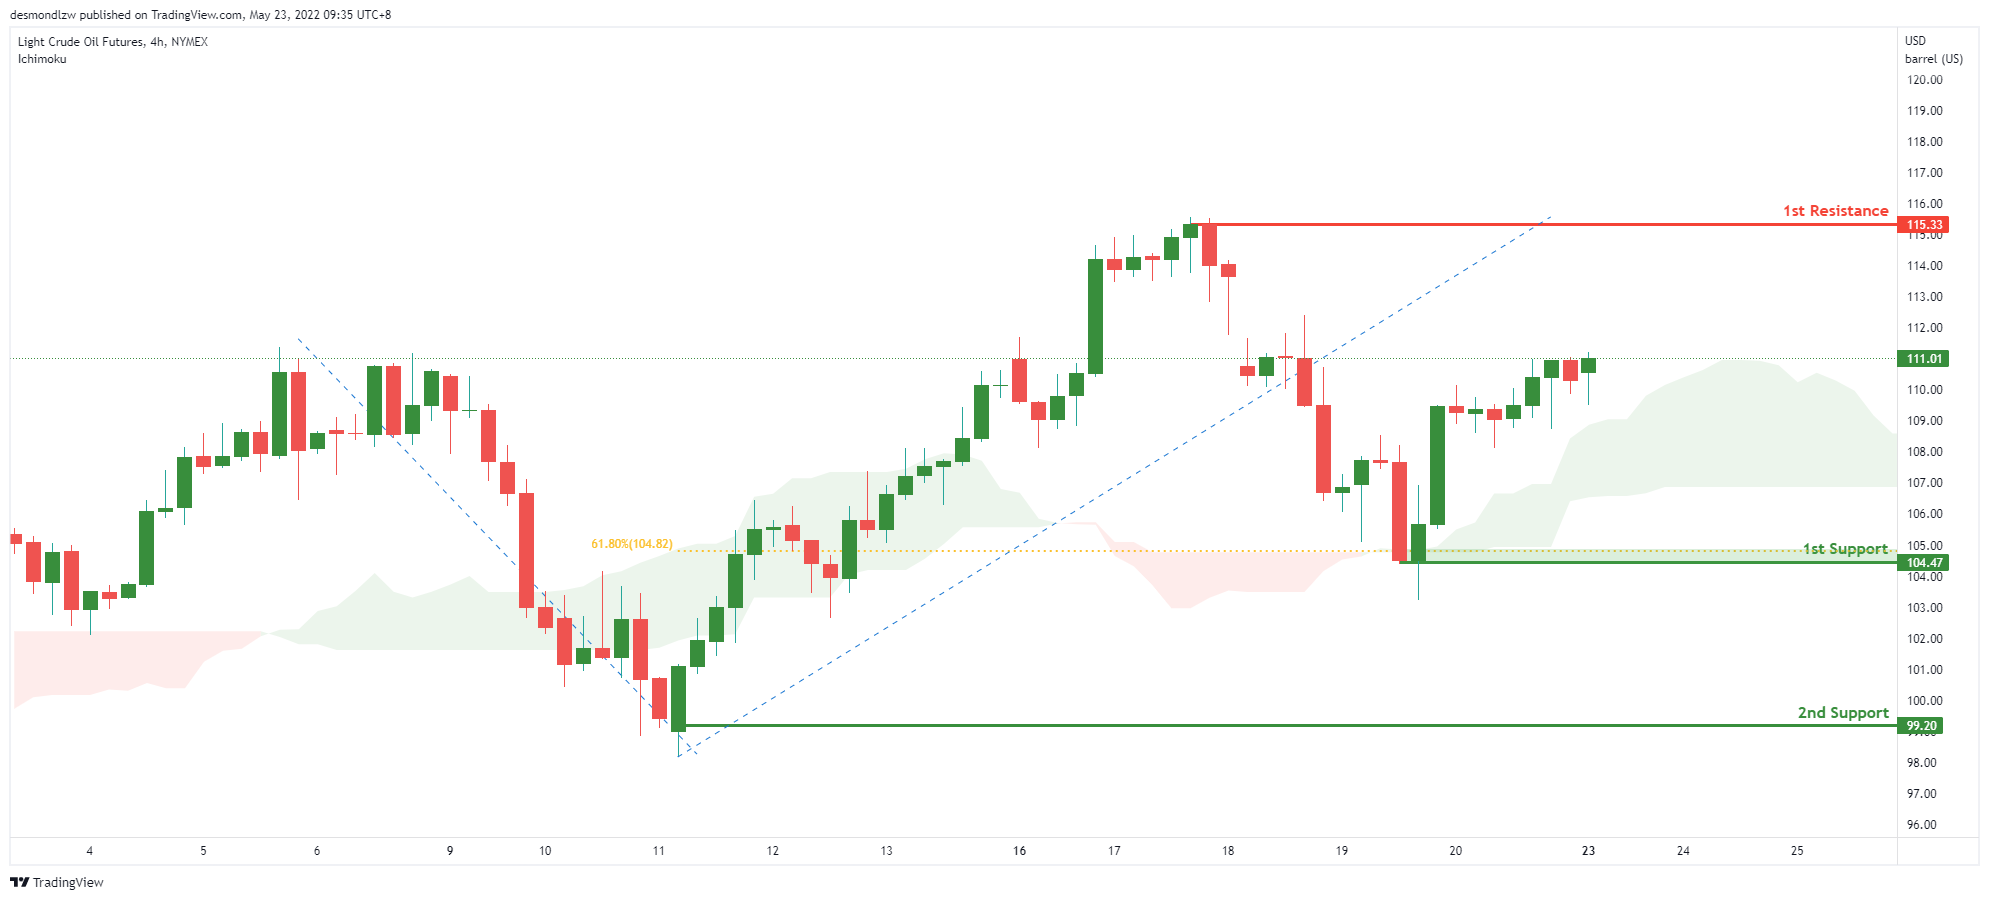
OIL:
On the H4, with price expected to bounce off the ichimoku cloud, we have a bullish bias that price will rise to our 1st resistance at 111.36 where the 23.6% Fibonacci retracement from our 1st support at 106.74 in line with the horizontal overlap support and 50% fibonacci retracement. Alternatively, price may break 1st support structure and head for 2nd support where the horizontal pullback resistance is.
Areas of consideration:
- H4 time frame, 1st resistance of 111.36
- H4 time frame, 1st support of 106.74
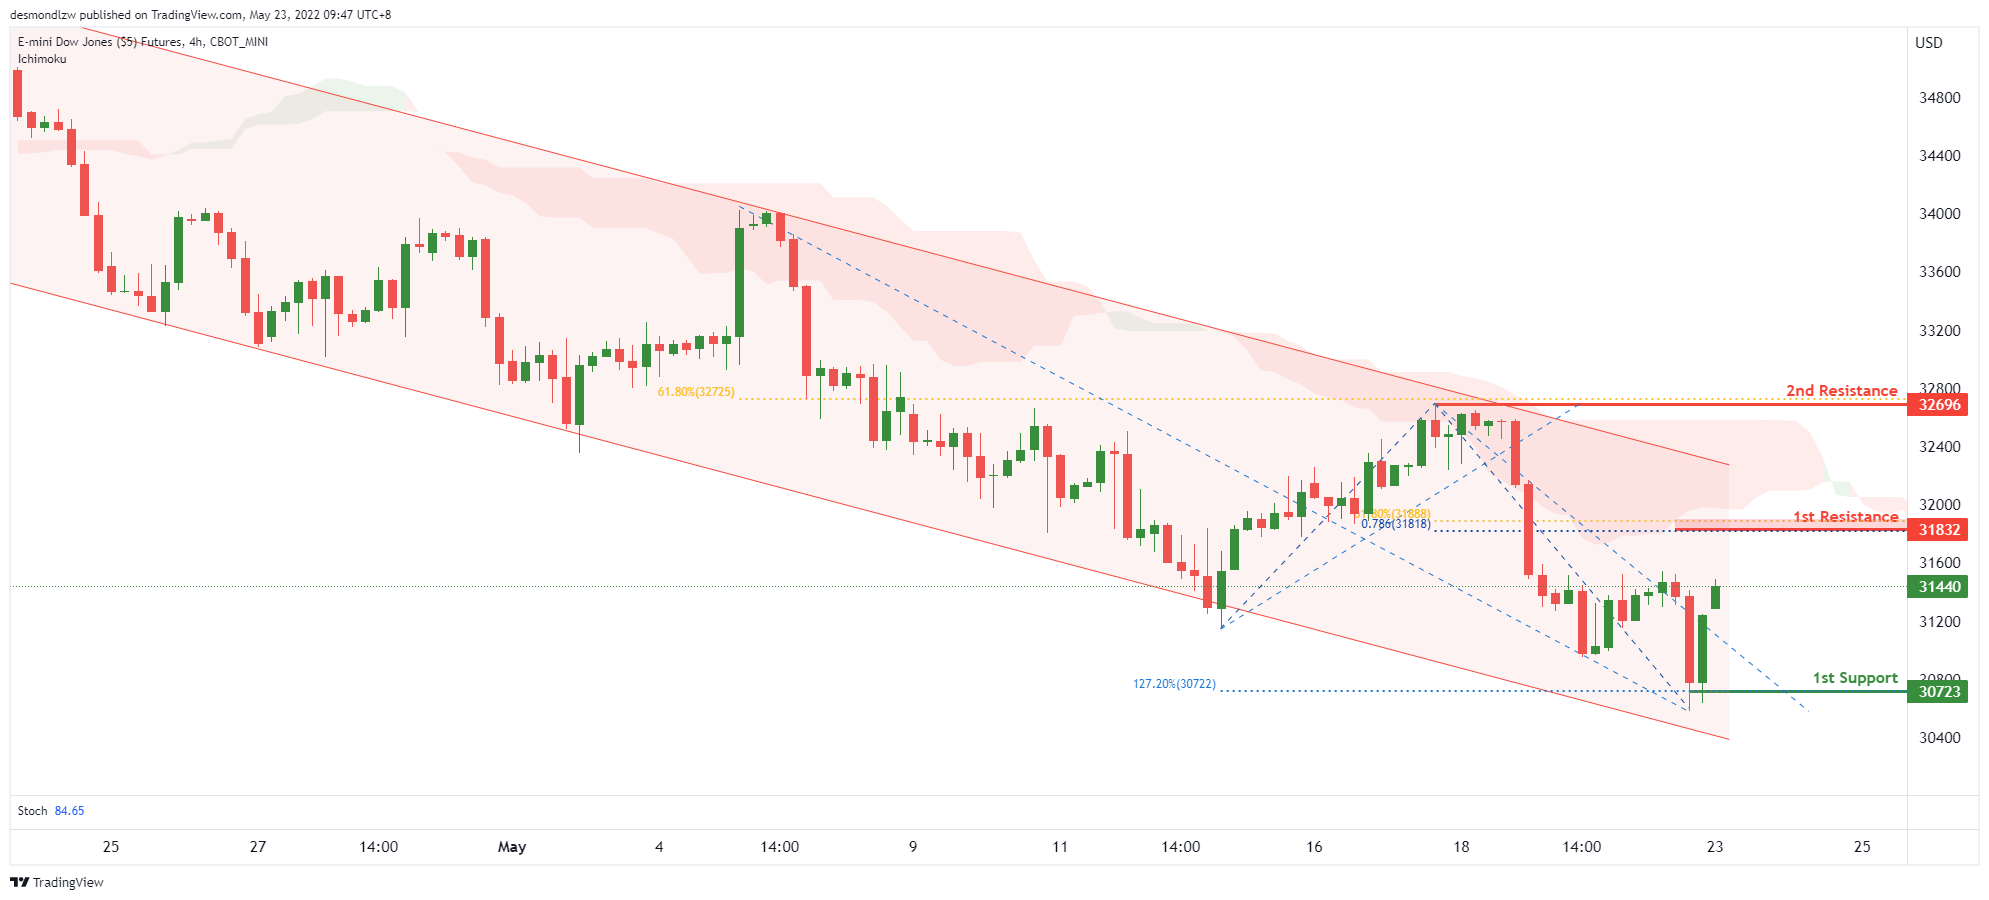
Dow Jones Industrial Average:
On the H4, with price expected to bounce off the stochastics indicator, we have a bullish bias that price will rise to our 1st resistance at 31835 where the 23.6% Fibonacci retracement from our 1st support at 31167 in line with the horizontal overlap support and 50% fibonacci retracement. Alternatively, price may break 1st support structure and head for 2nd support where the horizontal pullback resistance is.
Areas of consideration :
- H4 time frame, 1st resistance at 31835
- H4 time frame, 1st support at 31167
The accuracy, completeness and timeliness of the information contained on this site cannot be guaranteed. IC Markets does not warranty, guarantee or make any representations, or assume any liability regarding financial results based on the use of the information in the site.
News, views, opinions, recommendations and other information obtained from sources outside of www.icmarkets.com.au, used in this site are believed to be reliable, but we cannot guarantee their accuracy or completeness. All such information is subject to change at any time without notice. IC Markets assumes no responsibility for the content of any linked site.
The fact that such links may exist does not indicate approval or endorsement of any material contained on any linked site. IC Markets is not liable for any harm caused by the transmission, through accessing the services or information on this site, of a computer virus, or other computer code or programming device that might be used to access, delete, damage, disable, disrupt or otherwise impede in any manner, the operation of the site or of any user’s software, hardware, data or property.


