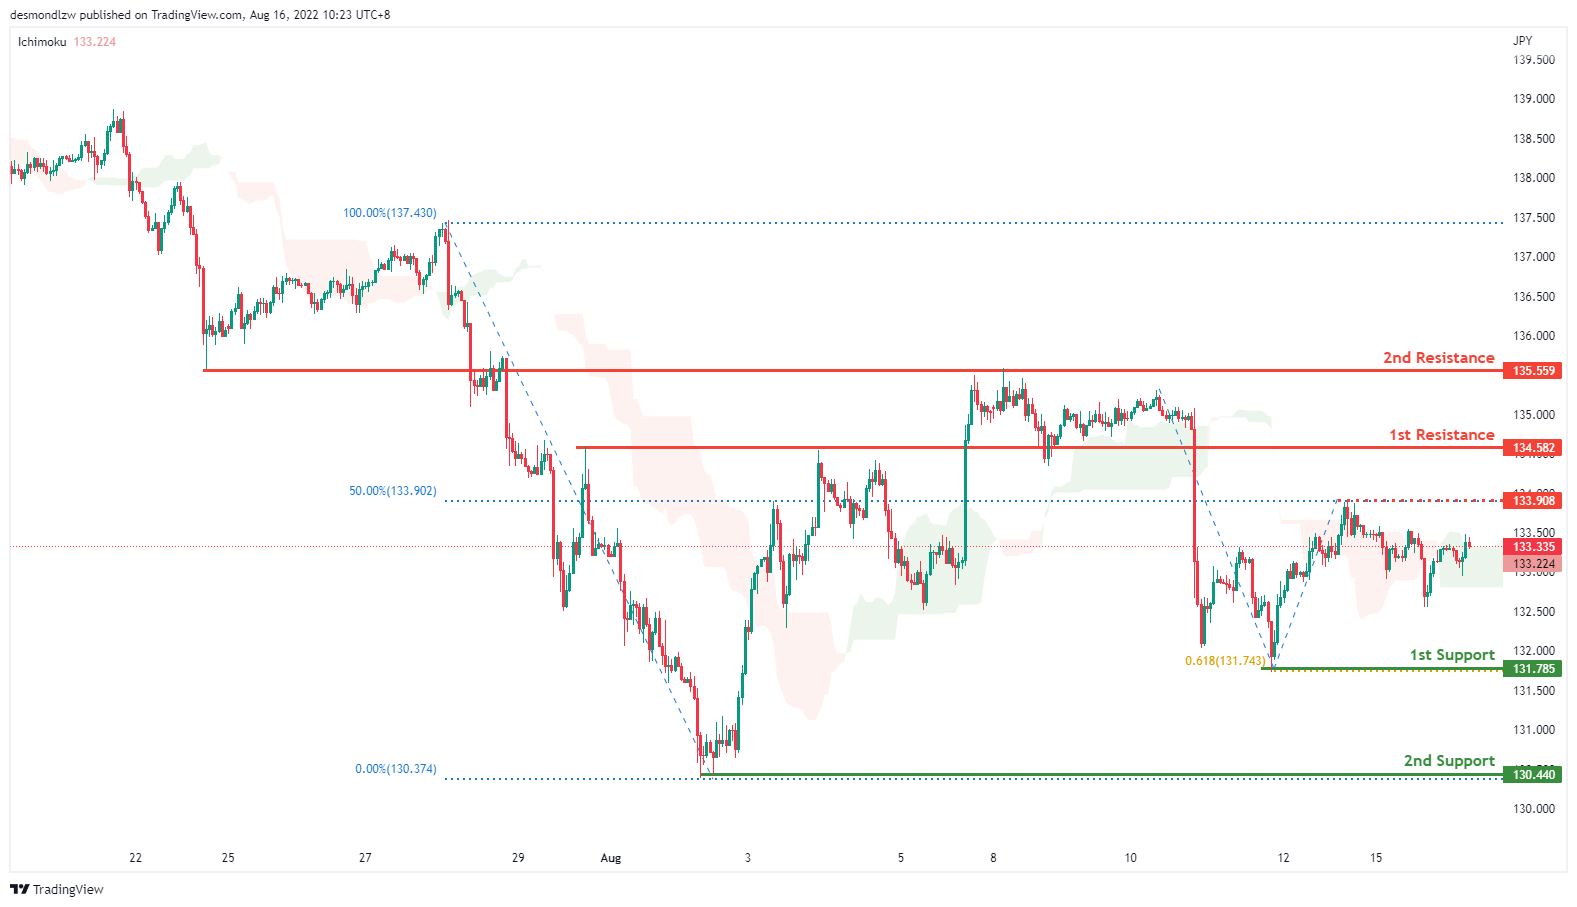
USD/JPY:
On the H4 chart, prices seem to have pulled back a little but the overall trend is still bearish biased. Price is moving toward the intermediate resistance at 133.908 which is the 50% Fibonacci retracement. If prices break the intermediate resistance, it will test the first resistance at 134.582 where the previous swing high sits. Alternatively, it the bearish momentum continues it will pull back to test the first support at 131.785
Areas of consideration:
- H4 time frame, 1st resistance at 134.582
- H4 time frame, 1st support at 131.785
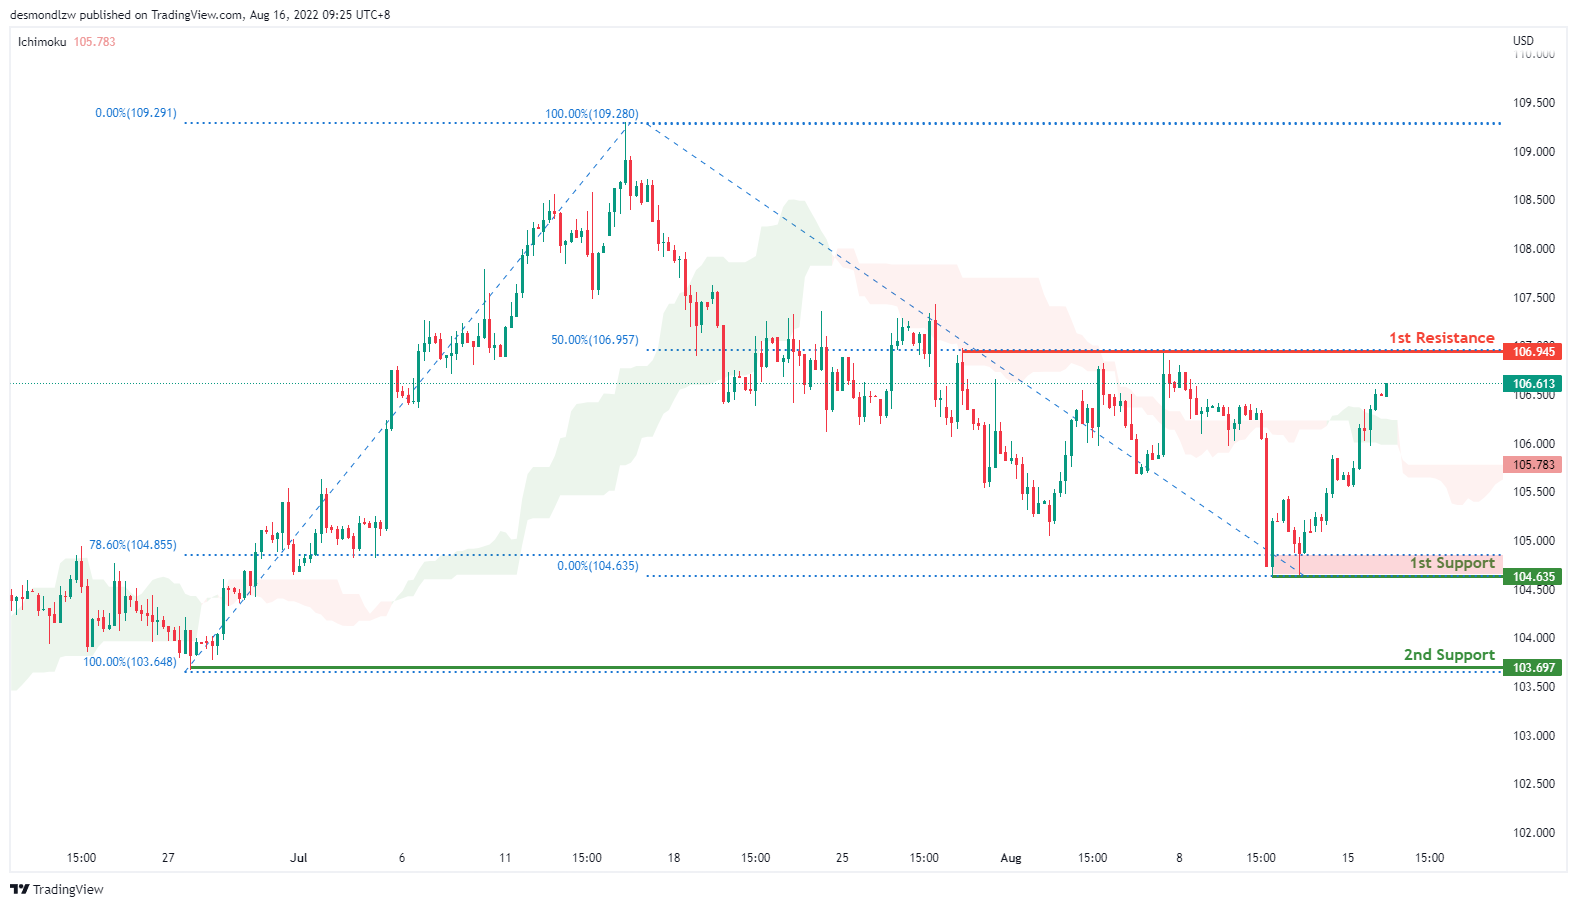
DXY:
On the H4, prices seem to be moving in an ascending trend and is in a bullish momentum. Prices look like it’s going toward the first resistance at 106.945 where the 50% Fibonacci retracement and the previous swing high sits. If price fails to break the first resistance, it will pull back to test the first support at 104.635 where the 78.6% retracement is and subsequently the second support at 103.697 which is the previous swing low
Areas of consideration:
- H4 time frame, 1st resistance at 106.945
- H4 time frame, 1st support at 104.635
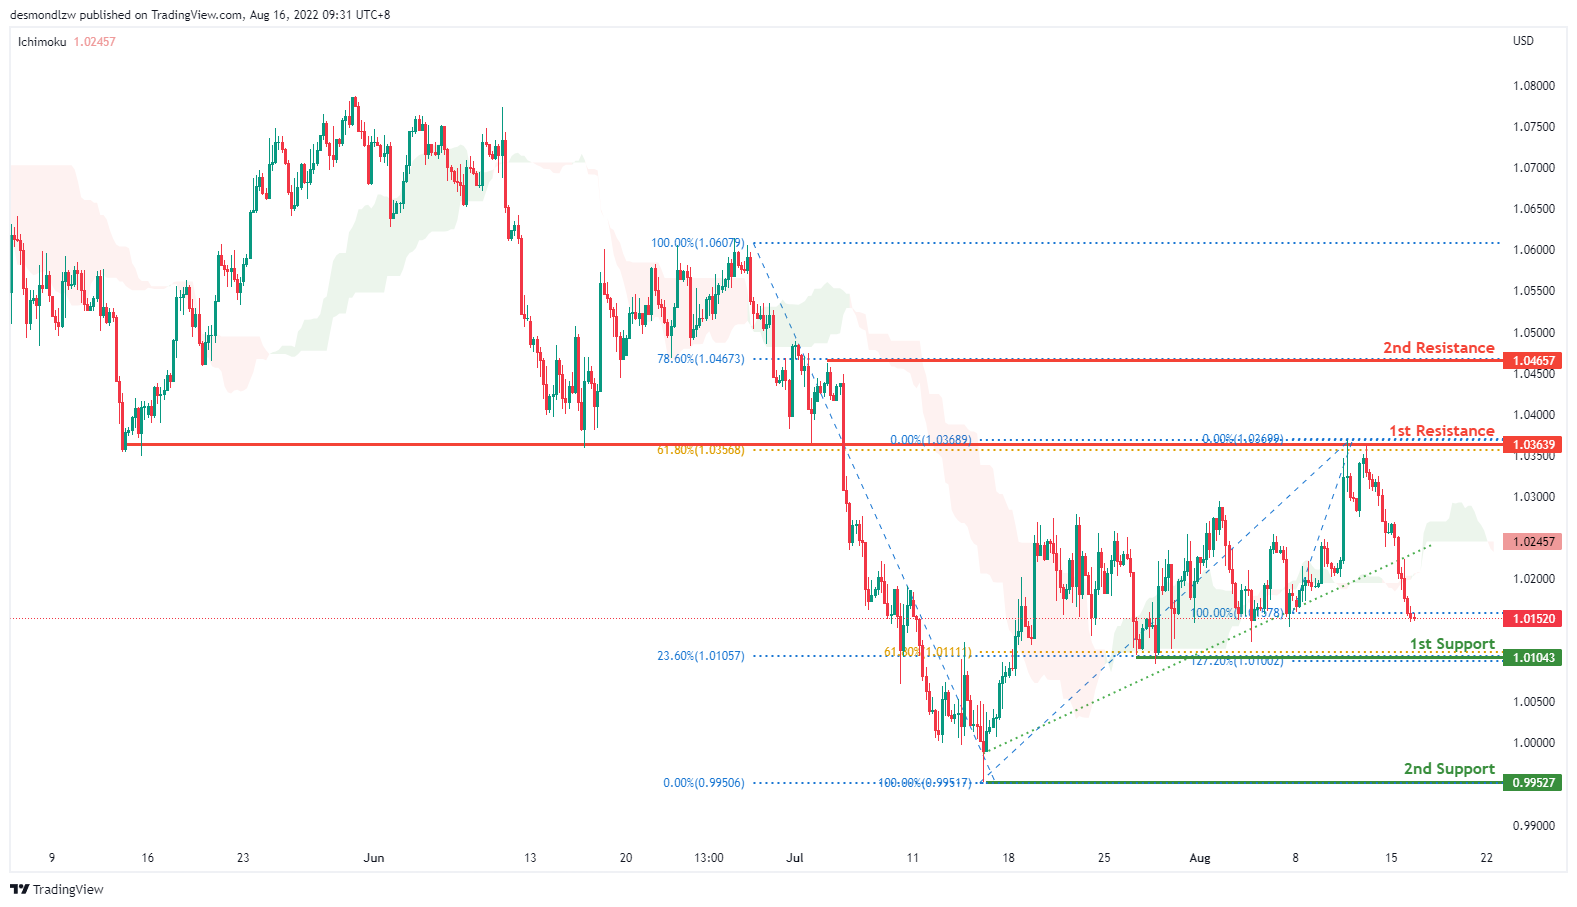
EUR/USD :
On the H4, prices have broken the ascending trend and are below the ichimoku indicator, we are bearish bias. Prices are pulling back to test the first support at 1.0104 where the 61.8% Fibonacci retracement and 127.2% extension sits. If prices continue in the bearish momentum, it will test the second support at 0.9952. Alternatively price could go back to test the first resistance at 1.0363 where the 61.8% Fibonacci retracement sits and then the second resistance at 1.0465
Areas of consideration :
- H4 1st resistance at 1.0363
- H4 1st support at 1.0104
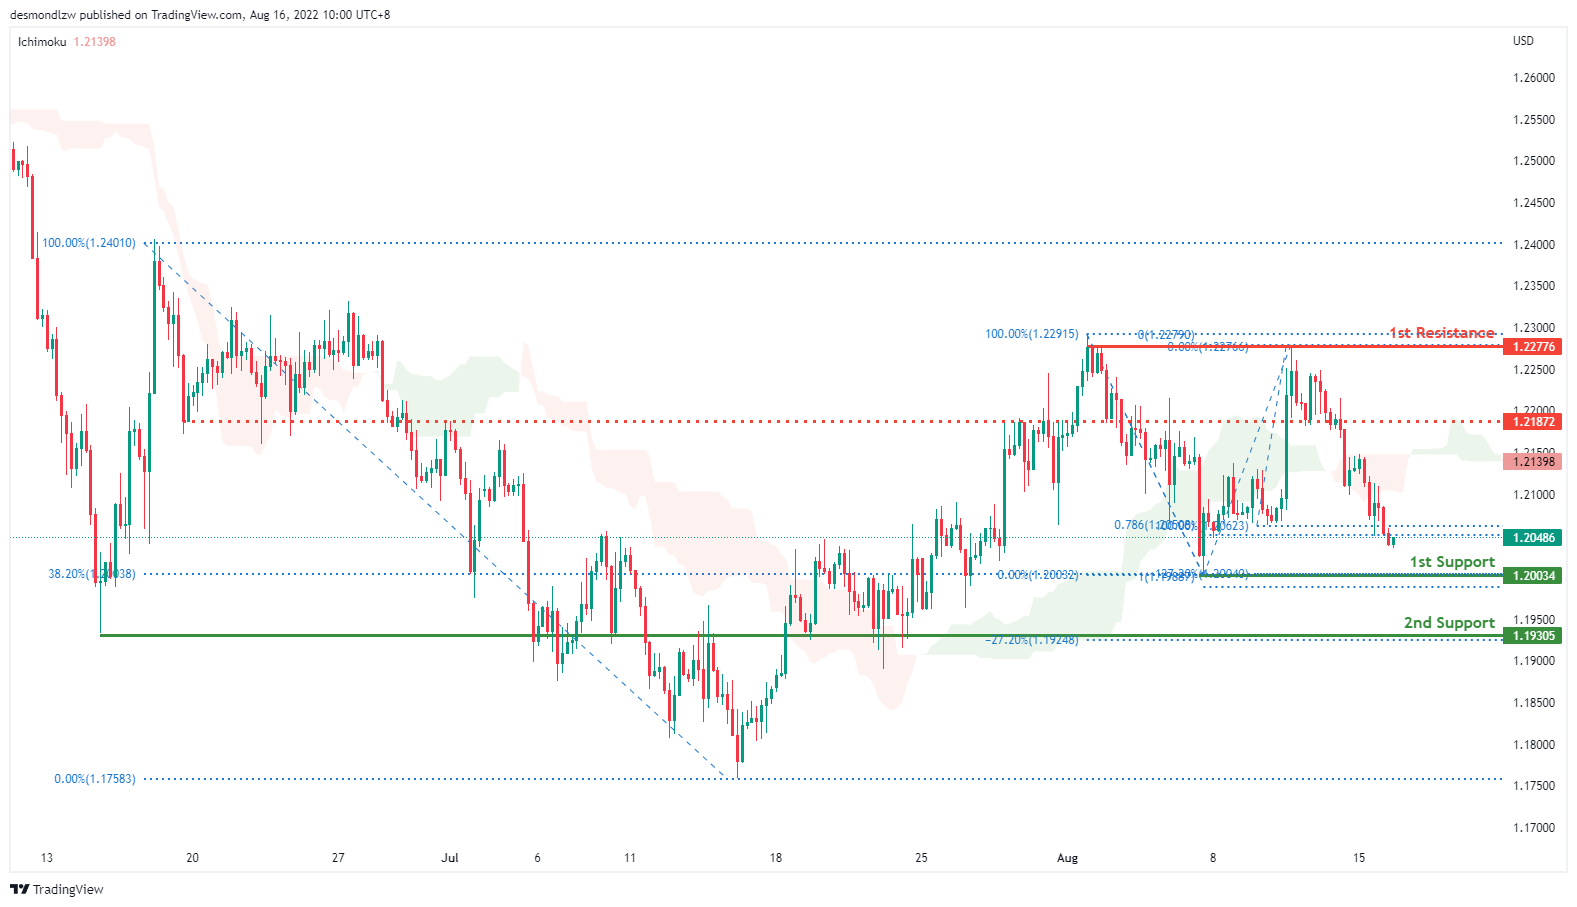
GBP/USD:
On the H4, prices seem to be in a bearish momentum. It is currently testing the 78.6% Fibonacci projection and if the bearish momentum continues, it will pull prices to our first support 1.2003 where our 100% Fibonacci projection, 127.2% extension and 38.2% retracement sits. If prices pull back further it will test the second support at 1.1930. Alternatively price could hit our intermediate resistance at 1.2187 and the first resistance at 1.2277
Areas of consideration:
- H4 1st resistance at 1.2277
- H4 1st support at 1.2003
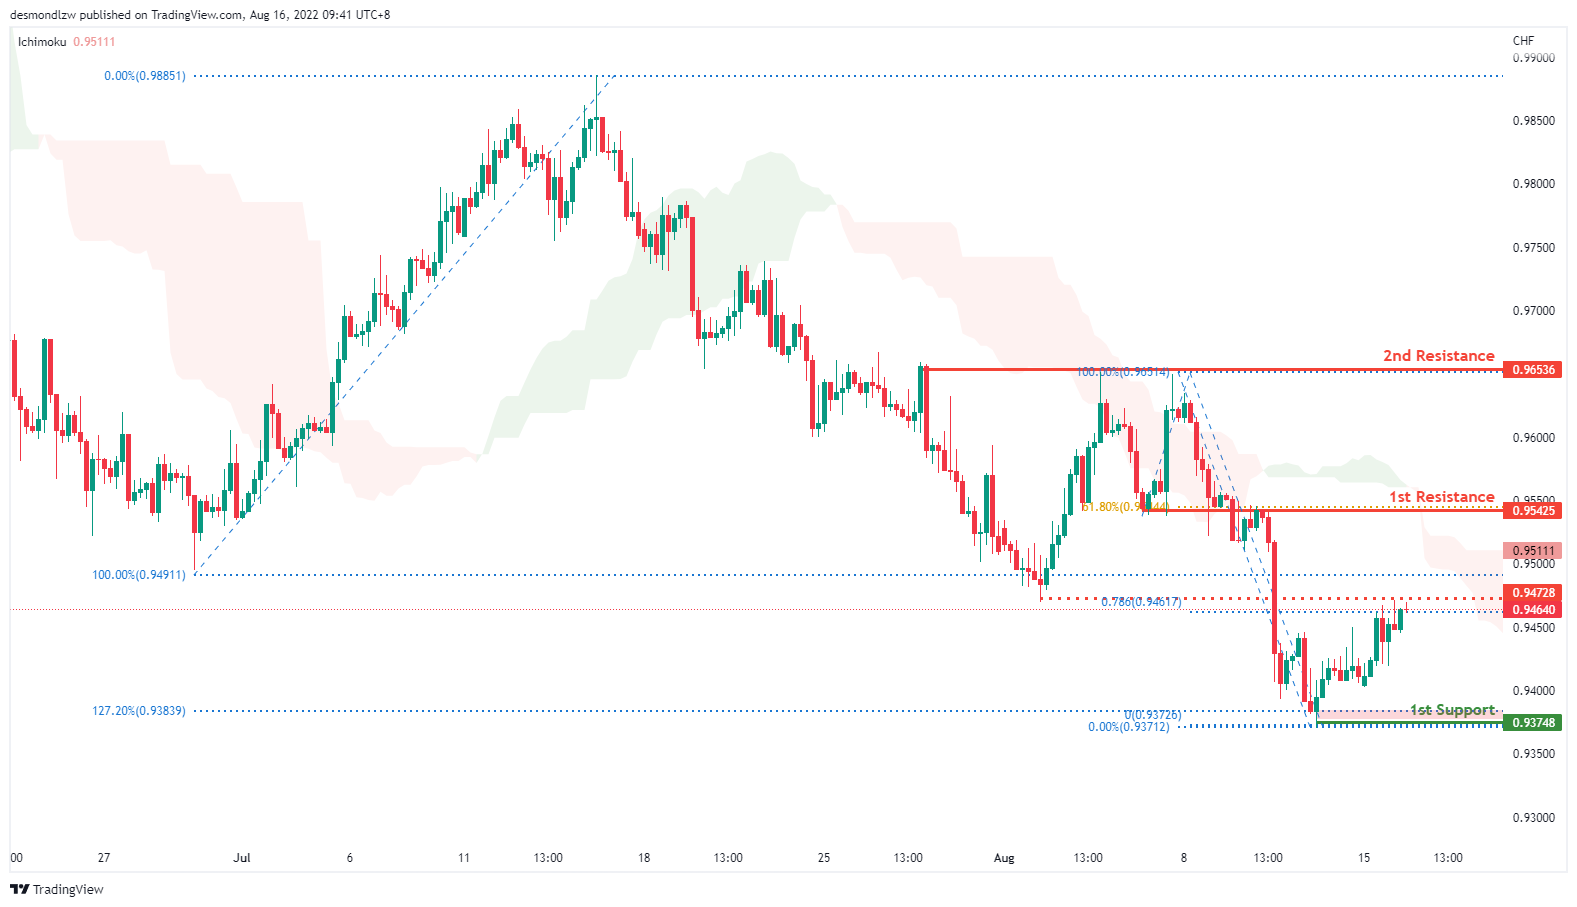
USD/CHF:
On the H4, with prices moving below the ichimoku cloud hence we have a bearish bias that the price will continue with the bearish momentum. Price is now testing at the 78.6% Fibonacci projection as well as the previous swing low. If bearish momentum continues, it should pull back to test at the first support 0.937 which also coincides with the Fibonacci 127.2% extension. If prices fail to break first support, it may test the first resistance at 0.954 where the 61.8% fibonacci retracement and previous swing low sits. If prices continues with bullish momentum, it will then pull back further to test at the second resistance 0.965
Areas of consideration
- H4 1st support at 0.937
- H4 1st resistance at 0.954
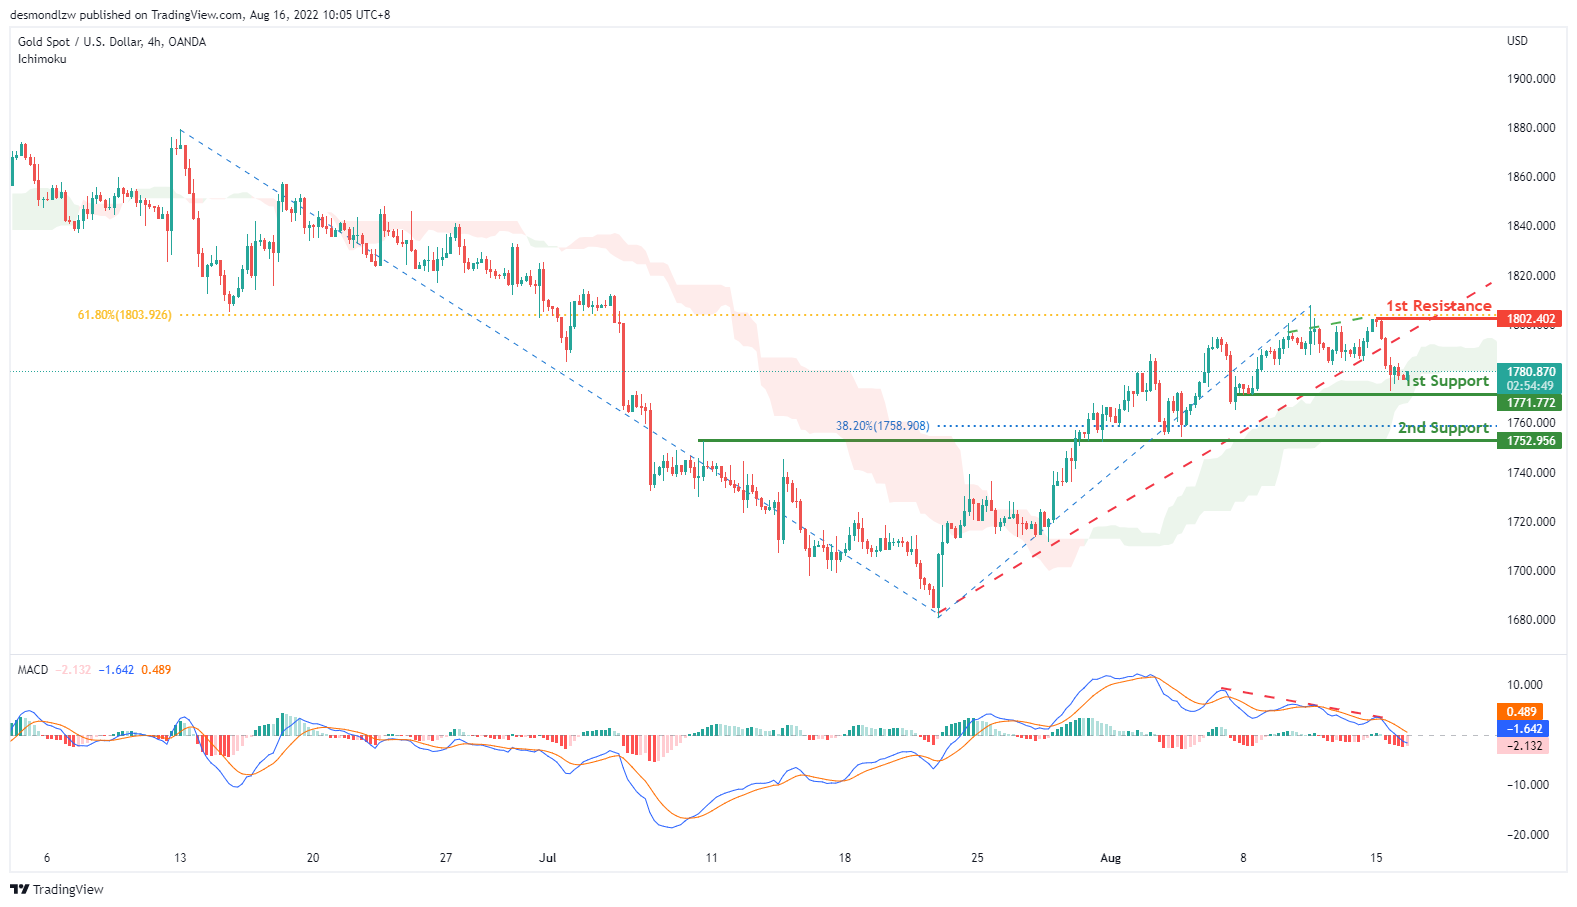
XAU/USD (GOLD):
On the H4, with prices breaking along the ascending channel and there is a bearish divergence of price and MACD, we have a bearish bias that the price may drop from the 1st support at 1771.772, which is in line with the pullback support to the 2nd support at 1752.956, which is in line with the pullback support and 38.2% fibonacci retracement. Alternatively, the price may rise to the 1st resistance at 1802.402, which is in line with the 61.8% fibonacci retracement and swing high.
Areas of consideration:
- H4 time frame, 1st support at 1771.772
- H4 time frame, 2nd support at 1752.956
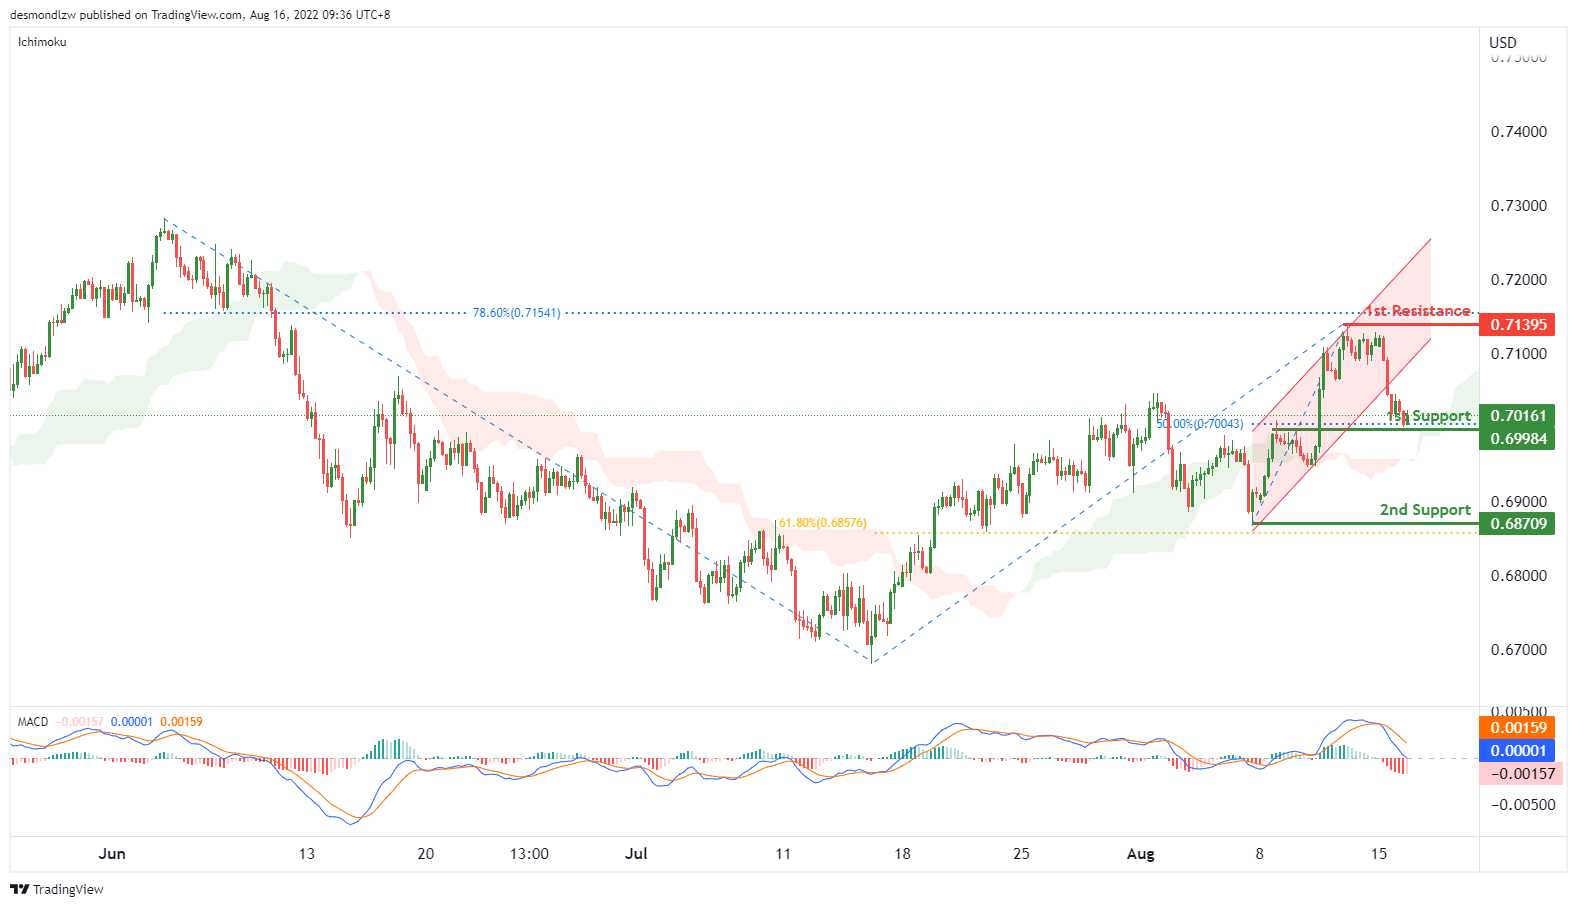
AUD/USD:
On the H4, with the price breaking the ascending channel, MACD histograms are under zero, and DIF is almost crossing the signal line, we have a bearish bias that price may drop from the 1st support at 0.69984, where the 50% fibonacci retracement and pullback support are to the 2nd support at 0.68709, which is in line with the swing low and 61.8% fibonacci retracement. Alternatively,the price may drop to the 1st resistance at 0.71395 which is in line with 78.6% fibonacci retracement and swing high.
Areas of consideration
- H4 1st support at 0.69984
- H4 2nd support at 0.68709
NZD/USD:
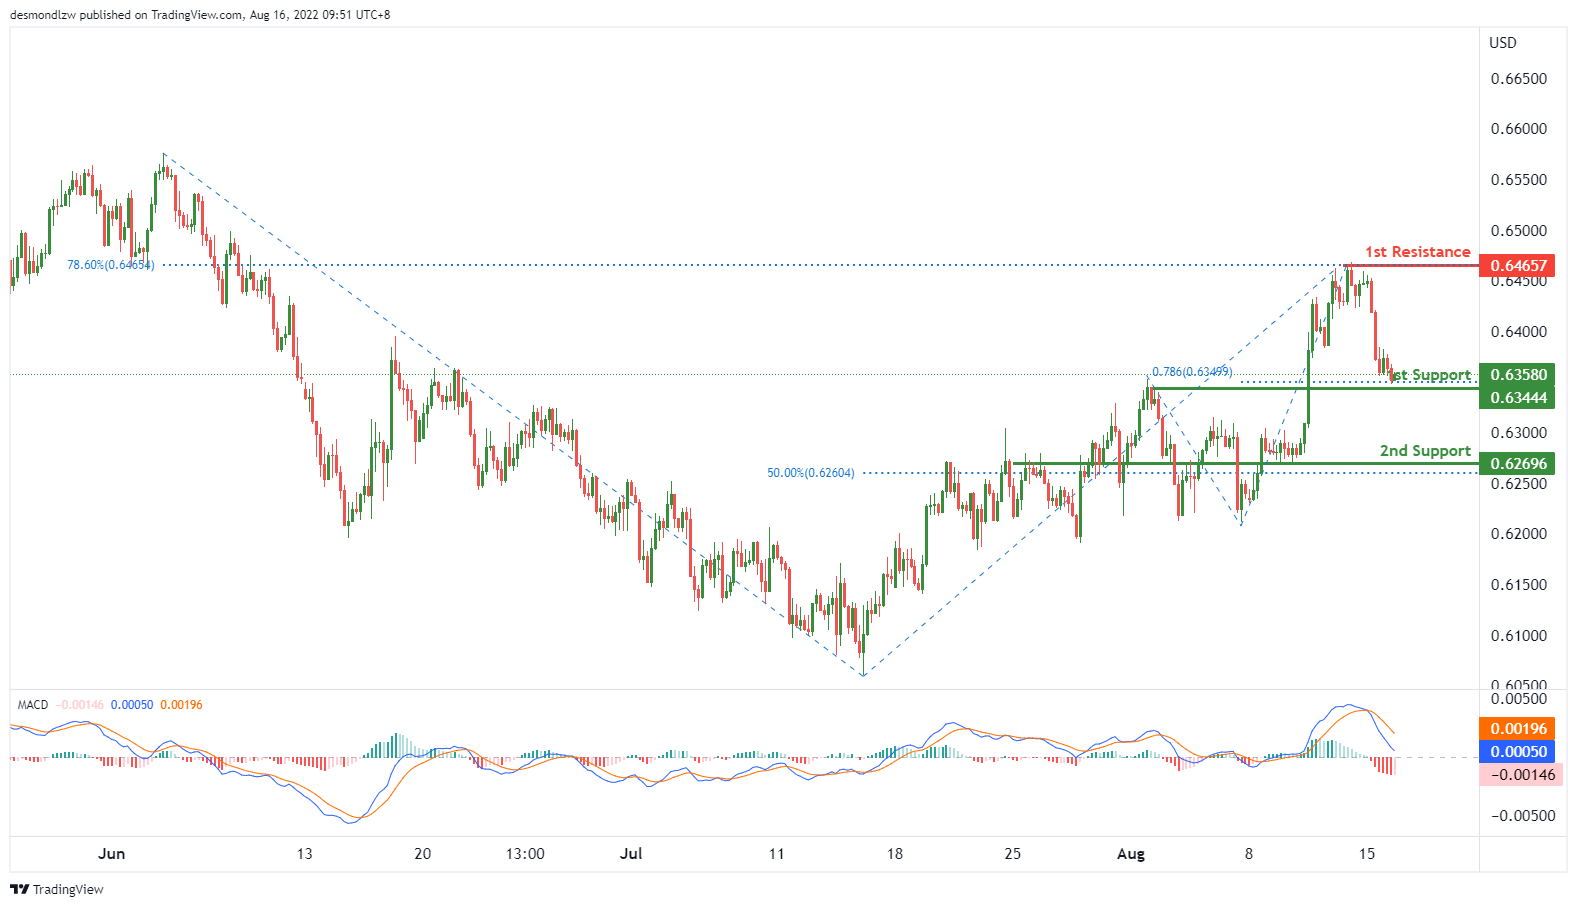
On the H4, with the MACD histograms are under zero and DIF crossing below the signal line, we have a bearish bias that the price may drop from the 1st support at 0.63444, which is in line with the 78.6% fibonacci retracement and pullback support to the 2nd support at 0.62696, which is in line with the 50% fibonacci retracement. Alternatively, the price may rise to the 1st resistance at 0.64657, which is in line with the swing high and 78.6% fibonacci retracement.
Areas of consideration:
- H4 time frame, 1st support at 0.63444
- H4 time frame, 2nd support at 0.62696
USD/CAD:
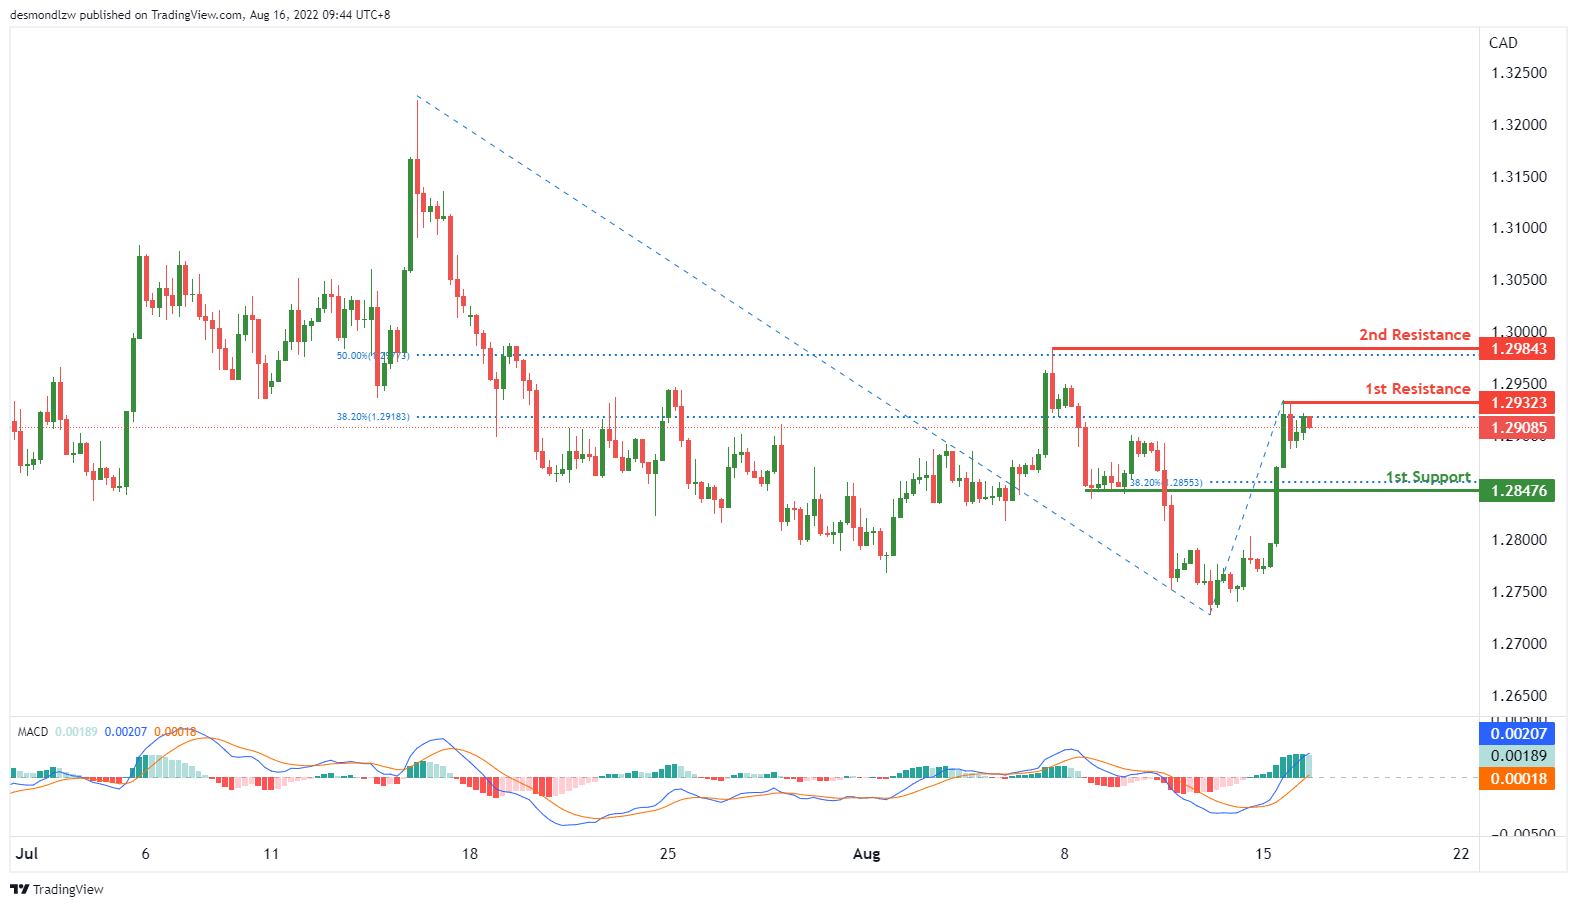
On the H4, with MACD indicators are above the zero, we have a bullish bias that the price may rise from the 1st resistance at 1.29323, which is in line with the38.2% fibonacci retracement to the 2nd resistance at 1.29843, which is in line with the 50% fibonacci retracement and swing high. Alternatively, the price may drop to the 1st support at 1.28476, which is in line with the 38.2% fibonacci retracement and overlap support.
Areas of consideration:
- H4 time frame, 1st resistance at 1.29323
- H4 time frame, 2nd resistance at 1.29843
OIL:
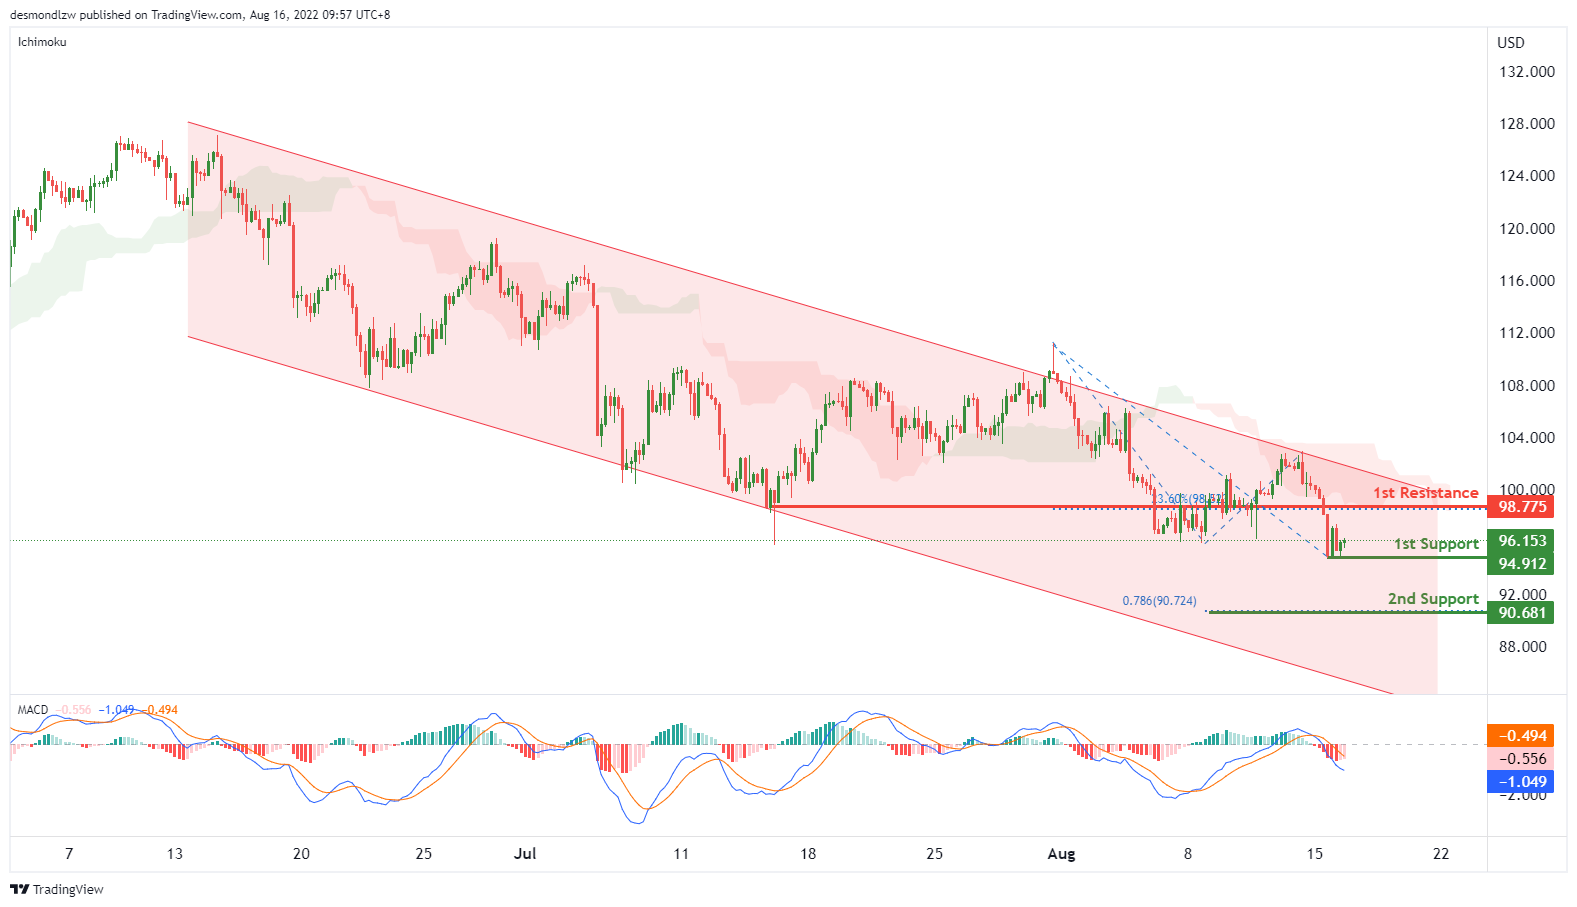
On the H4, with price moving within the descending channel, below ichimoku cloud and the DIF is crossing below signal line, we have a bearish bias that the price may drop from our 1st support at 94.91, which is in line with the swing low to the 2nd support at 90.681, which is in line with the 78.6% fibonacci projection. Otherwise, the price may rise to our 1st resistance at 98.775, which is in line with the overlap resistance and 23.6% fibonacci retracement.
Areas of consideration:
- H4 time frame, 1st support at 94.91
- H4 time frame, 2nd support at 90.681
Dow Jones Industrial Average:
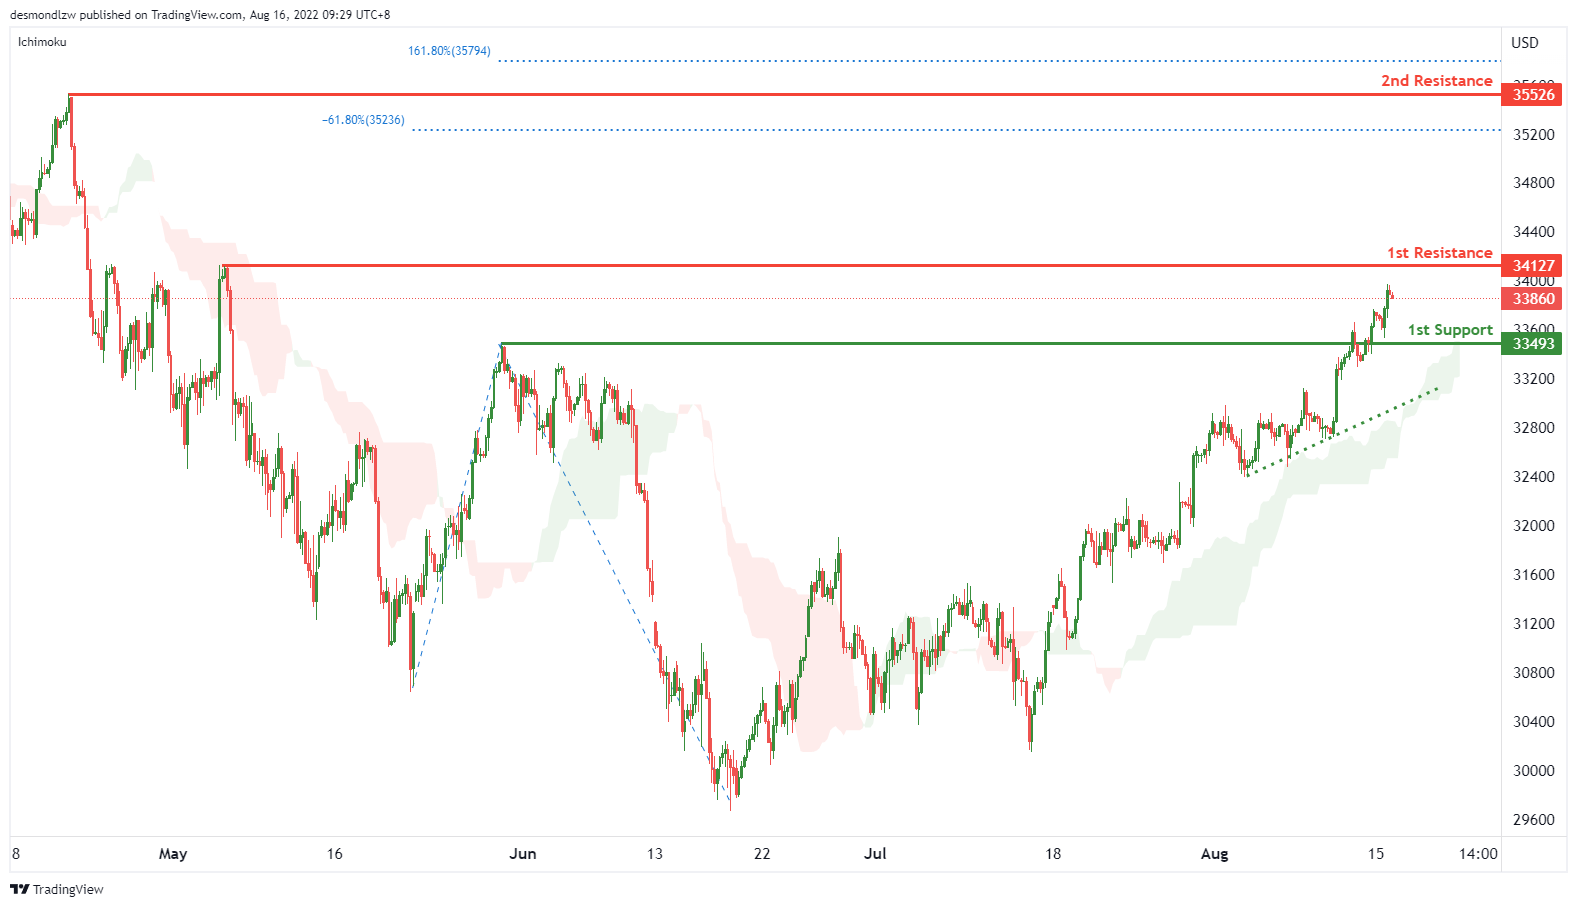
On the H4, with price moving above the ichimoku indicator and along an ascending trendline, we have a bullish bias that price will rise to our 1st resistance at 34127 where the swing high resistance is. Once there is upside confirmation that price has broken 1st resistance structure, we would expect bullish momentum to carry price to 2nd resistance at 35526 where the swing high resistance, 161.8% fibonacci extension and -61.8% fibonacci expansion are. Alternatively, price could drop to 1st support at 33493 where the pullback support is.
Areas of consideration:
- H4 time frame, 1st resistance of 34127
- H4 time frame, 1st support at 33493
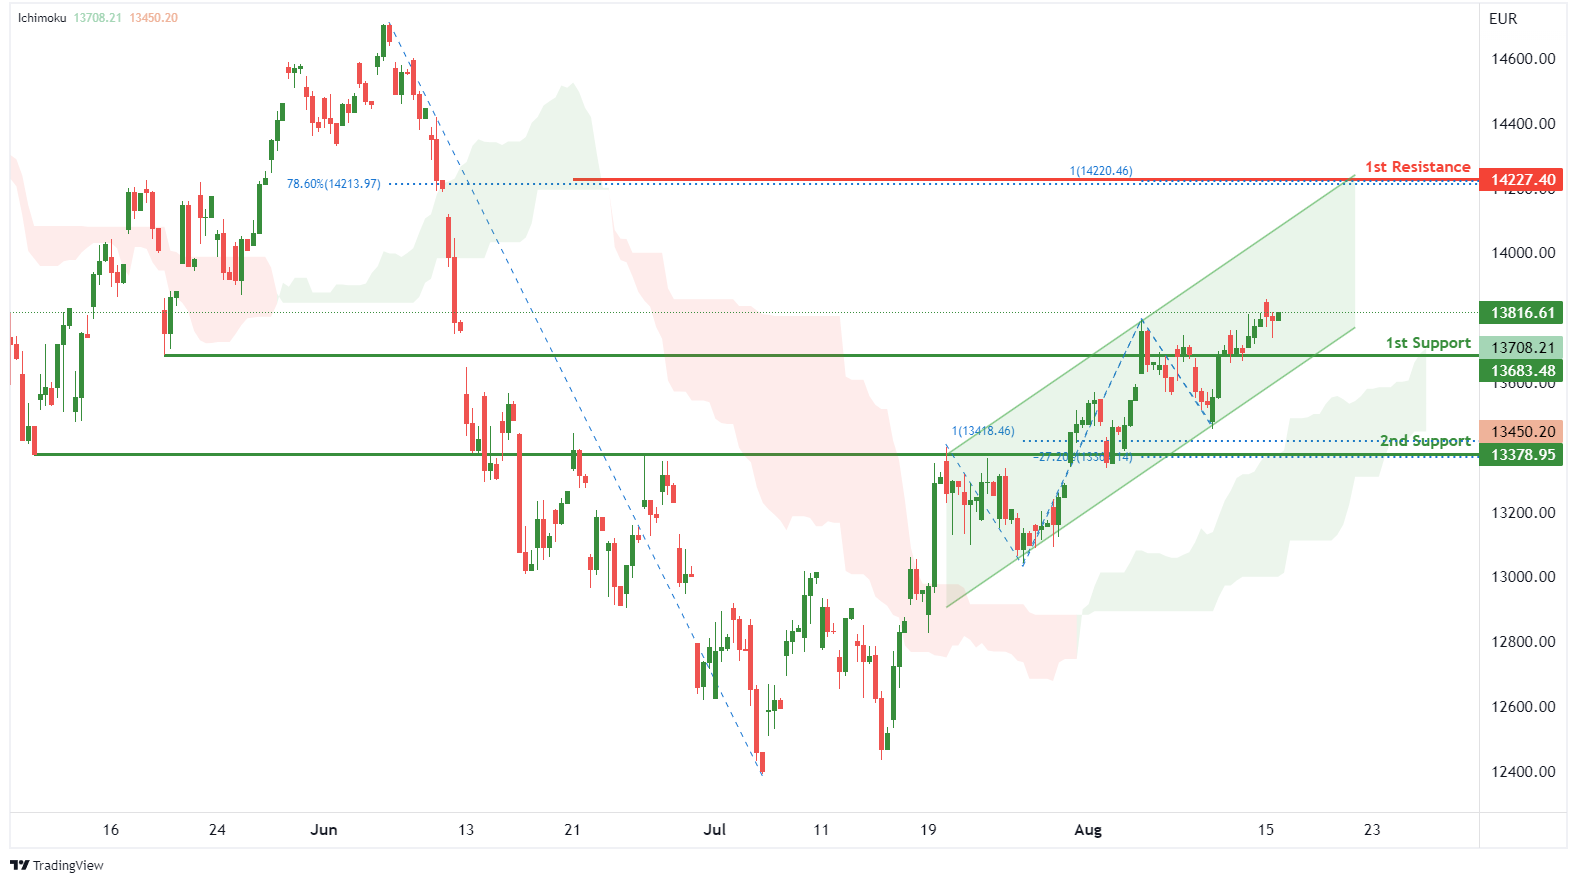
DAX:
On the H4, with price moving above the ichimoku indicator and within the ascending channel, we have a bullish bias that price will rise from 1st support at 13683.48 where the pullback support is to the 1st resistance at 14227.40 in line with 100% fibonacci projection and 78.6% fibonacci retracement. Alternatively, price could break 1st support and drop to 2nd support at 13378.95 where the overlap support, -27.2% fibonacci expansion and 100% fibonacci projection are.
Areas of consideration:
- H4 time frame, 1st resistance of 14227.40
- H4 time frame, 1st support at 13683.48
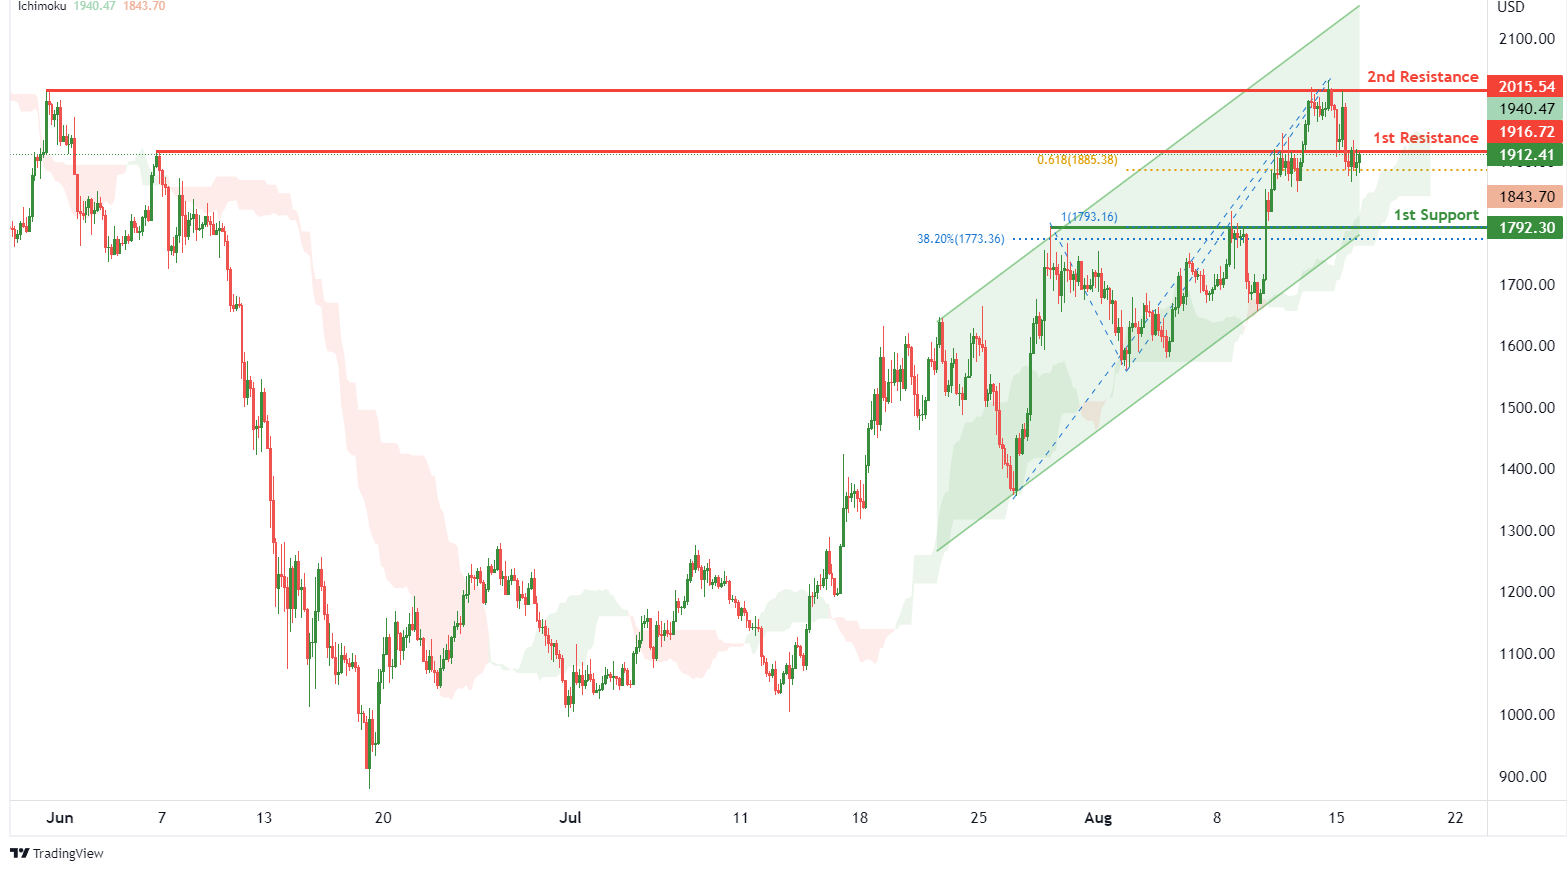
ETHUSD:
On the H4, with price moving within an ascending channel and above the ichimoku indicator, we have a bullish bias that price will rise to the 1st resistance at 1916.72 where the pullback support and 61.8% fibonacci projection are. Once there is upside confirmation that price has broken 1st resistance structure, we would expect bullish momentum to carry price to 2nd resistance at 2015.54 where the swing high resistance is. Alternatively, price could drop to 1st support at 1792.30 where the overlap support, 38.2% fibonacci retracement and 100% fibonacci projection are.
Areas of consideration:
- H4 time frame, 1st resistance of 1916.72
- H4 time frame, 1st support at 1792.30
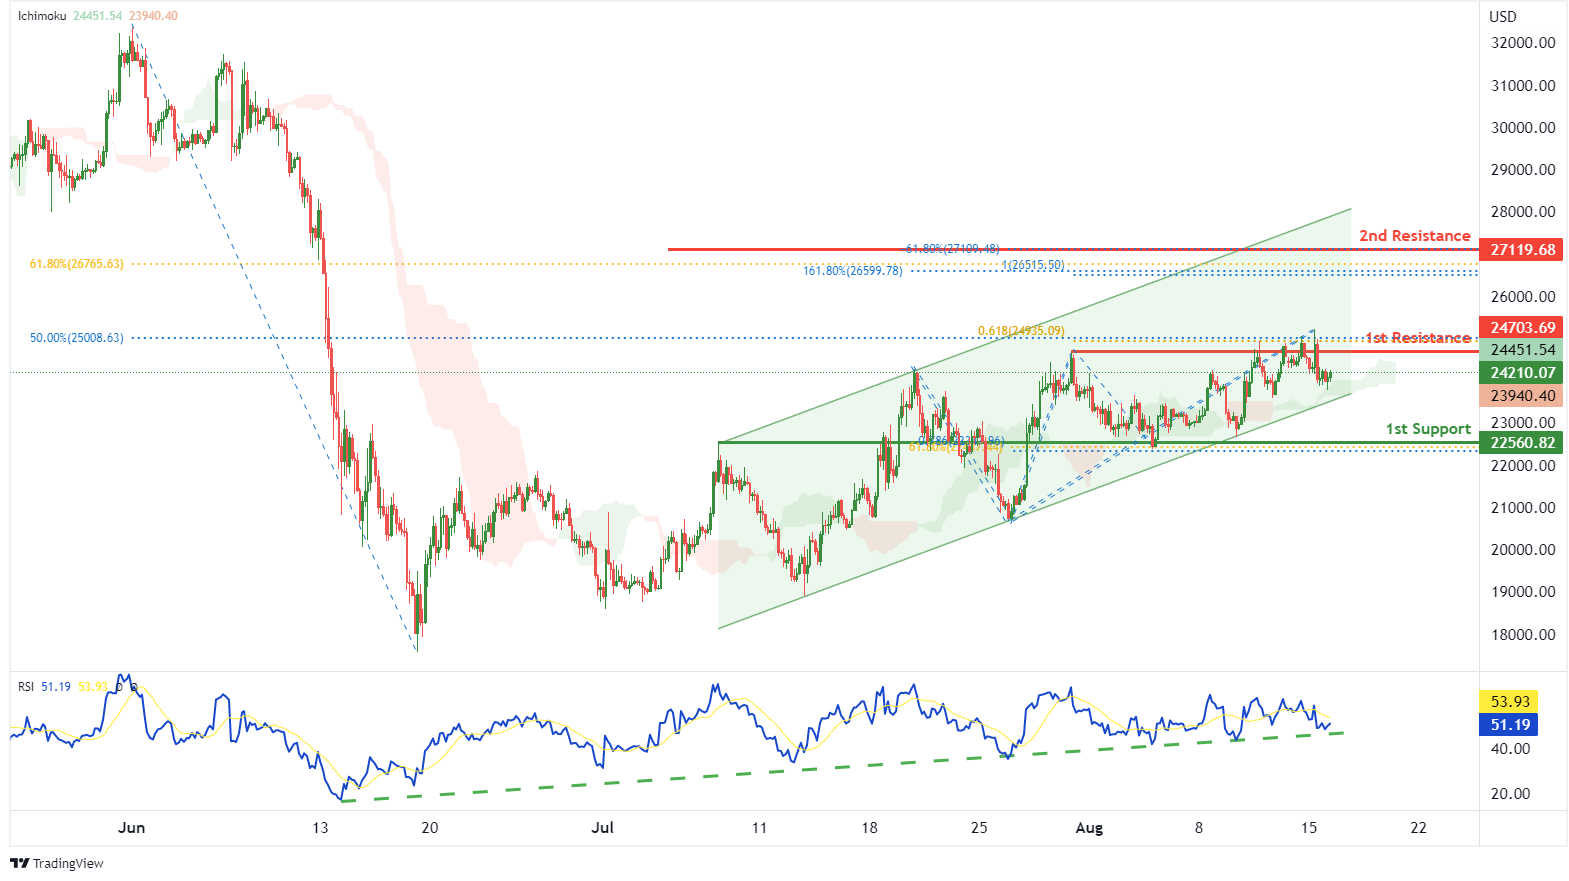
BTCUSD:
On the H4, with price moving within a bullish channel as well as above the ichimoku indicator and RSI moving along an ascending trendline, we have a bullish bias that price will rise to our 1st resistance at 24703.69 where the pullback resistance, 50% fibonacci retracement and 61.8% fibonacci projection are. Once there is upside confirmation that price has broken 1st resistance structure, we would expect bullish momentum to carry price to 2nd resistance at 27119.68 where the 61.8% fibonacci retracement, -61.8% fibonacci expansion, 161.8% fibonacci extension and 100% fibonacci projection are. Alternatively, price could drop to 1st support at 22560.82 where the pullback support, 61.8% fibonacci retracement and 78.6% fibonacci projection are.
Areas of consideration:
- H4 time frame, 1st resistance of 24703.69
- H4 time frame, 1st support at 22560.82
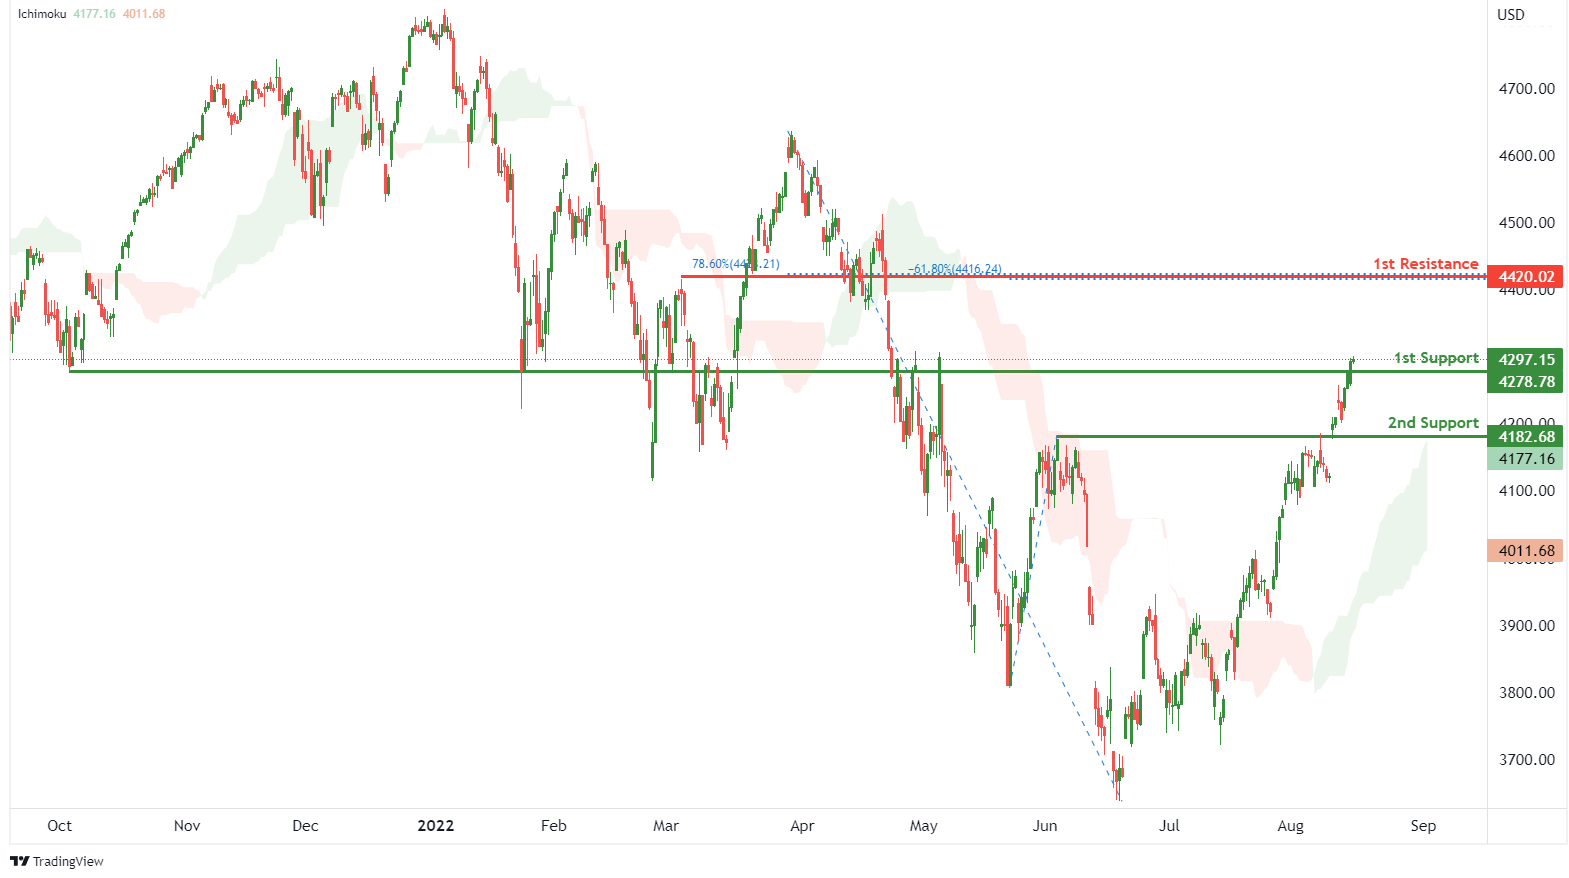
S&P 500:
On the H4, with prices moving above the ichimoku indicator, we have a bullish bias that price will rise from 1st support at 4278.78 where the overlap support is to the 1st resistance at 4420.02 where the pullback resistance, 78.6% fibonacci retracement and -61.8% fibonacci expansion are. Alternatively, price could break 1st support structure and drop to 2nd support at 4182.68 where the pullback support is.
Areas of consideration:
- H4 time frame, 1st resistance of 4420.02
- H4 time frame, 1st support at 4278.78
The accuracy, completeness and timeliness of the information contained on this site cannot be guaranteed. IC Markets does not warranty, guarantee or make any representations, or assume any liability regarding financial results based on the use of the information in the site.
News, views, opinions, recommendations and other information obtained from sources outside of www.icmarkets.com.au, used in this site are believed to be reliable, but we cannot guarantee their accuracy or completeness. All such information is subject to change at any time without notice. IC Markets assumes no responsibility for the content of any linked site.
The fact that such links may exist does not indicate approval or endorsement of any material contained on any linked site. IC Markets is not liable for any harm caused by the transmission, through accessing the services or information on this site, of a computer virus, or other computer code or programming device that might be used to access, delete, damage, disable, disrupt or otherwise impede in any manner, the operation of the site or of any user’s software, hardware, data or property.