
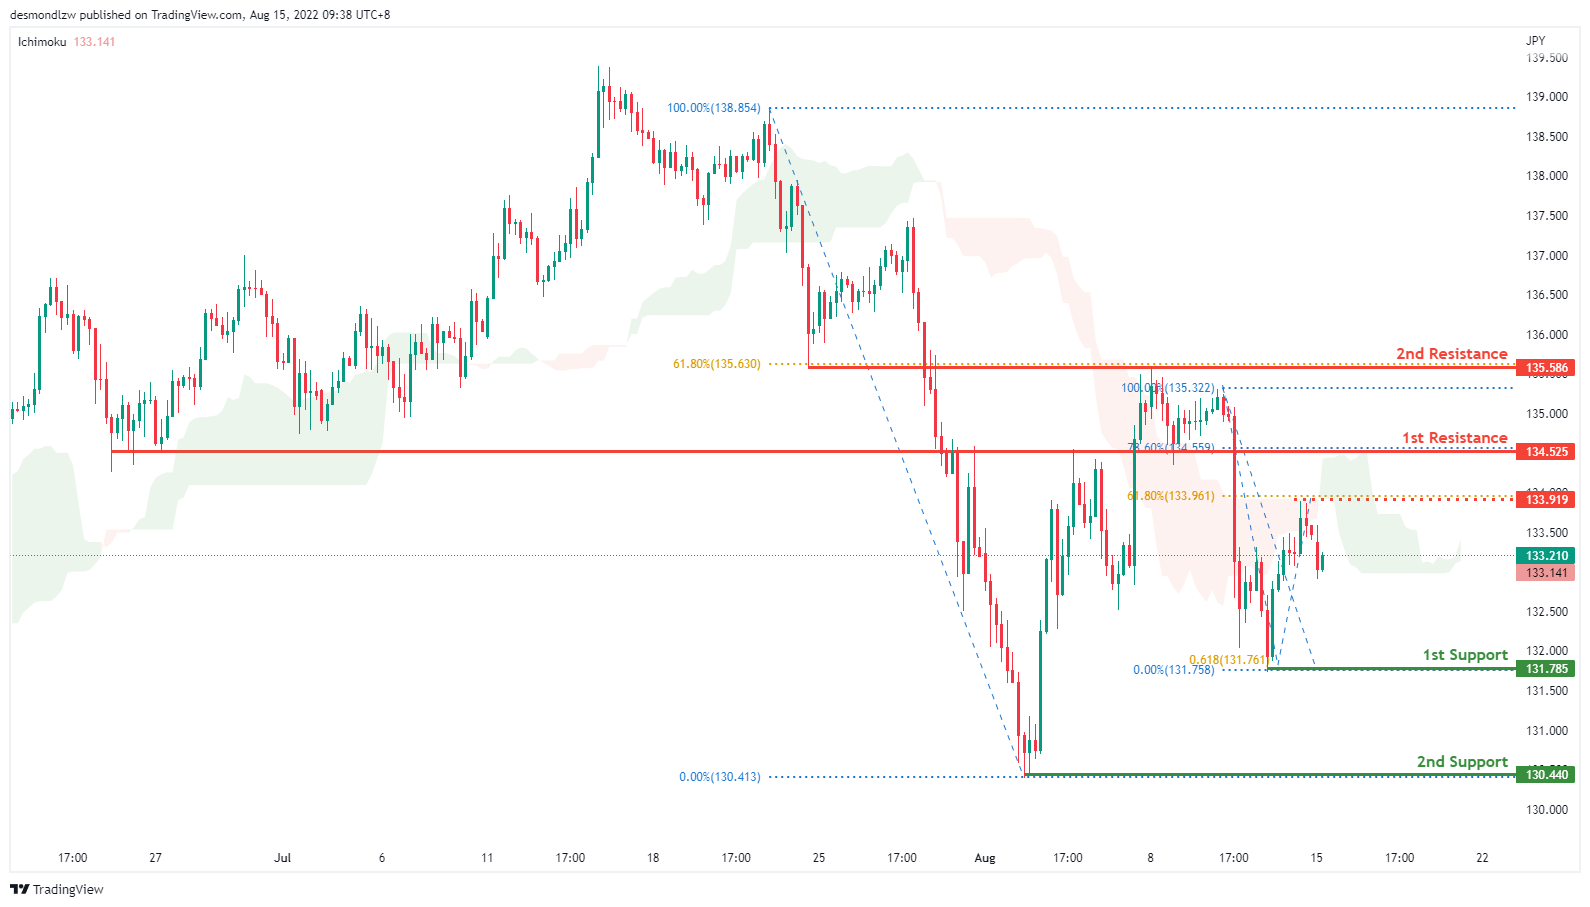
USD/JPY:
On the H4, prices are still respecting the descending trend and are testing the 61.8% fibonacci retracement. If prices continue with the bearish momentum, we are looking at price pulling back to test at the first support 131.785 where the fibonacci projection as well as the previous swing low sits, subsequently testing the second support at 130.440. Alternatively if prices fail to continue with the bearish trend, we are expecting prices to test at the intermediate resistance 133.919. If it breaks that resistance and confirms bullish momentum, prices will test at first resistance 134.525 where the 78.6% fibonacci retracement sits.
Areas of consideration:
- H4 time frame, 1st resistance at 134.525
- H4 time frame, 1st support at 131.785
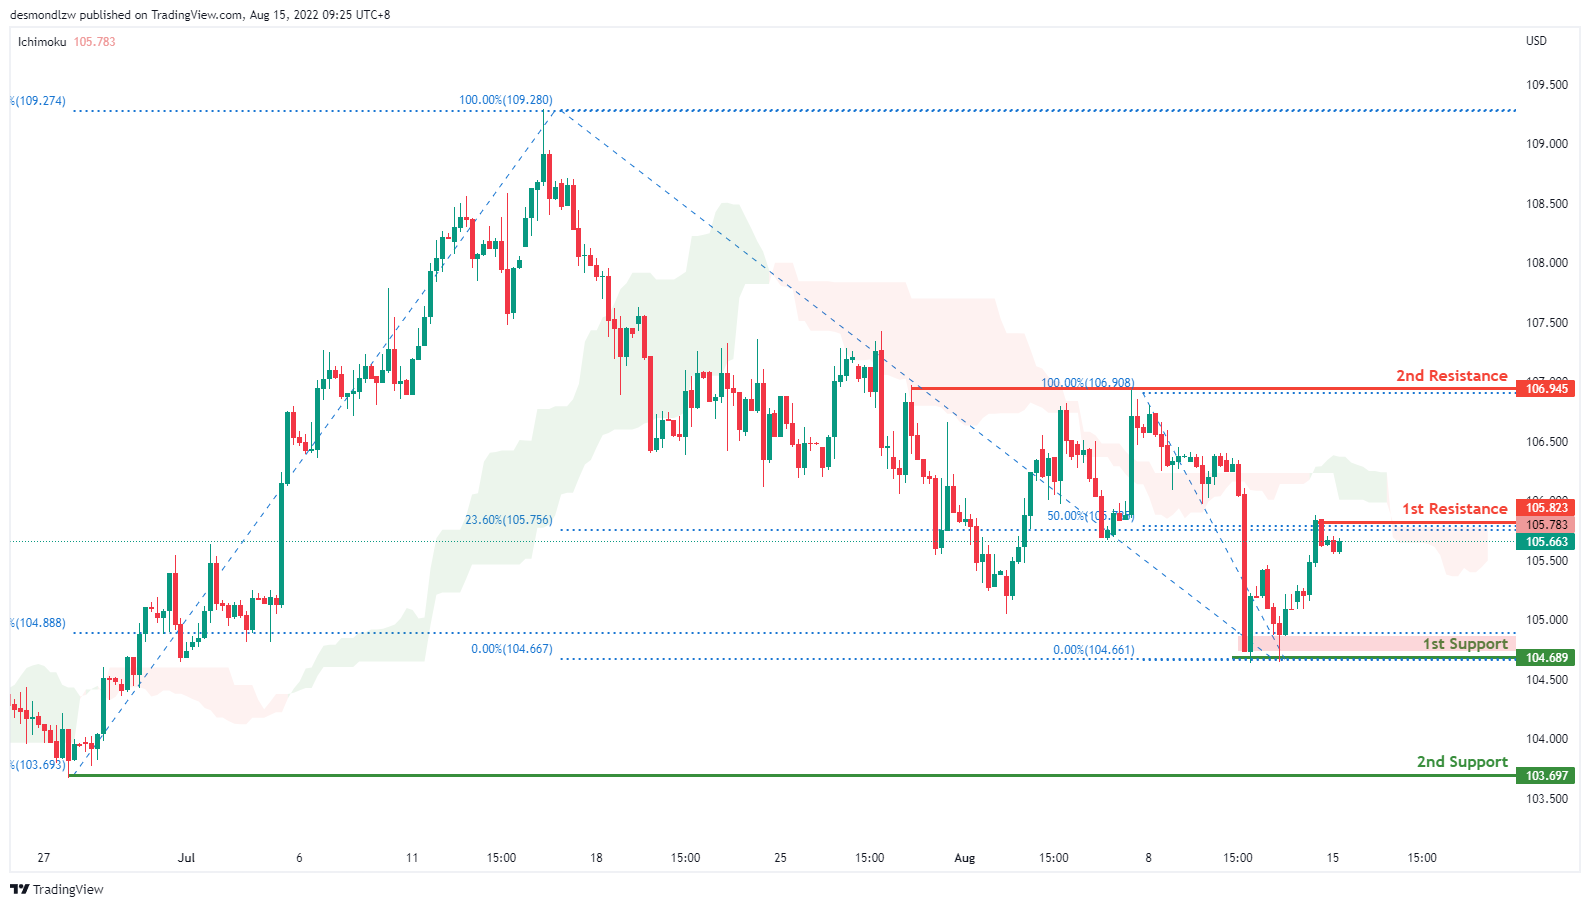
DXY:
On the H4, price is moving in a descending trend and has confirmed a bearish momentum. It is now testing around the 105.823 level where the 50% fibonacci retracement sits. If price continues the bearish momentum, it will bring price down to 104.689 where the first support and 78.6% fibonacci sits. Alternatively, prices might pull back to test the first resistance at 106.945
Areas of consideration:
- H4 time frame, 1st resistance at 106.945
- H4 time frame, 1st support at 104.689
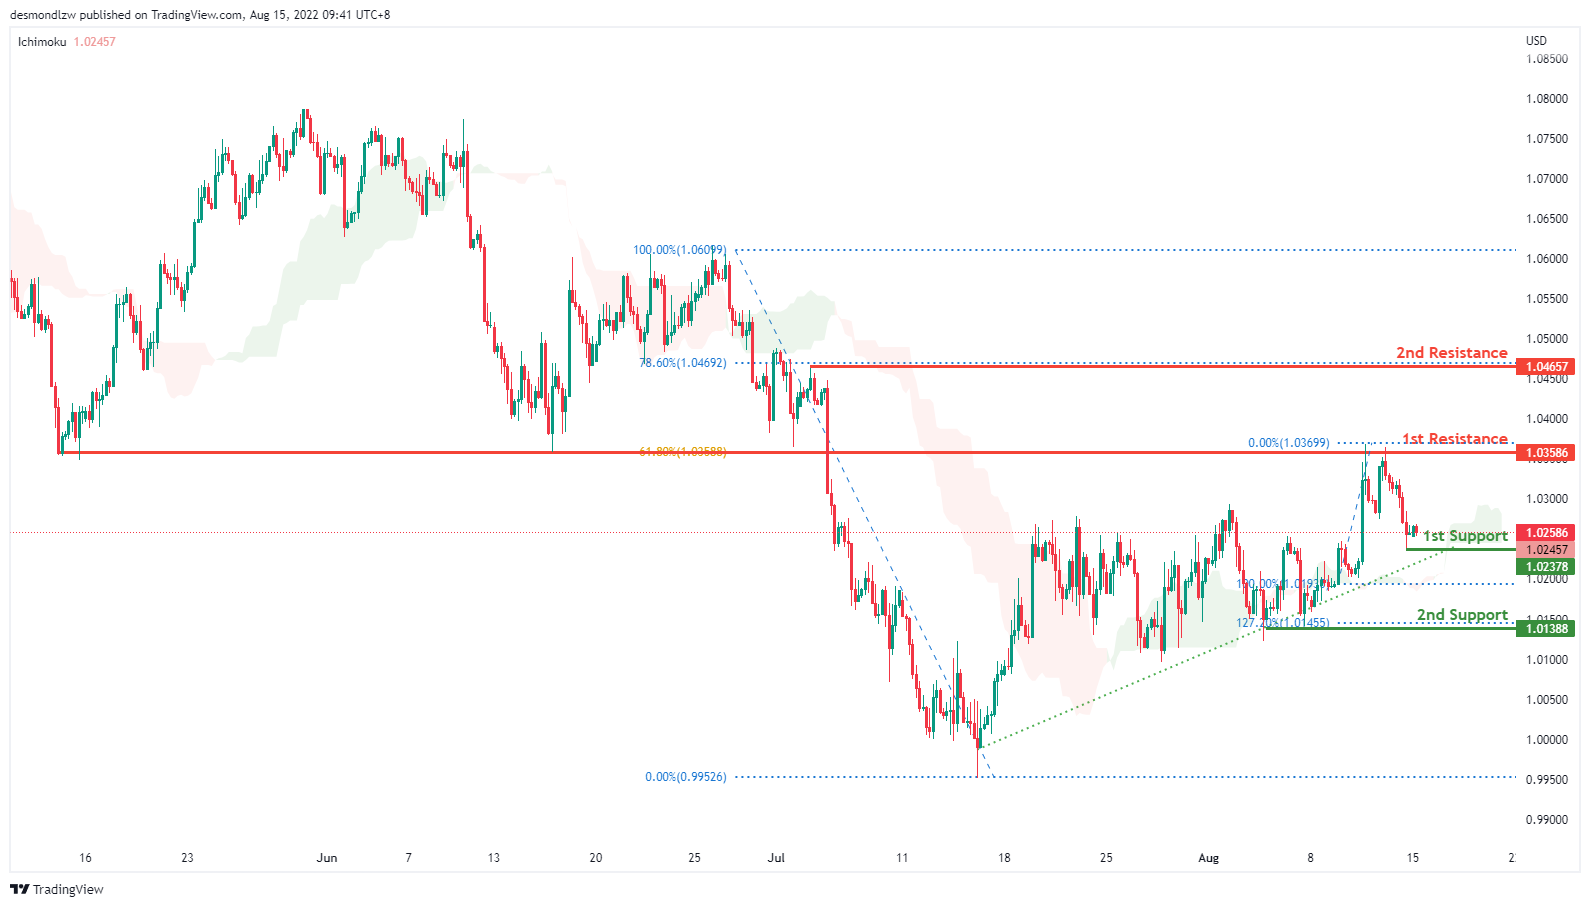
EUR/USD :
On the H4, with prices moving along the ascending trend and above the ichimoku indicator, we are bullish bias. Prices have tested the first resistance at 1.03583 where the 61.8% fibonacci retracement sits and is pulling back slightly. If prices fails to break the first resistance, it will pull back further to test at the first support 1.020 where the previous swing low sits and subsequently the second support at 1.012 level
Areas of consideration :
- H4 1st resistance at 1.035
- H4 1st support at 1.020
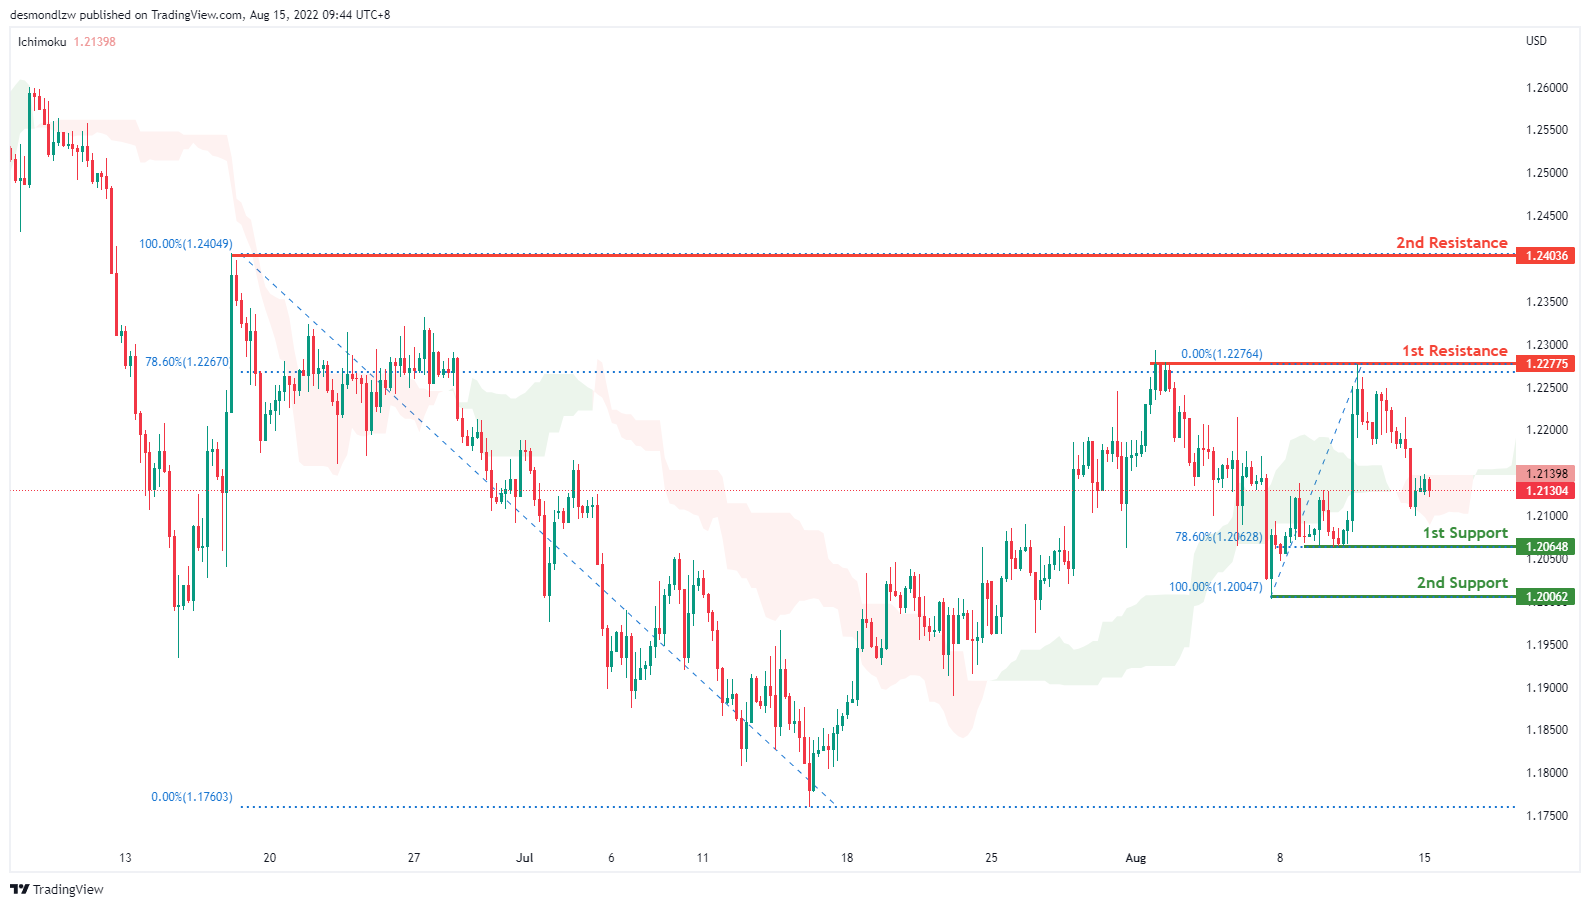
GBP/USD:
On the H4, with price moving within an ascending trend and above the ichimoku indicator, we have a bullish bias that price will rise to test the first resistance at 1.227 where the 78.6% fibonacci retracement sits and subsequently the second resistance at 1.240. If prices fail to break the first resistance, we can confirm a bearish momentum where prices will pull back and test the first support at 1.206 where the 78.6% fibonacci retracement sits
Areas of consideration:
- H4 1st resistance at 1.227
- H4 1st support at 1.206
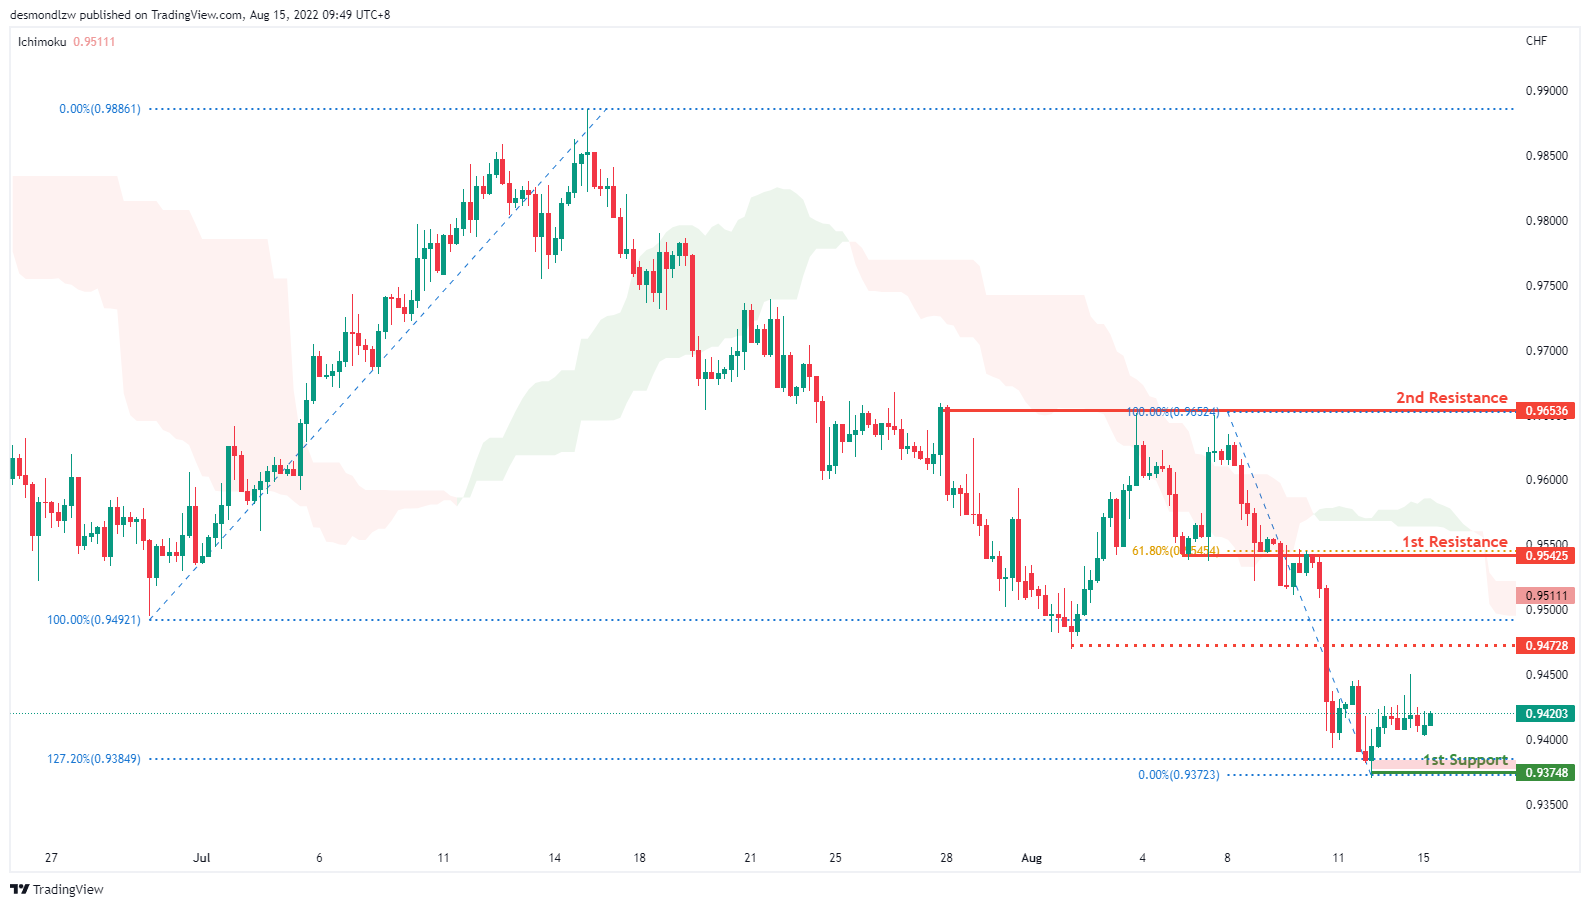
USD/CHF:
On the H4, with prices moving below the ichimoku cloud and the MACD indicators are below zero, we have a bearish bias that the price will continue with the bearish momentum and pull back to test at the first support 0.937. If prices fail to break first support, it may pull back to test the first resistance at 0.954 where the 61.8% fibonacci retracement and previous swing low sits. If prices continues with bullish momentum, it will then pull back further to test at the second resistance 0.965
Areas of consideration
- H4 1st support at 0.937
- H4 1st resistance at 0.954
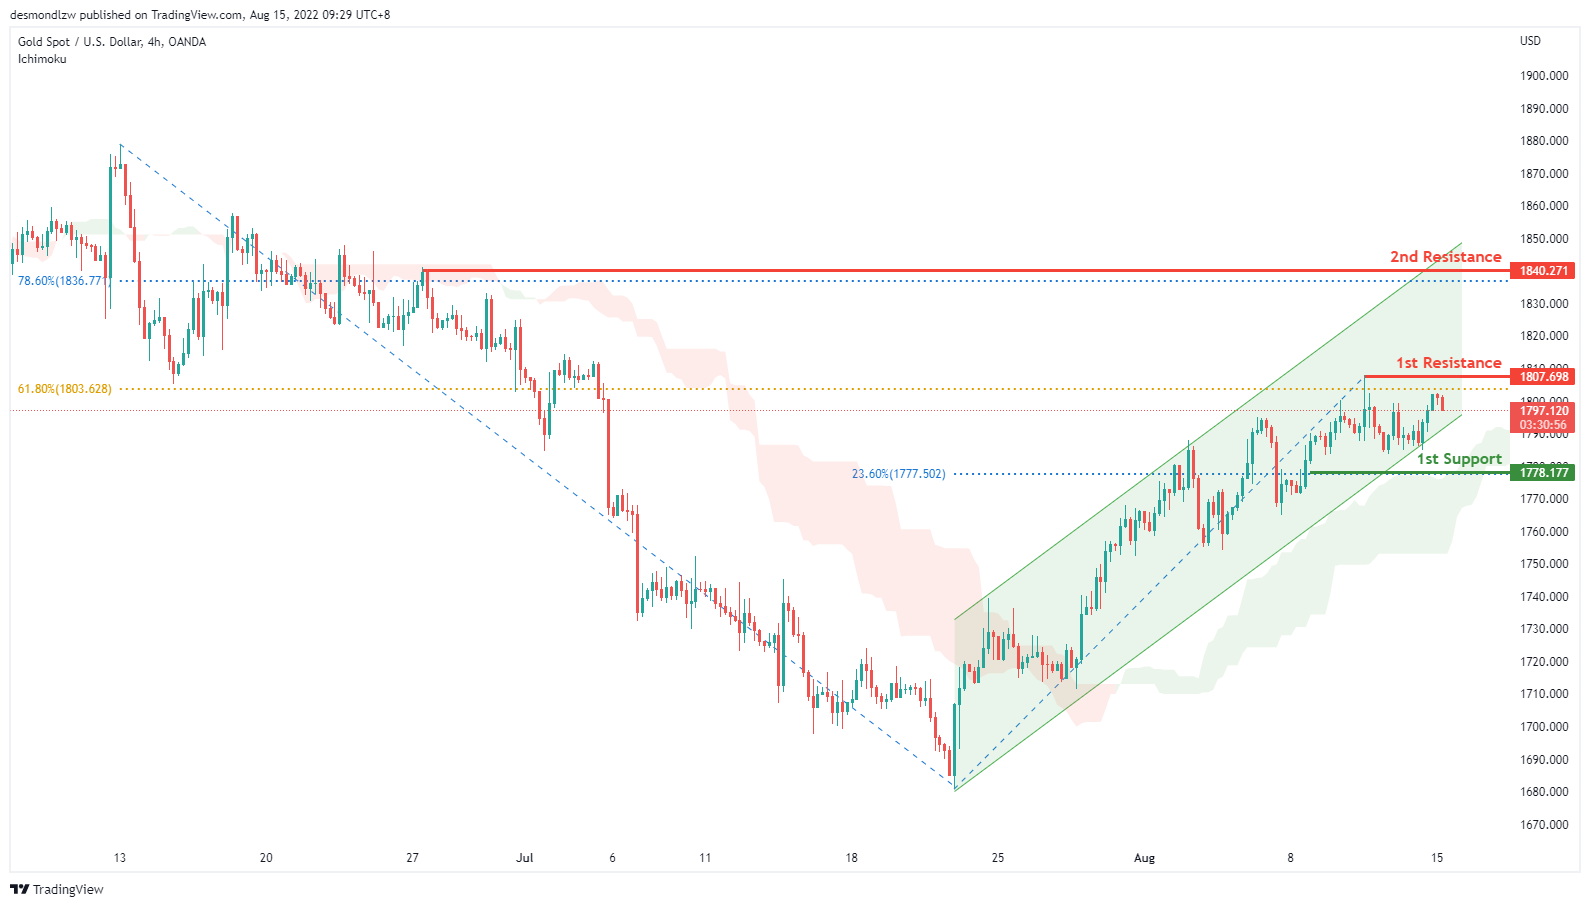
XAU/USD (GOLD):
On the H4, with prices going along the ascending channel and moving above the ichimoku cloud, we have a bullish bias that the price may rise from the 1st resistance at 1807.698, which is in line with the swing high and 61.8% fibonacci retracement to the 2nd resistance at 1840.271, which is in line with the 78.6% fibonacci retracement. Alternatively, the price may drop to the 1st support at 1778.177, which is in line with the 23.6% fibonacci retracement.
Areas of consideration:
- H4 time frame, 1st resistance at 1807.698
- H4 time frame, 2nd resistance at 1840.271
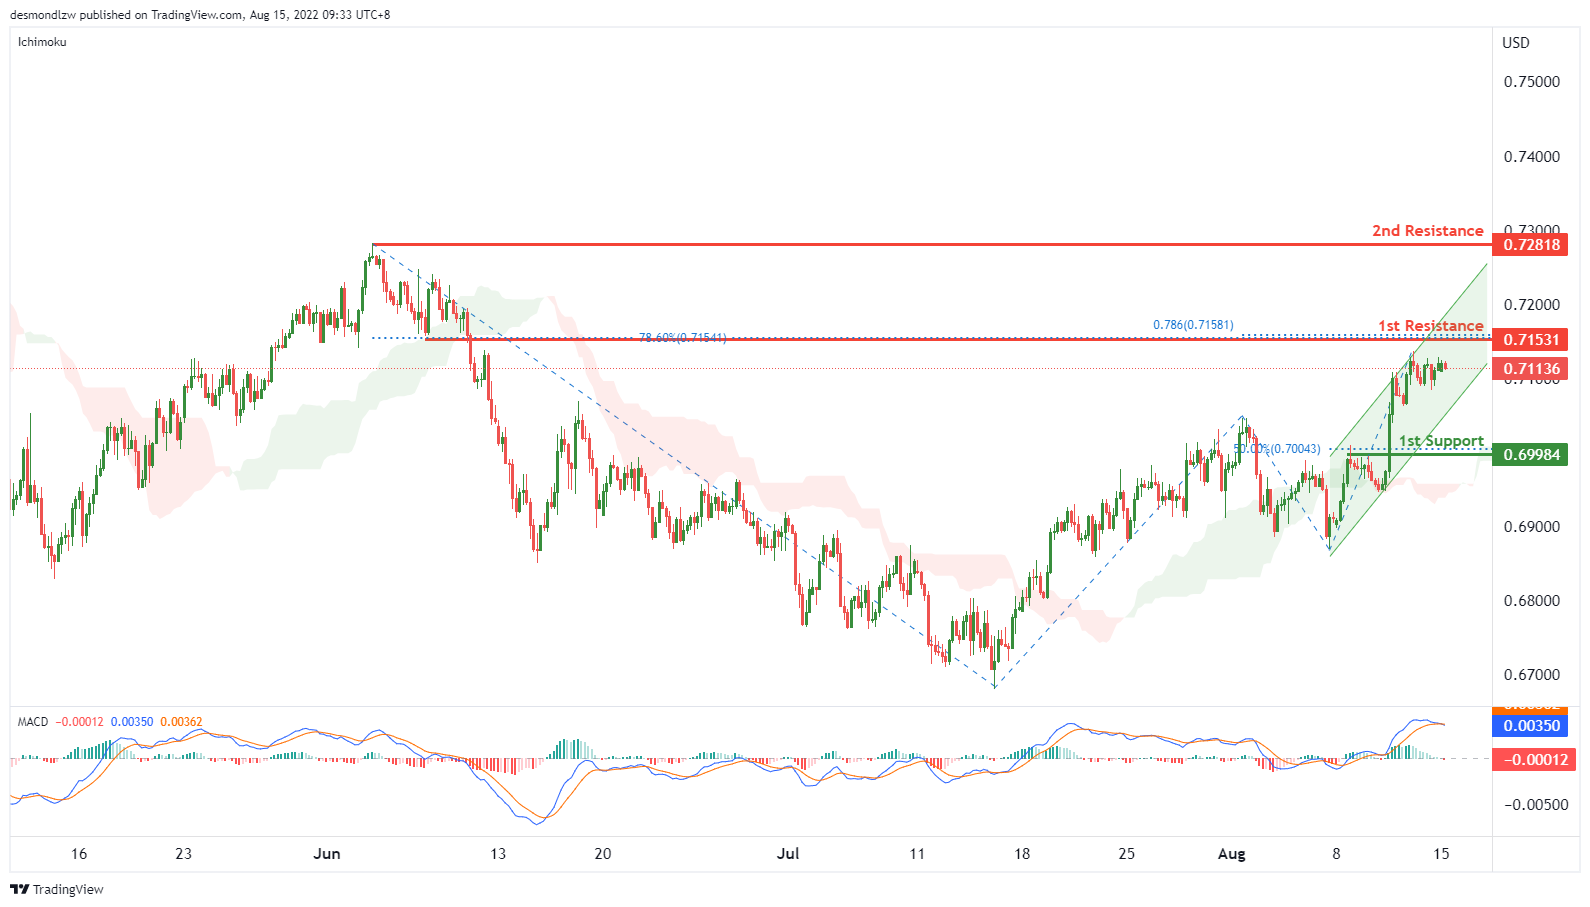
AUD/USD:
On the H4, with the price is moving within the ascending channel and over ichimoku cloud, we have a bullish bias that price may rise from the 1st resistance at 0.71531, where the 78.6% fibonacci projection, 78.6% fibonacci retracement and swing low are pullback support and 23.6% fibonacci retracement are to the 2nd resistance at 0.72818, which is in line with the swing high. Alternatively,as the MACD histograms are under zero, and DIF is almost crossing the signal line, price may drop to the 1st support at 0.69984 which is in line with 50% fibonacci retracement and pullback support.
Areas of consideration
- H4 1st resistance at 0.71531
- H4 2nd resistance at 0.72818
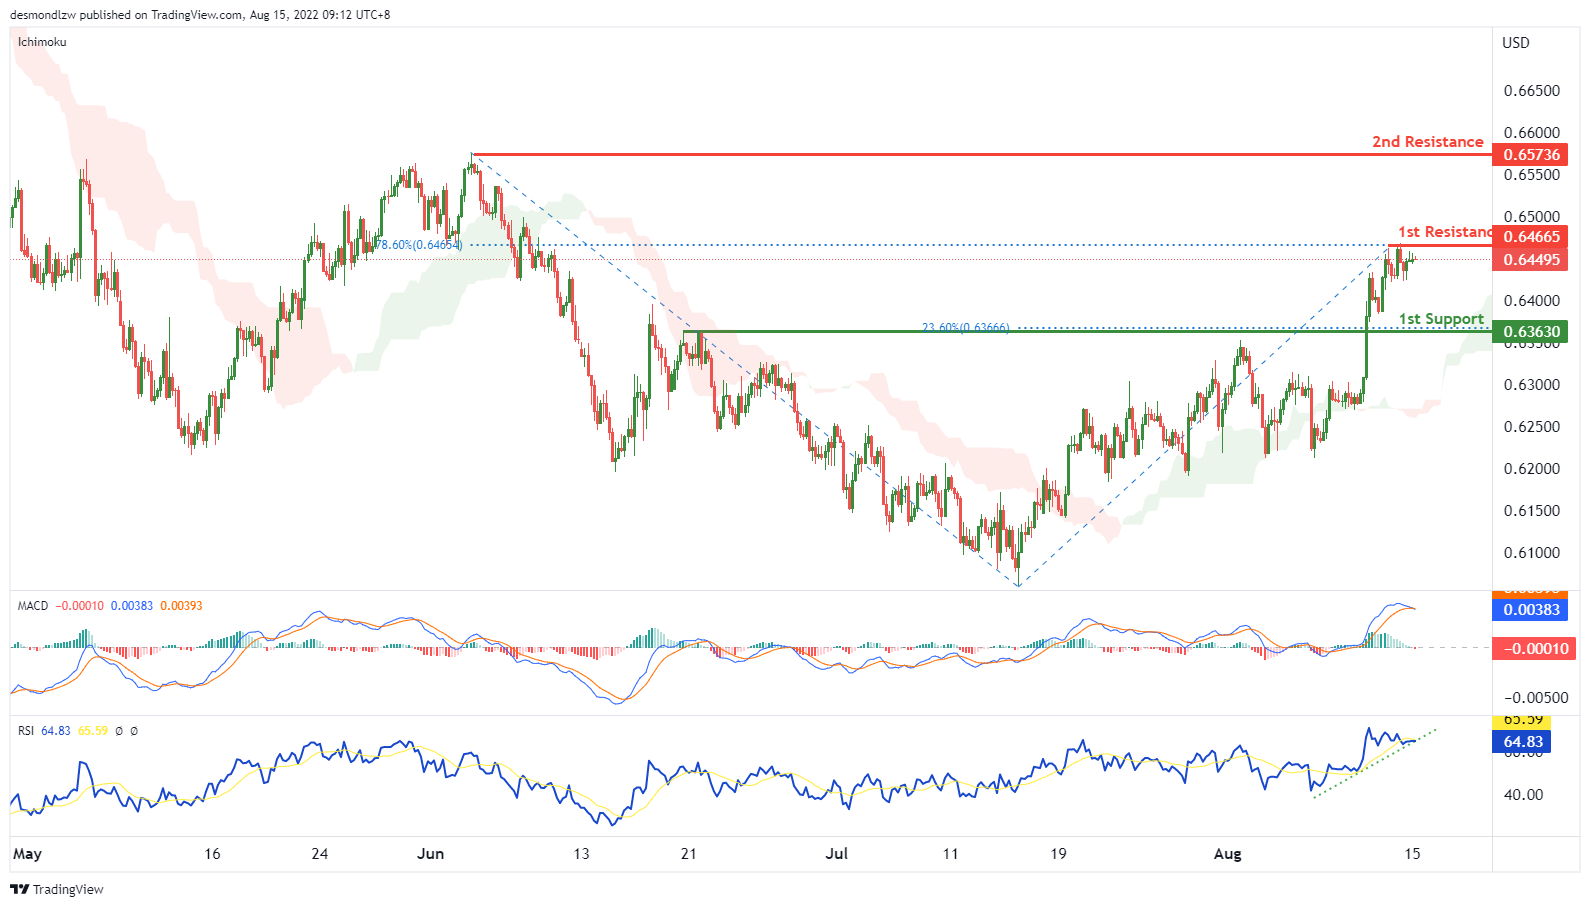
NZD/USD:
On the H4, with the price is over ichimoku cloud and RSI is moving along the ascending trendline, we have a bullish bias that price may rise from the 1st resistance at 0.64665, where the swing high and 78.6% fibonacci retracement are to the 2nd resistance at 0.65736 where the swing high is. Alternatively, as the MACD histograms are under zero, and DIF is almost crossing the signal line, the price may drop to the 1st support at 0.63630 which is in line with 23.6% fibonacci retracement and overlap support.
Areas of consideration:
- H4 time frame, 1st resistance at 0.64665
- H4 time frame, 2nd resistance at 0.65736
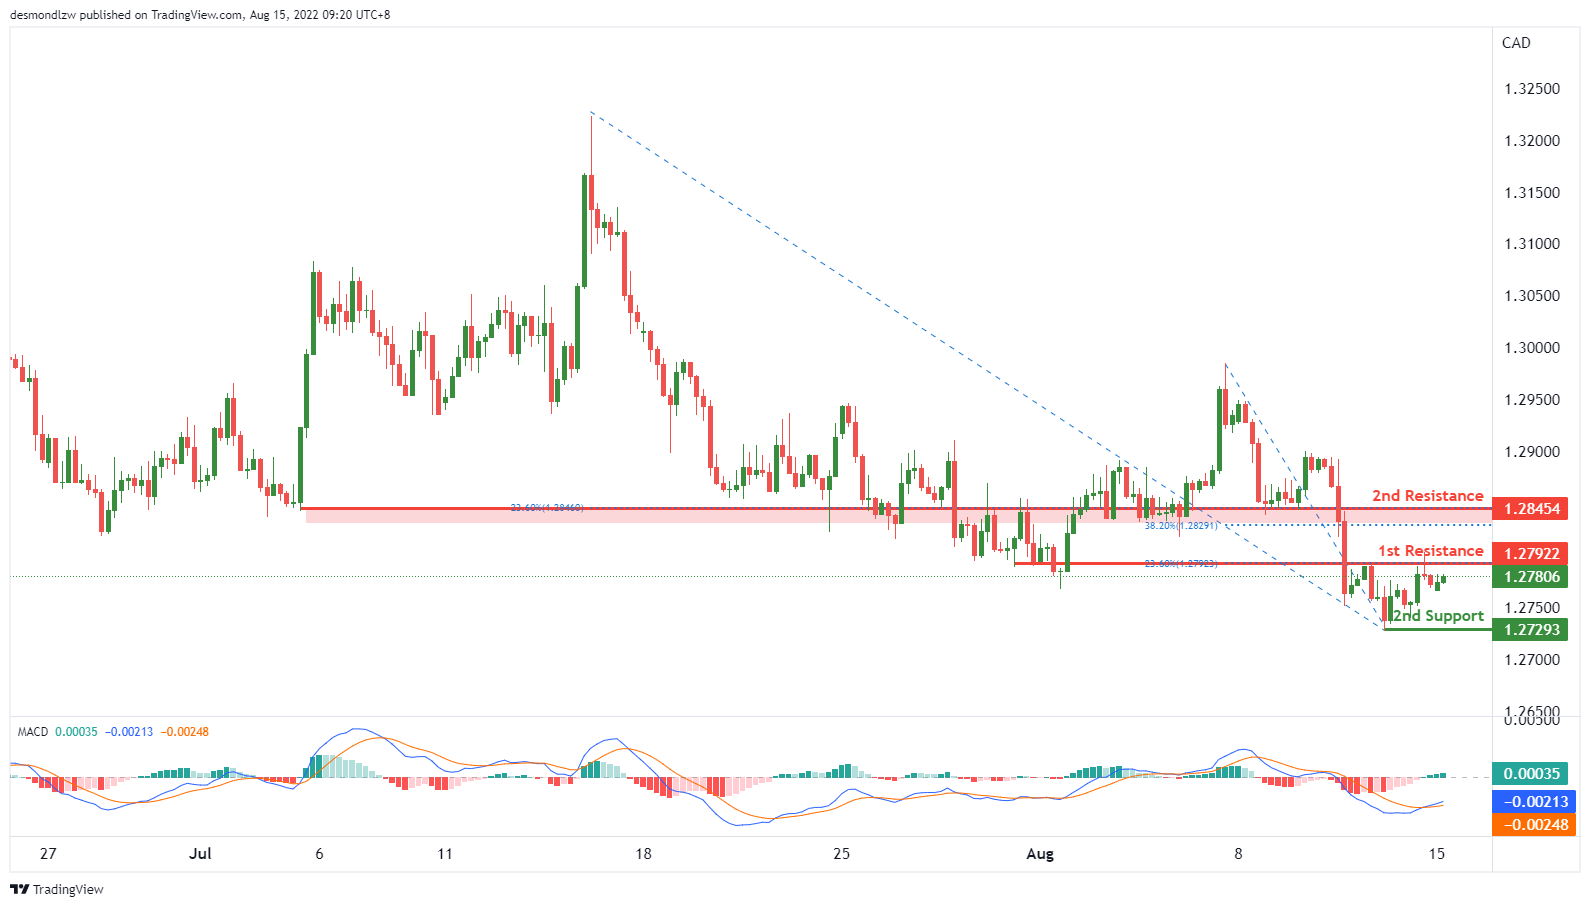
USD/CAD:
On the H4, in MACD, the DIF is crossing above the signal line, and histograms are above the zero, we have a bullish bias that the price may rise from the 1st resistance at 1.27922, which is in line with the 23.6% fibonacci retracement and overlap resistance to the 2nd resistance at 1.28454, which is in line with the 23.6% fibonacci retracement, 38.2% fibonacci retracement and overlap support. Alternatively, the price may drop to the 1st support at 1.27293, which is in line with the swing low.
Areas of consideration:
- H4 time frame, 1st resistance at 1.27922
- H4 time frame, 2nd resistance at 1.28454
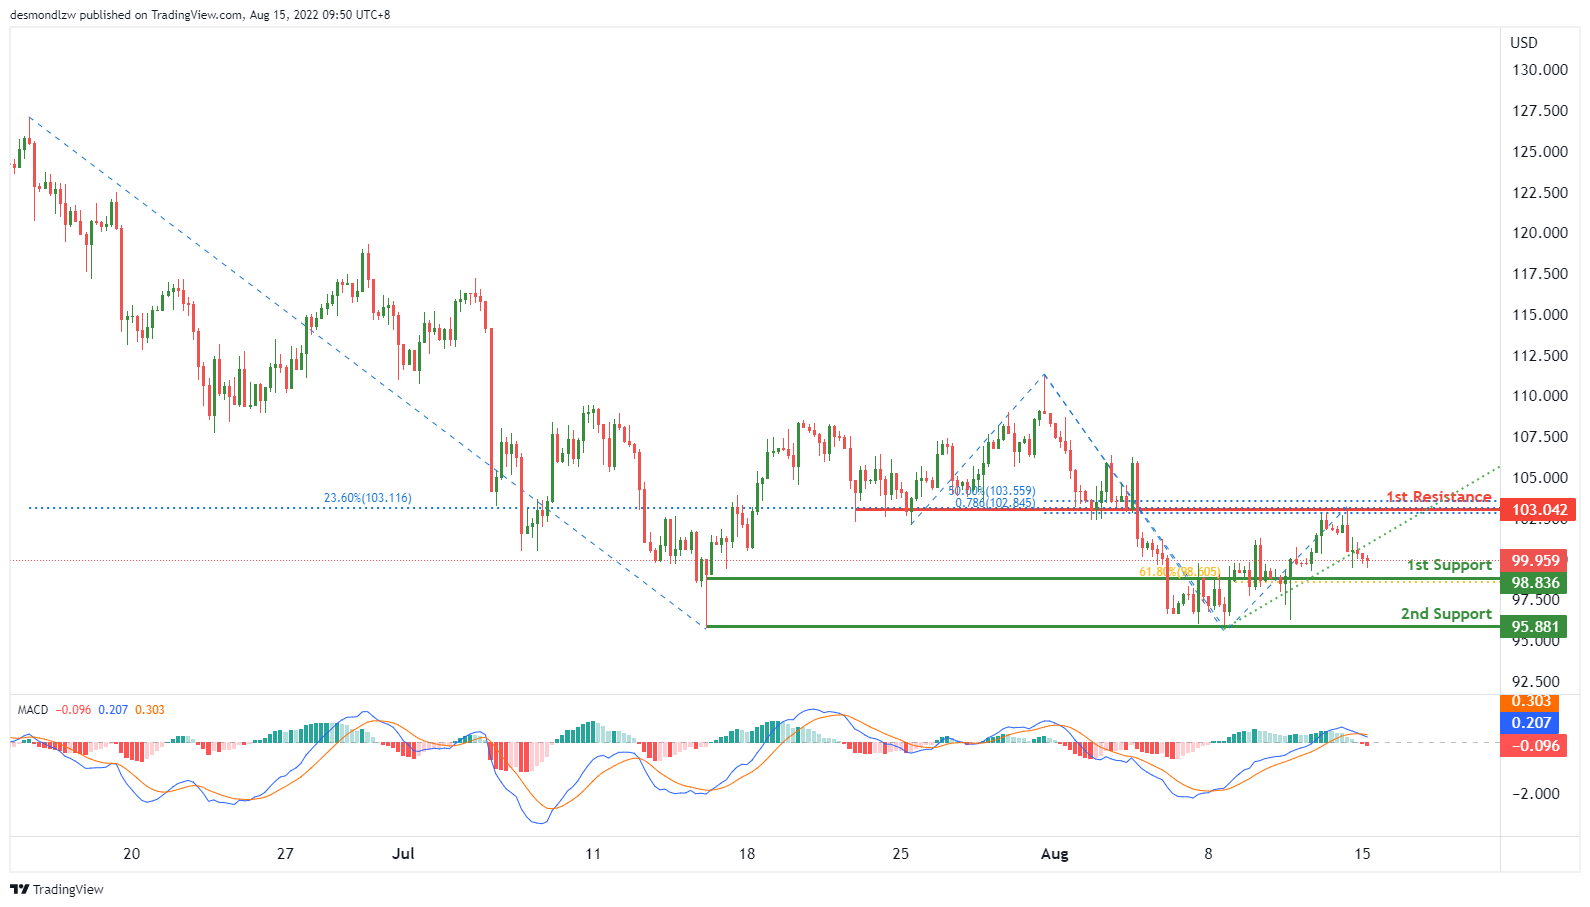
OIL:
On the H4, with price breaking the ascending trendline and the DIF is crossing below signal line, we have a bearish bias that the price may drop from our 1st support at 98.836, which is in line with the 61.8% fibonacci retracement to the 2nd support at 95.881, which is in line with the swing low support. Otherwise, the price may rise to our 1st resistance at 103.042, which is in line with the overlap support, 50% fibonacci retracement, 23.6% fibonacci retracement and 78.6% fibonacci projection.
Areas of consideration:
- H4 time frame, 1st resistance at 103.213
- H4 time frame, 2nd resistance at 111.768
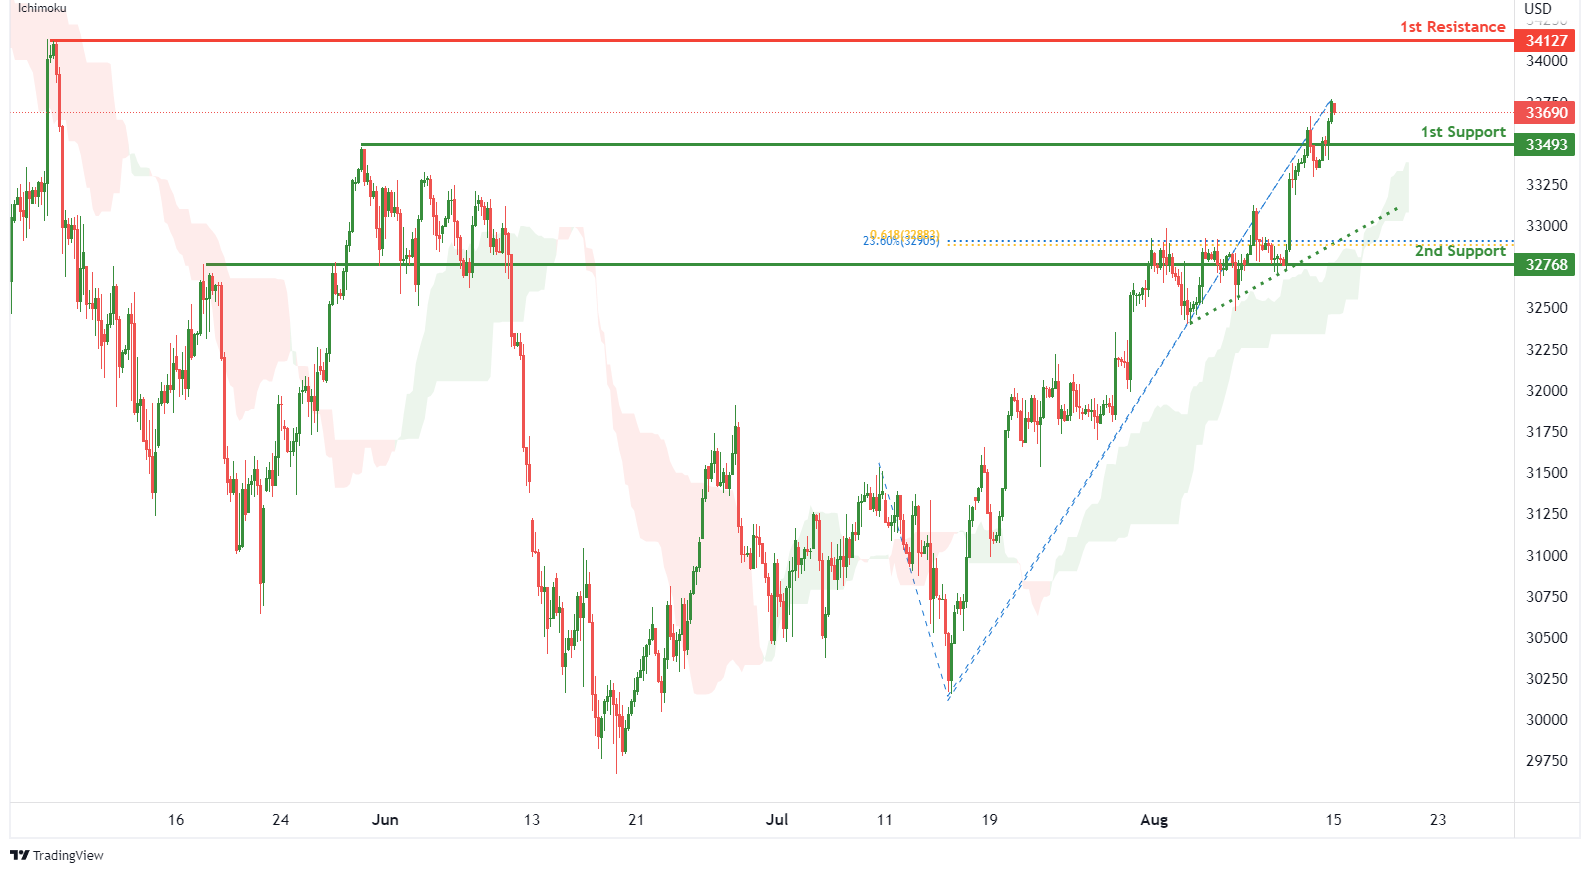
Dow Jones Industrial Average:
On the H4, with price moving above the ichimoku indicator and along an ascending trendline, we have a bullish bias that price will rise from our 1st support at 33493 where the pullback support is to the 1st resistance at 34127 where the swing high resistance is. Alternatively, price could break 1st support structure and drop to 2nd support at 32768 where the pullback support, 23.6% fibonacci retracement and 61.8% fibonacci projection are.
Areas of consideration:
- H4 time frame, 1st resistance of 34127
- H4 time frame, 1st support at 33493
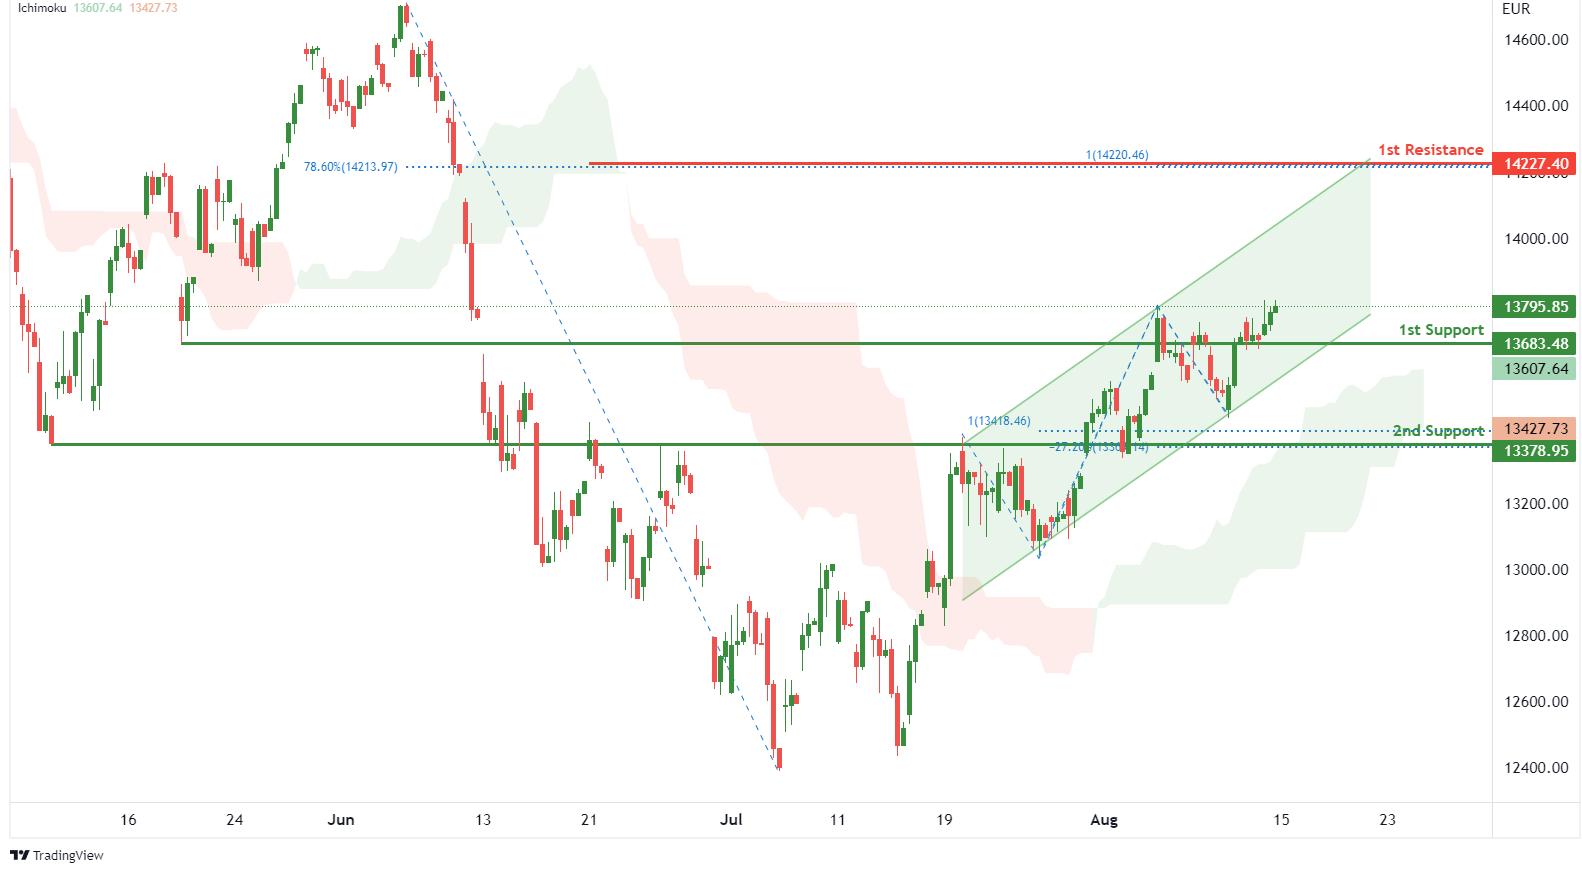
DAX:
On the H4, with price moving above the ichimoku indicator and within the ascending channel, we have a bullish bias that price will rise from 1st support at 13683.48 where the pullback support is to the 1st resistance at 14227.40 in line with 100% fibonacci projection and 78.6% fibonacci retracement. Alternatively, price could break 1st support and drop to 2nd support at 13378.95 where the overlap support, -27.2% fibonacci expansion and 100% fibonacci projection are.
Areas of consideration:
- H4 time frame, 1st resistance of 14227.40
- H4 time frame, 1st support at 13683.48
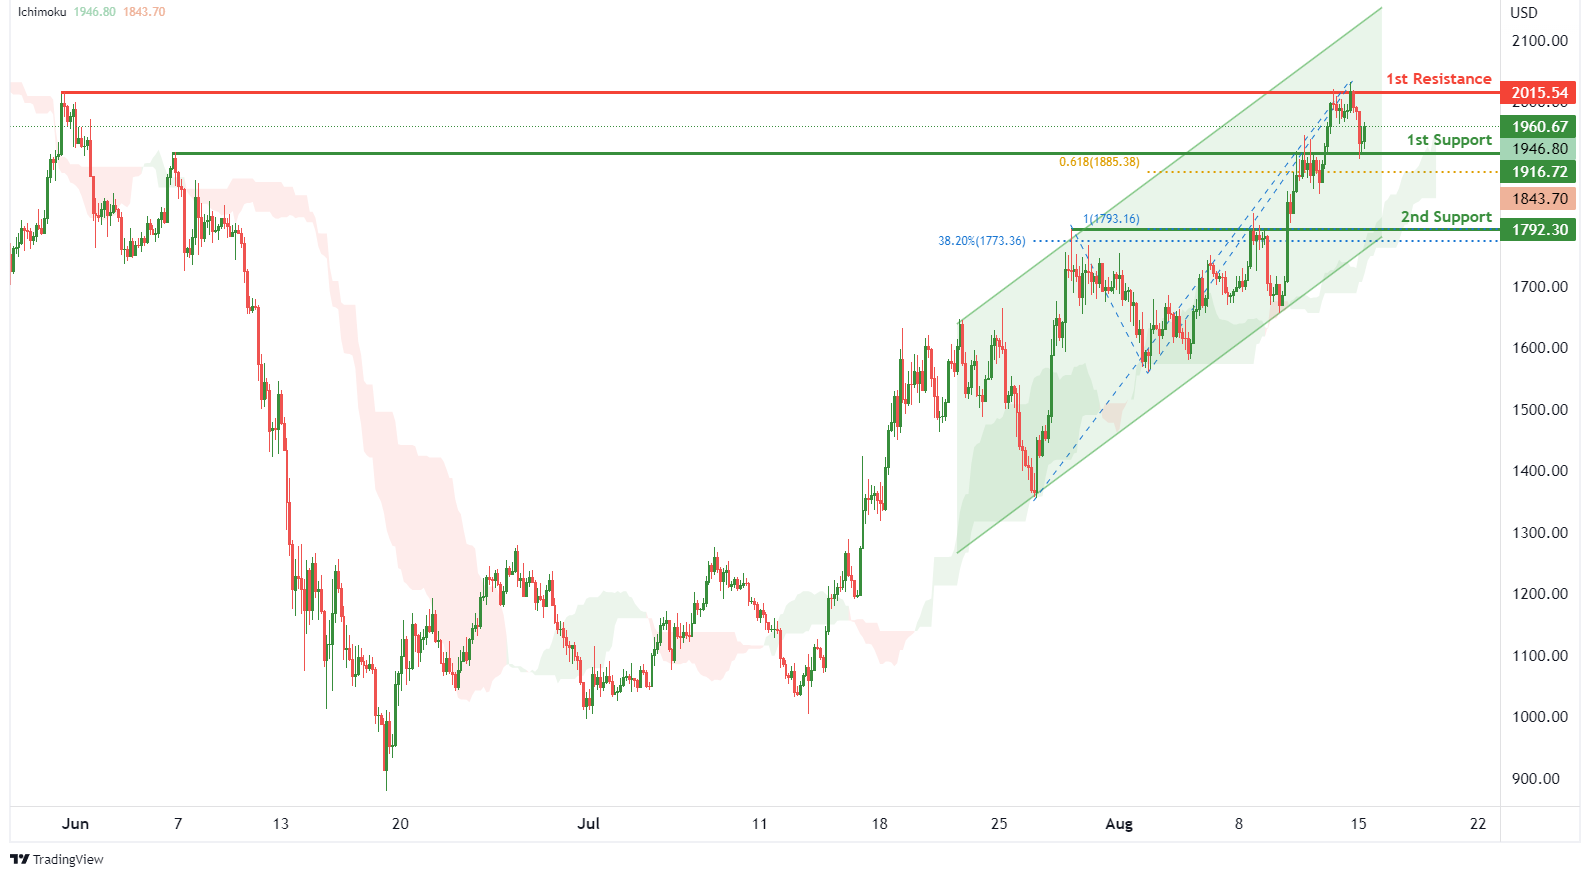
ETHUSD:
On the H4, with price moving within an ascending channel and above the ichimoku indicator, we have a bullish bias that price will rise from 1st support at 1916.72 where the pullback support and 61.8% fibonacci projection are to the 1st resistance at 2015.54 where the swing high resistance is. Alternatively, price could break 1st support structure and drop to 2nd support at 1792.30 where the overlap support, 38.2% fibonacci retracement and 100% fibonacci projection are.
Areas of consideration:
- H4 time frame, 1st resistance of 2015.54
- H4 time frame, 1st support at 1916.72
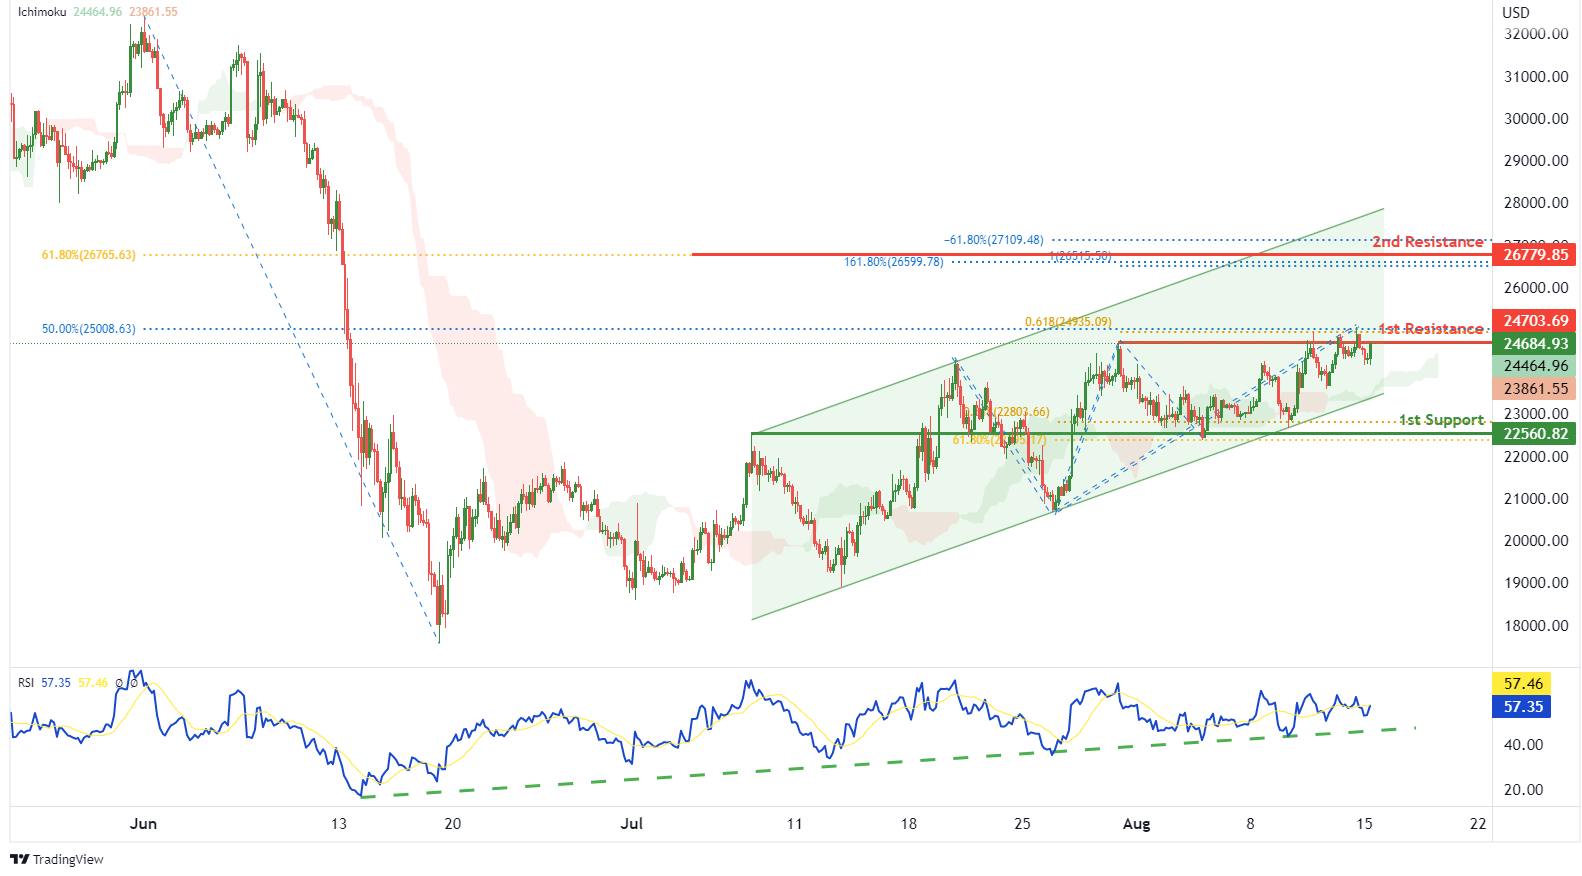
BTCUSD:
On the H4, with price moving within a bullish channel as well as above the ichimoku indicator and RSI moving along an ascending trendline, we have a bullish bias that price will rise to our 1st resistance at 24703.69 where the swing high resistance, 50% fibonacci retracement and 61.8% fibonacci projection are. Once there is upside confirmation that price has broken 1st resistance structure, we would expect bullish momentum to carry price to 2nd resistance at 26779.85 where the 61.8% fibonacci retracement, -61.8% fibonacci expansion, 161.8% fibonacci extension and 100% fibonacci projection are. Alternatively, price could drop to 1st support at 22560.82 where the pullback support, 61.8% fibonacci retracement and 61.8% fibonacci projection are.
Areas of consideration:
- H4 time frame, 1st resistance of 24703.69
- H4 time frame, 1st support at 22560.82
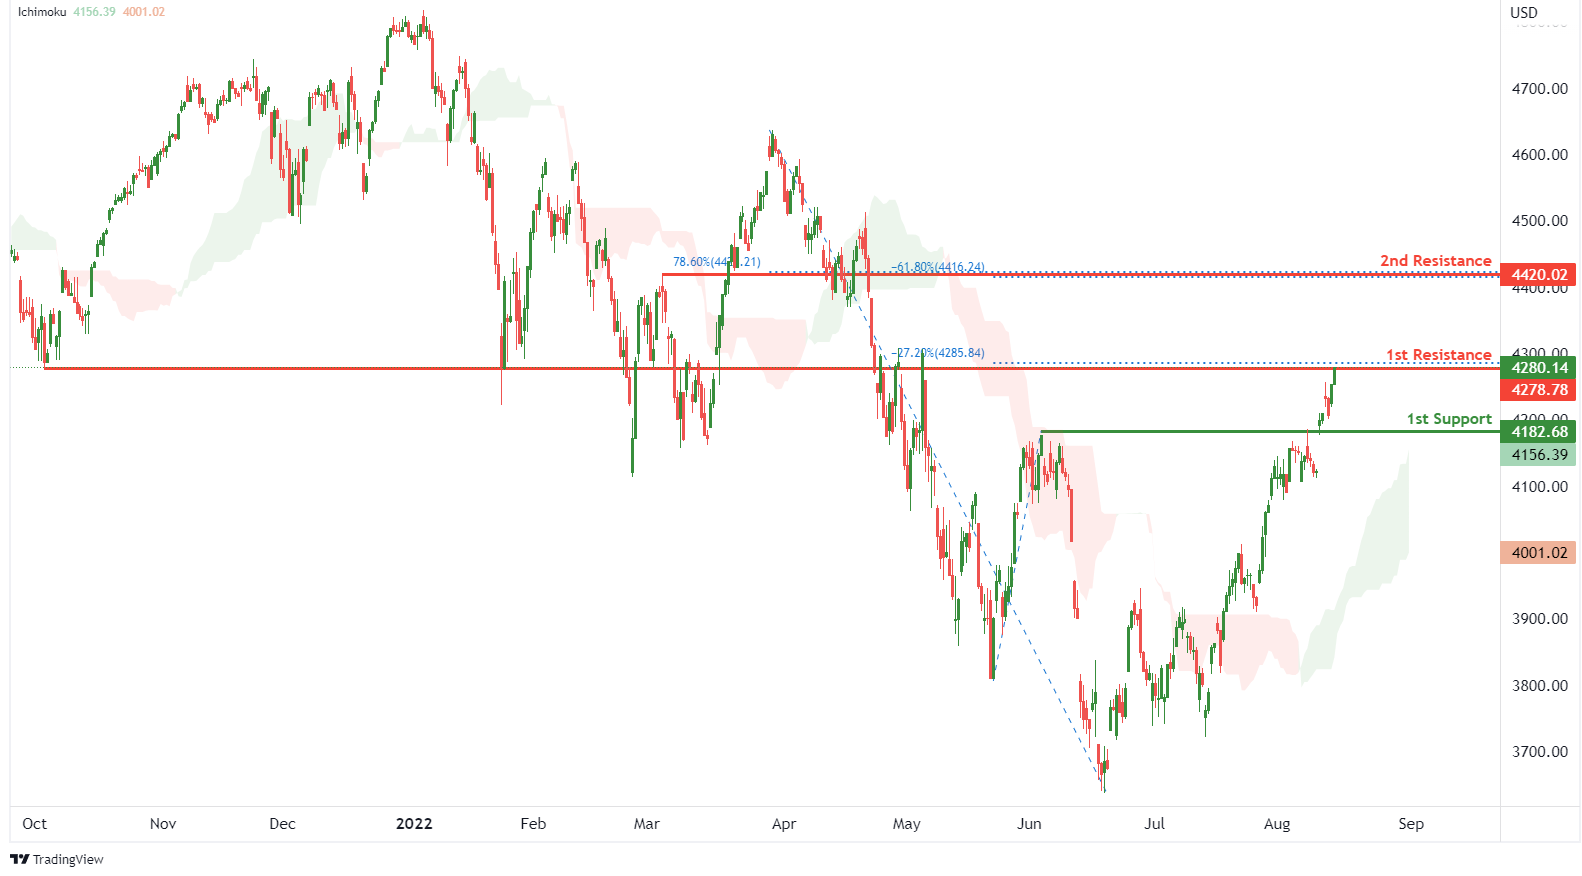
S&P 500:
On the H4, with prices moving above the ichimoku indicator, we have a bullish bias that price will rise to 1st resistance at 4278.78 where the overlap resistance and -27.2% fibonacci expansion are. Once there is upside confirmation that price has broken 1st resistance structure, we would expect bullish momentum to carry price to 2nd resistance at 4420.02 where the pullback resistance, 78.6% fibonacci retracement and -61.8% fibonacci expansion are. Alternatively, price could drop to 1st support at 4182.68 where the pullback support is.
Areas of consideration:
- H4 time frame, 1st resistance of 4278.78
- H4 time frame, 1st support at 4182.68
The accuracy, completeness and timeliness of the information contained on this site cannot be guaranteed. IC Markets does not warranty, guarantee or make any representations, or assume any liability regarding financial results based on the use of the information in the site.
News, views, opinions, recommendations and other information obtained from sources outside of www.icmarkets.com.au, used in this site are believed to be reliable, but we cannot guarantee their accuracy or completeness. All such information is subject to change at any time without notice. IC Markets assumes no responsibility for the content of any linked site.
The fact that such links may exist does not indicate approval or endorsement of any material contained on any linked site. IC Markets is not liable for any harm caused by the transmission, through accessing the services or information on this site, of a computer virus, or other computer code or programming device that might be used to access, delete, damage, disable, disrupt or otherwise impede in any manner, the operation of the site or of any user’s software, hardware, data or property.