A note on lower timeframe confirming price action…
Waiting for lower timeframe confirmation is our main tool to confirm strength within higher timeframe zones, andhas really been the key to our trading success. It takes a little time to understand the subtle nuances, however, as each trade is never the same, but once you master the rhythm so to speak, you will be saved from countless unnecessary losing trades. The following is a list of what we look for:
- A break/retest of supply or demand dependent on which way you’re trading.
- A trendline break/retest.
- Buying/selling tails – essentially we look for a cluster of very obvious spikes off of lower timeframe support and resistance levels within the higher timeframe zone.
- Candlestick patterns. We tend to only stick with pin bars and engulfing bars as these have proven to be the most effective.
EUR/USD:
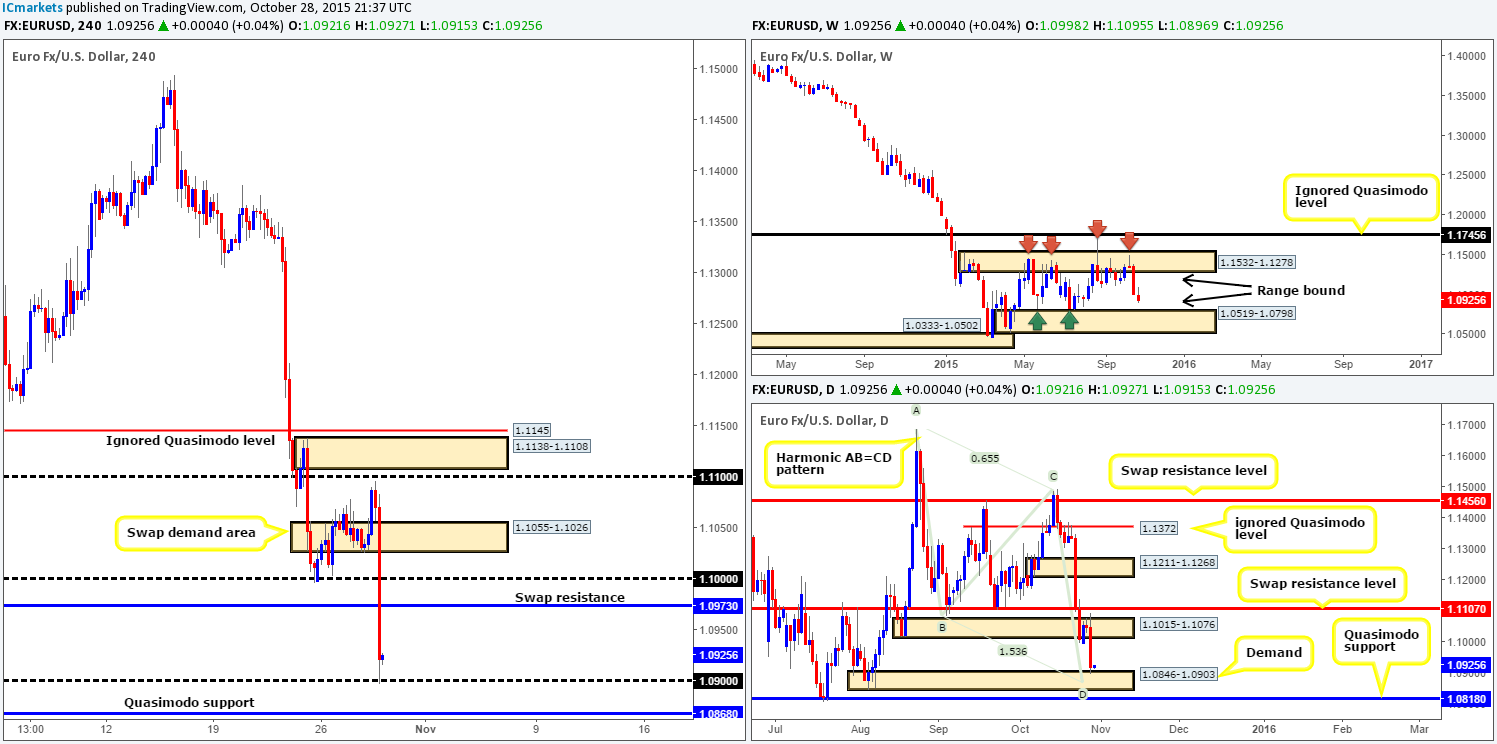
Initial trade saw a steady round of bids flow into the market yesterday from deep within a swap demand area coming in at 1.1055-1.1026. For all that though, the EUR took a turn for the worst dropping around 200 pips from highs of 1.1095 (13 pips away from out noted sell zone at supply 1.1138-1.1108) shortly after the Fed’s hawkish comments. This downside move, as you can see, took out several 4hr technical levels during its onslaught and only saw any sign of stabilizing once it reached psychological support 1.0900.
In view of price currently trading at a noteworthy psychological number right now, would we consider the 1.0900 figure a stable enough platform to buy from today? Well, the weekly chart shows price still has room to depreciate further within its current range down to demand at 1.0519-1.0798. Daily action, on the other hand, shows price crossing swords with demand at 1.0846-1.0903, which converges with a nice-looking Harmonic AB=CD bull pattern at 1.0869.
Therefore, to answer our question above in bold, we would consider this a stable enough level to look for buys today. That said, we would not be comfortable entering long at market here. There would have to be some form of lower timeframe buying confirmation seen, preferably from either the 30/60 minute timeframes before we’d consider risking capital on this idea. Should the above come to fruition, our immediate take-profit area falls in at 1.0973 – a support-turned resistance line.
Levels to watch/live orders:
- Buys: 1.0900 [Tentative – confirmation required] (Stop loss: dependent on where one confirms this level).
- Sells:Flat (Stop loss: N/A).
GBP/USD:
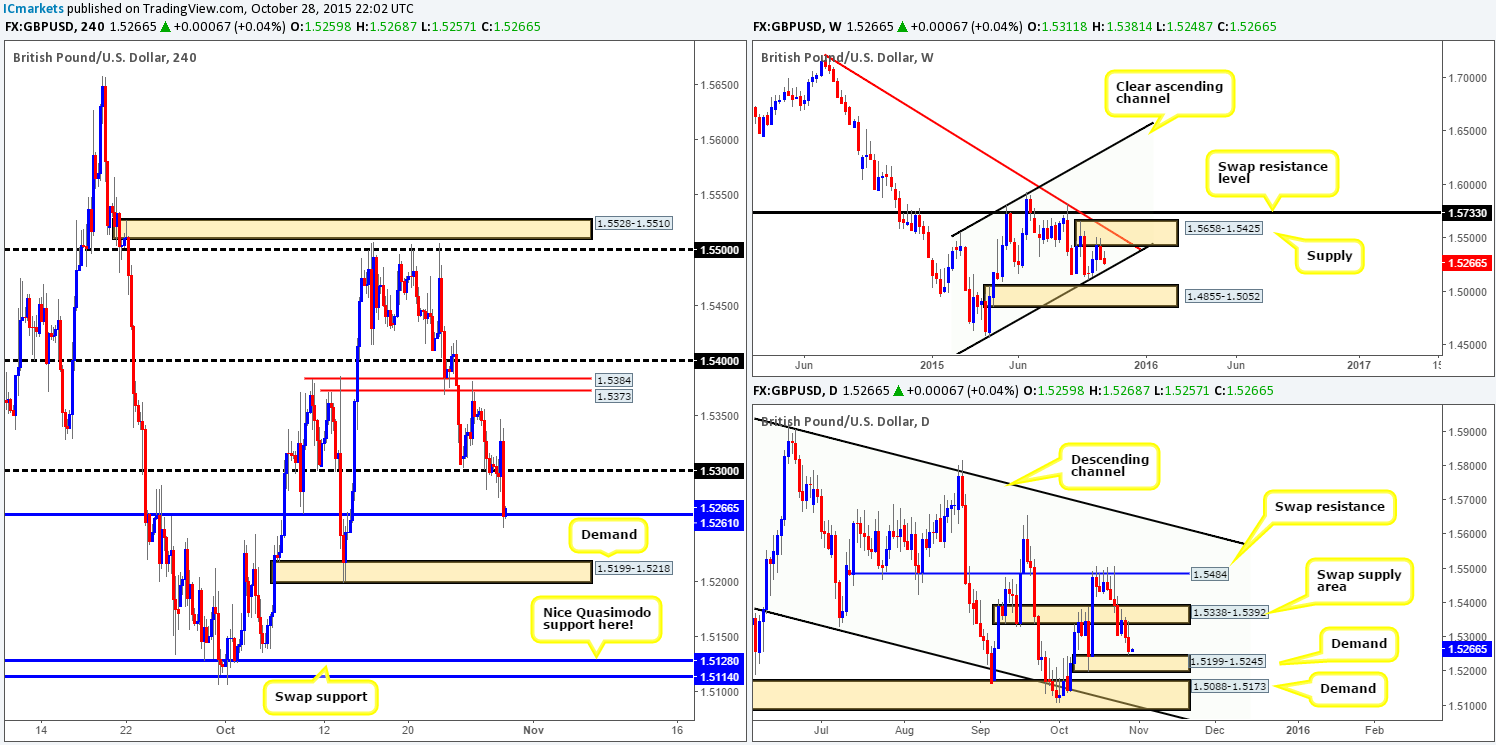
Early on during yesterday’s London trade, we saw price paint back-to-back indecision candles around the 1.5300 figure on the 4hr chart. Nevertheless, as Cable entered into the American session, buyers stepped in and pushed this market to highs of 1.5347 before aggressively plummeting lower following the FOMC statement.
As can be seen from the chart, 1.5300 was taken out and the day ended with price connecting with the 1.5261 area – a swap support base. Although there is some buying interest being seen here at the moment, we have no plan to enter long from this area. Instead, we have our beady little eye on the demand zone seen below at 1.5199-1.5218. The reason? Scan across to both the weekly and daily timeframes. Check out how weekly price shows room to continue lower to connect with channel support extended from the low 1.4564, and daily action reveals price hovering above demand at 1.5199-1.5245. If price stabs into this daily area, we will likely see the aforementioned 4hr demand zone hit as well.
Given the converging structures seen at the above said 4hr demand areas, we are placing a pending buy order at 1.5220 with a stop at 1.5185 (below a 5 minute demand). Granted, this is quite a large stop. The reason for this comes from seeing psychological support lurking deep within our buy zone, thus giving well-funded traders the opportunity to fake both our demand area and the round number at the same time!
Levels to watch/ live orders:
- Buys: 1.5220 [Pending order] (Stop loss: 1.5185).
- Sells: Flat (Stop loss: N/A).
AUD/USD:
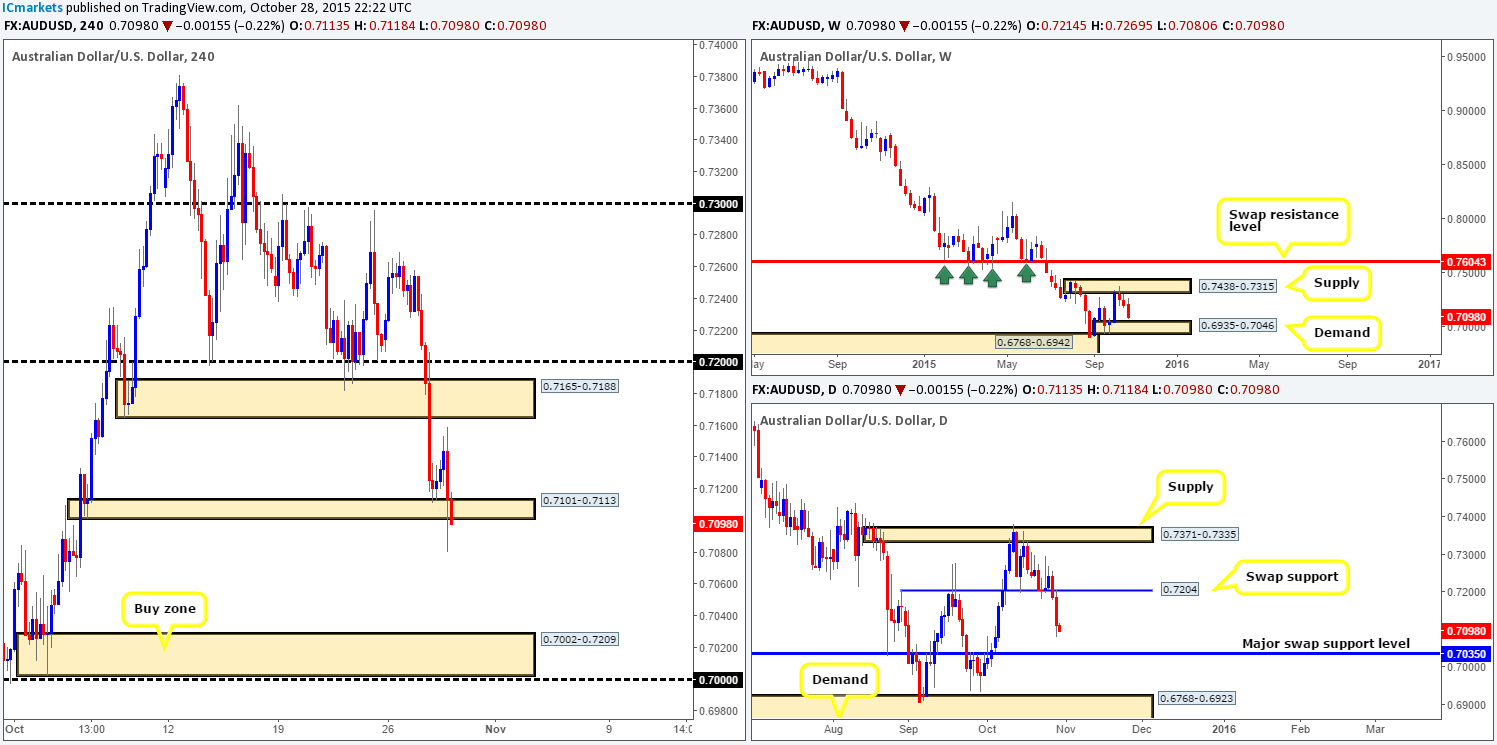
After the AUD/USD shook hands with demand at 0.7101-0.7113 at the beginning of yesterday’s trading day, a steady wave of buying was seen coming into this market, reaching highs of 0.7159 going into the American afternoon session. It was around this time, the FOMC meeting, did the Aussie take a turn for the worst. In one fell swoop, price dropped around 80 pips, stabbing below the above said demand and stretching to lows of 0.7080 by the day’s end.
With bids likely weakened around the current demand zone, where do we go from here? On the whole, we see further selling in store for this pair due to the following:
- The weekly chart shows room to continue on its path south down towards demand sitting at 0.6935-0.7046.
- In addition, we can also see that daily action has a clear path south down to a major swap support barrier coming in at 0.7035, which is located within the above said weekly demand.
Therefore, with the higher timeframes indicating a move lower is possible; the next area we’ll be looking to buy from on this pair can be seen at 0.7002-0.7209 since it sits around the aforementioned higher timeframe areas.
Additionally, seeing as we believe this pair is heading lower, we may look to short if price closes below the current 4hr demand and retests it as supply along with lower timeframe confirming price action. The target should be obvious – our next buy zone drawn from 0.7002-0.7209.
Levels to watch/ live orders:
- Buys: 0.7002-0.7209 [dependent on the approach to this zone and time of day, we may consider entering at market here] (Stop loss: likely below 0.7000 by about 10 pips).
- Sells:Watch for bids to be consumed around 0.7101-0.7113 and then look to trade any retest seen at this area (confirmation required).
USD/JPY:
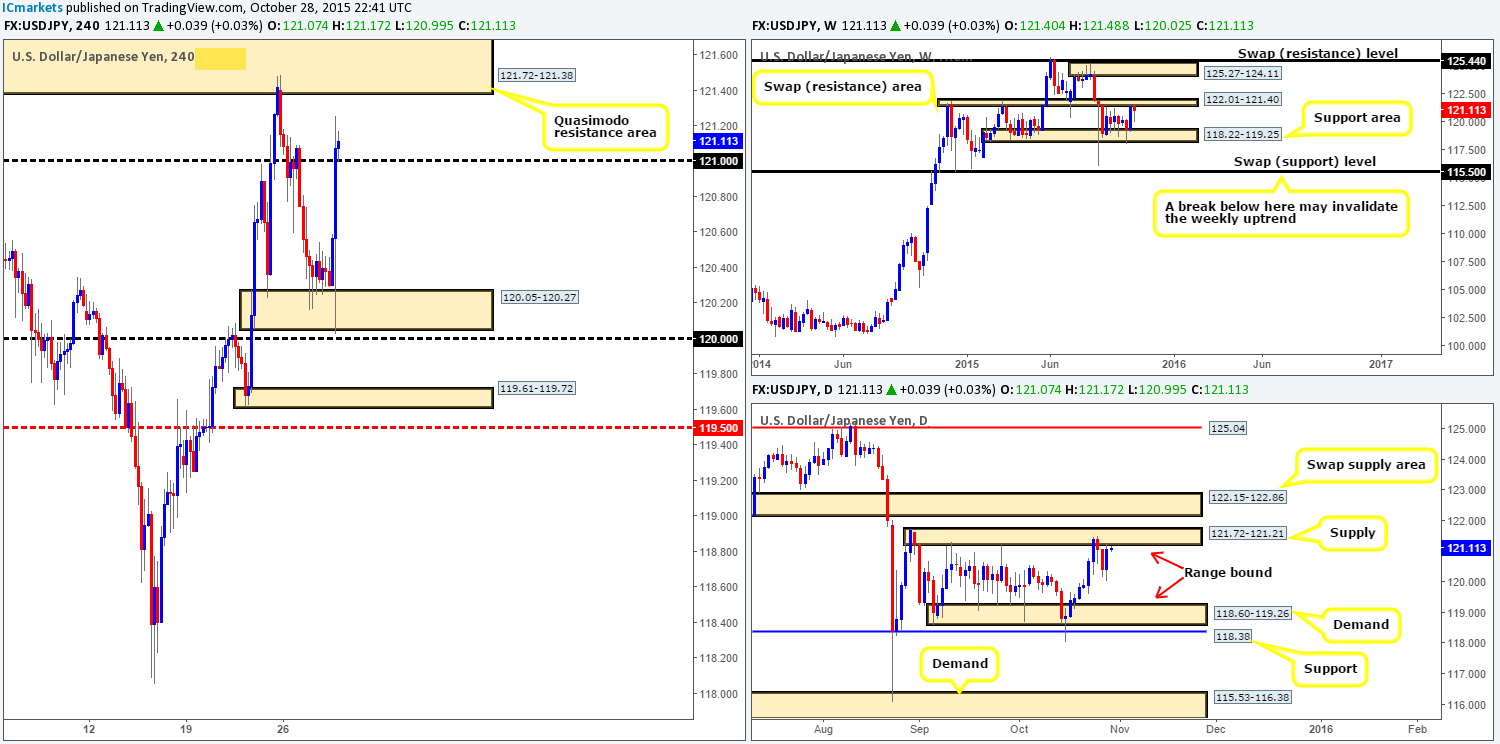
Following a lengthy consolidation above demand at 120.05-120.27 yesterday, we saw this pair come alive on the back of the Fed’s recent comments regarding a possible rate hike. The recent surge of buying saw price stab to lows of 120.02 (just below the demand and also two pips shyof psychological support 120.00), before rallying up to the121.00 psychological resistance area.
This has, if you look across to the higher timeframe picture, placed this market firmly back within the jaws of both the weekly range resistance area at 122.01-121.40, and also the daily range supply area visible at121.72-121.21. Therefore, given that price is now seen holding above 121.00 at the moment, this number will be a key determinant to how we approach this market today.
Should 121.00 fail to hold as support, the river south should be ‘ripple free’ back down to demand mentioned above at 120.05-120.27. Forus to be permitted to trade this move, if price breaks lower of course, we’d need to see two things happen. Firstly, a retest of 121.00 as resistance, and secondly a lower timeframe confirming sell signal. On the other side of the coin, assuming that 121.00 holds as support, we’ll then be looking for confirmed sells within the Quasimodo resistance area above at 121.72-121.38.
Levels to watch/ live orders:
- Buys: Flat (Stop loss: N/A).
- Sells: Watch for bids to be consumed around 121.00 and then look to trade any retest seen at this level (confirmation required) 121.72-121.38 [Tentative – confirmation required] (Stop loss: dependent on where one confirms this area).
USD/CAD:
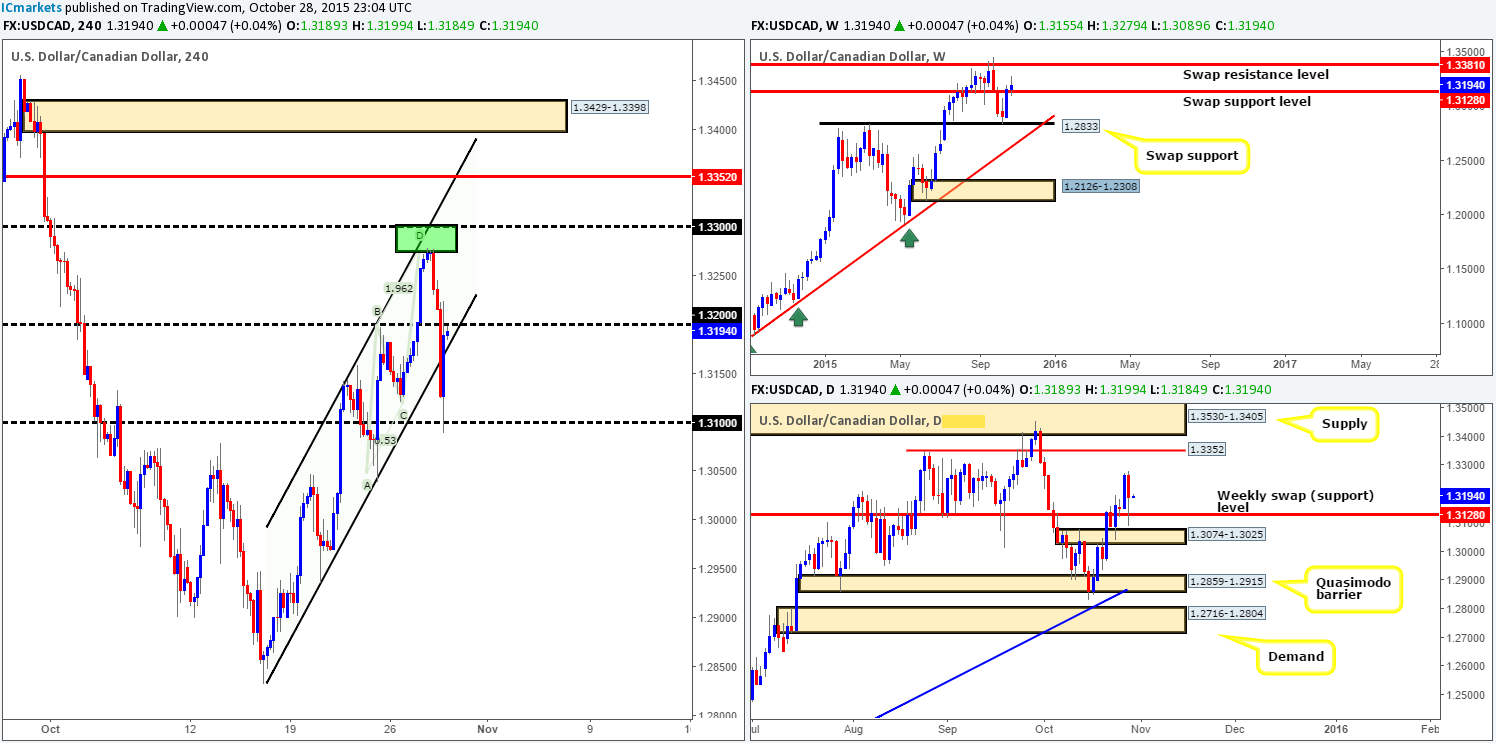
For those who read our previous report (http://www.icmarkets.com/blog/wednesday-28th-october-all-eyes-will-be-on-the-fomc-meeting-today-remain-vigilant/), you may recall us noting to be on the watch for a potential sell-off from our green sell zone comprising of an AB=CD top at 1.3275 and the psychological resistance level 1.3300. As you can see, price did indeed see a drop from the area and in aggressive fashion as well! We’re kicking ourselves on two things this morning: (1) we were not around to catch this move (2) we only planned to take an intraday short from here, which meant that even if we did take the trade, we’d have left a ton of profit on the table.
Some of the losses sustained from this recent move south were recouped from the rebound off of psychological support 1.3100 back up to the underside of 1.3200, consequent to the FOMC’s hawkish comments.
Technically, price is now sandwiched between 1.3200 and the channel support extended from the low 1.2832 at the moment. However, looking across to the bigger picture, we can see that this market is still trading above the weekly swap (support) barrier at 17135. With that, we’re expecting to see a break above 1.3200 today, with the possibility of a continuation move (which we intend to take advantage of if a confirmed retest of this number is seen) back up to 1.3300.
Levels to watch/ live orders:
- Buys:Watch for offers to be consumed around 1.3200 and then look to trade any retest seen at this level (confirmation required).
- Sells:Flat (stop loss: N/A).
USD/CHF:
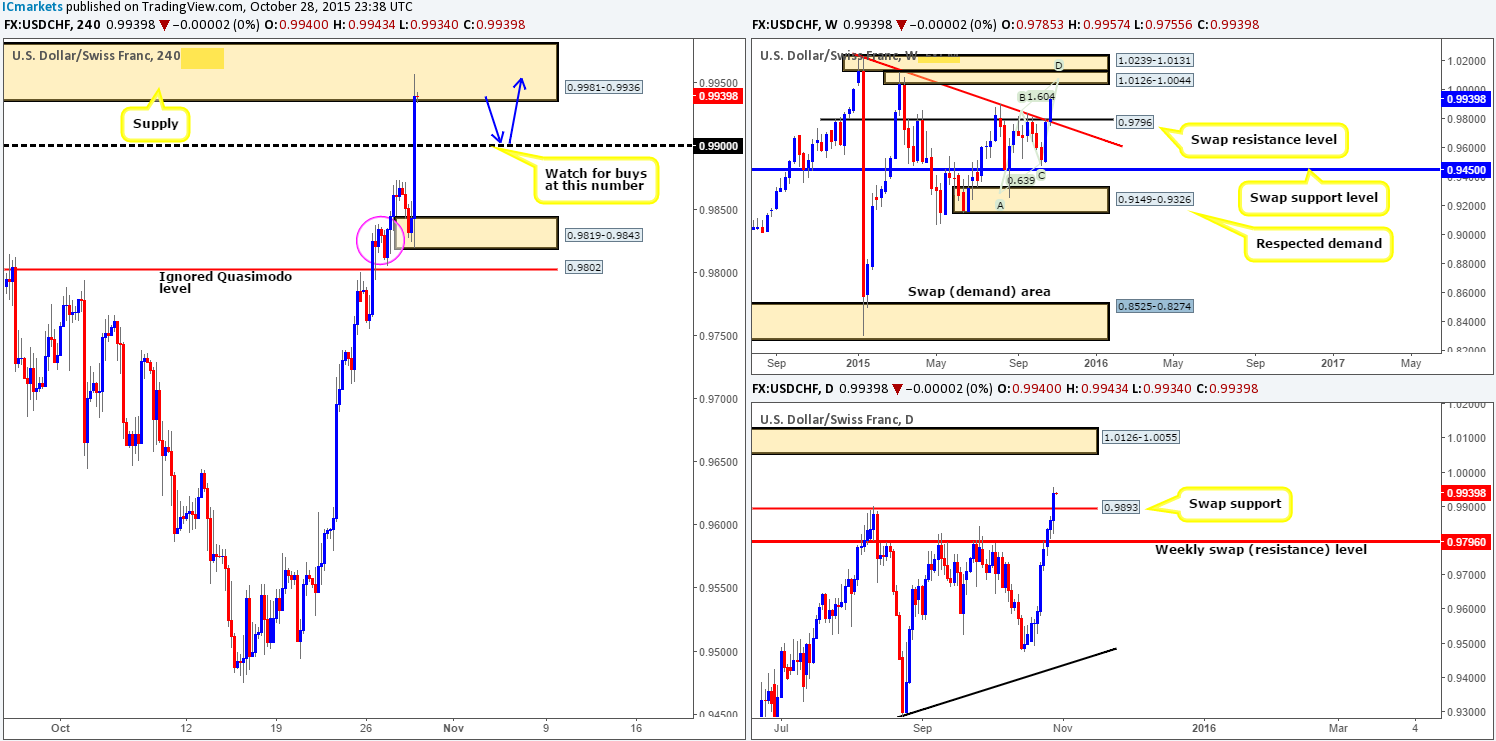
The USD/CHF pair, as you can see, catapulted itself to new highs yesterday from demand circled in pink at 0.9805-0.9830 following the FOMC statement. This recent surge saw price wipe out offers around psychological resistance 0.9900 and connect with supply seen at 0.9981-0.9936 by the day’s close 0.9940.
At this point, we see little to no higher timeframe resistance backing this zone. In fact, the weekly shows a clear run north up to a stacked area of supply coming in at 1.0239-1.0131/1.0126-1.0044. In addition to this formation, we also see a nice-looking AB=CD Harmonic pattern completing around 1.0046, thus making this one heck of a sell zone should price reach this high! In-line with the weekly timeframe, daily action also reveals that price is now free to continue north up to supply coming in at 1.0126-1.0055 (lodged deep within the above said weekly supply 1.0126-1.0044).
For this reason, a reversal from the current 4hr supply zone is not something we’d label high probability – the most we see price reaching to, should this market sell-off from here, is psychological support 0.9900 (ties in nicely with the daily swap [support] level at 0.9893) . Given the above, our team will be watching the 0.9900 levelfor confirmed longs (see blue arrows), targeting parity. Failing a pullback to 0.9900, however, we will be looking to trade long off a break and retest of the mid-level number 0.9950, again targeting parity. It will be interesting to see how this plays out!
Levels to watch/ live orders:
- Buys: 0.9900 [Tentative – confirmation required] (Stop loss: dependent on where one confirms this level) Watch for a break and confirmed retest of the mid-level number 0.9950.
- Sells:Flat (Stop loss: N/A).
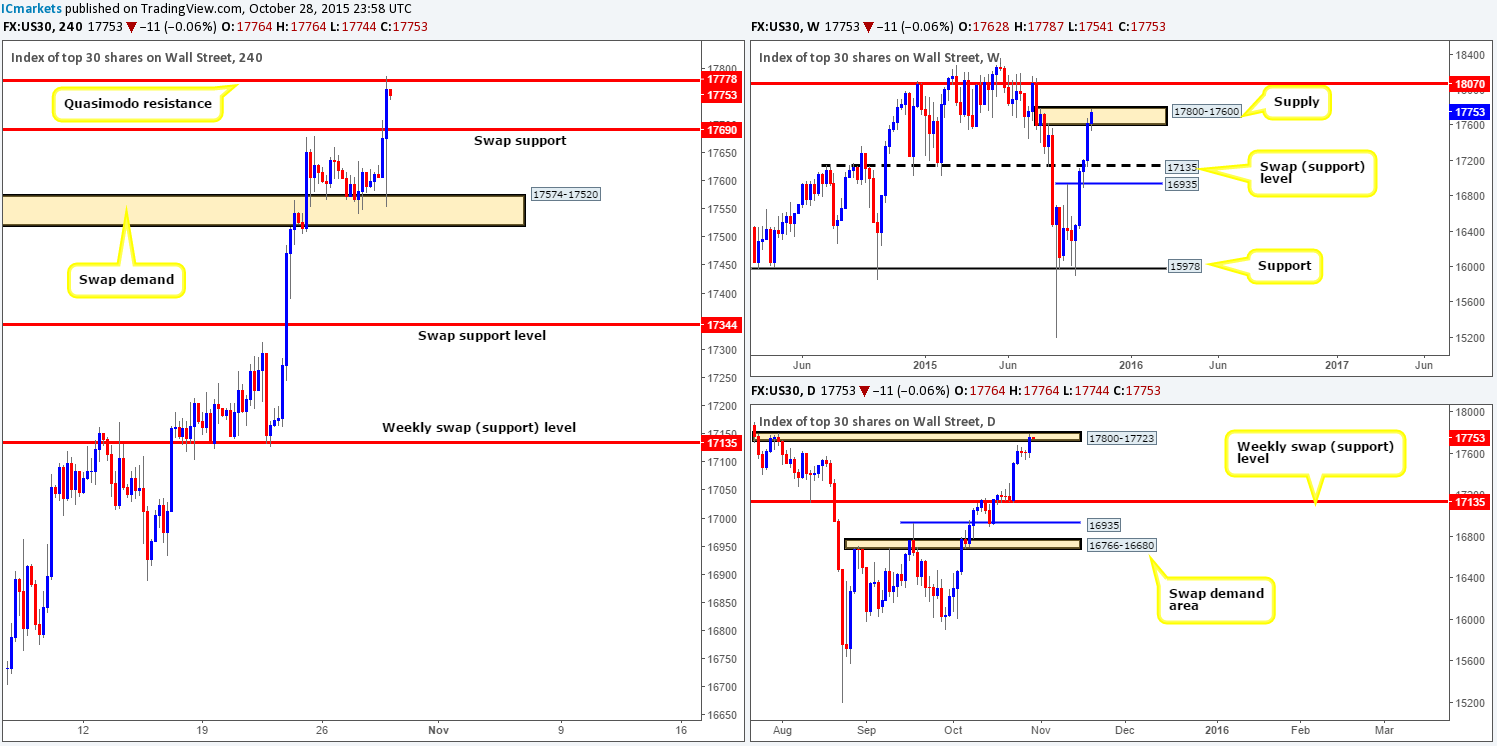
DOW 30: (We still have a LIVE short in the market from 17527 with our stop at 17830 [above weekly supply]).
Finally, we saw some movement in this recently dormant market! The DOW aggressively rallied higher from the base of a swap demand area at 17574-17520 following the FOMC shenanigans, taking out 17690, which was resistance at the time, and connecting with a Quasimodo resistance barrier chalked up at 17778.
Considering that this Quasimodo level is lodged deeeeeep within a weekly supply zone at 17800-17600 and also its partner zone on the daily timeframe at 17800-17723, we are looking to short this market here if lower timeframe confirmation presents itself. Technically, this is a sound enough area to enter at market in our opinion. The only reason for us not doing so is simply because we are already currently short from 17527 with our stop just above the weekly supply zone at 17830. The first target for any sells taken here would be the swap support barrier at 17690, followed closely by swap demand coming in at 17574-17520.
Levels to watch/ live orders:
- Buys: Flat (Stop loss: N/A).
- Sells:17527 [LIVE] (Stop loss: 17830) 17778 [Tentative – confirmation required] (Stop loss: dependent on where one confirms this level).
XAU/USD: (Gold)
Gold took a huge hit following the FOMC statement yesterday. Prices declined over $30 in one fell swoop from the resistance area coming in at 1180.7-1176.9, pushing this market into the depths of a small, yet clearly resilient Quasimodo base drawn from 1151.7-1154.7 (converges with a swap support level at 1153.7, and lurks just below a daily swap [demand] area at 1169.8-1154.7).
Before considering a buy from this zone, one should always check where this market is positioned on the higher timeframe picture. As you can see, despite the recent decline in value, Gold remains steady above the weekly swap support barrier at 1157.4. In addition to this, we can also see that although price spiked below the aforementioned daily swap (demand) area yesterday, price is holding steady within this zone.
As such, supposing we are able to pin-point a lower timeframe buy entry around the current 4hr Quasimodo base today, we plan on entering long, targeting the swap resistance level 1162.2, and given enough time, the resistance area mentioned above at 1180.7-1176.9.
Levels to watch/ live orders:
- Buys:1151.7-1154.7 [Tentative – confirmation required] (Stop loss: dependent on where one confirms this area).
- Sells:Flat (Stop loss: N/A).