A note on lower timeframe confirming price action…
Waiting for lower timeframe confirmation is our main tool to confirm strength within higher timeframe zones, and has really been the key to our trading success. It takes a little time to understand the subtle nuances, however, as each trade is never the same, but once you master the rhythm so to speak, you will be saved from countless unnecessary losing trades. The following is a list of what we look for:
- A break/retest of supply or demand dependent on which way you’re trading.
- A trendline break/retest.
- Buying/selling tails – essentially we look for a cluster of very obvious spikes off of lower timeframe support and resistance levels within the higher timeframe zone.
- Candlestick patterns. We tend to only stick with pin bars and engulfing bars as these have proven to be the most effective.
EUR/USD:
Another relatively sluggish day was seen in the EUR/USD market yesterday. Whilst price was sitting deep within a swap demand area at 1.1055-1.1026, the pair peaked to highs of 1.1078 and recorded a session low around the 1.1030 mark.
Going forward, the market is now likely honing in on today’s FOMC statement, where traders/investors will breakdown the words used in the statement for clues about when the Fed may raise interest rates.
Technically, however, our team is looking at the following areas today (lower timeframe confirmation is required at each zone):
- Psychological support 1.1000. Just to be clear here, this number does not, at least in our opinion, boast any higher timeframe supporting structures. The weekly is currently trading mid-range between 1.1532-1.1278/1.0519-1.0798, while daily action recently took out demand drawn from 1.1015-1.1076, potentially clearing the path south for further selling down to demand seen at 1.0846-1.0903 (converging with a nice-looking Harmonic AB=CD bull pattern). At this point you’re probably wondering why we’re even selecting 1.1000 as a buy zone today. The reason simply comes from the 4hr picture. The sustained move above supply at 1.1055-1.1026 has likely taken out all offers from this region, which, in turn, could suggest further upside today towards psychological resistance 1.1100, followed closely by supply at 1.1138-1.1108.
- Our second area of interest is a sell zone in the form of supply coming in at 1.1138-1.1108. Should price reach as high as 1.1100 today, we’re expecting to see a fakeout above here to tag in offers sitting within this supply. Reason being is the underside of this 4hr supply area ties in perfectly with a daily swap (resistance) level at 1.1107. To be on the safe side here though traders, we would recommend placing your stops above the ignored Quasimodo level lurking just above supply at 1.1145 to avoid any fakeout!

Levels to watch/live orders:
- Buys: 1.1000 [Tentative – confirmation required] (Stop loss: dependent on where one confirms this level).
- Sells: 1.1138-1.1108 [Tentative – confirmation required] (Stop loss: dependent on where one confirms this area).
GBP/USD:
The rebound seen from the underside of the two closely-knit swap resistance levels at 1.5384/1.5373 on Monday, sent Cable tumbling lower down to psychological support 1.5300 during the course of yesterday’s trade. For now, bids appear to be struggling to defend this region and looks, at least from a technical standpoint, that this number may give way later on today. However, this will likely all depend on how the market responds to the FOMC meeting later on, since there’s no high-impacting news on the UK docket today.
Technically, as we mentioned in yesterday’s report, we believe this pair is looking to go lower! Our reasoning lies within the higher timeframe structure. From the weekly, we can see price has recently rebounded from supply coming in at 1.5658-1.5425, and shows room to move south down to channel support taken from the low 1.4564. Daily action also took out bids around a near-term swap demand zone falling in at 1.5338-1.5392, potentially opening up the doors to further selling this week down to the 13th October low 1.5199, followed closely by demand at 1.5088-1.5173.
Assuming that the 1.5300 figure is taken out today, and price retests the underside of this number as resistance, we may, dependent on how the lower timeframe action responds here, look to short this market. Should this come to fruition today, we’ll be eyeing the swap support level below at 1.5261 as our immediate take-profit area, followed by the demand area seen at 1.5199-1.5218.
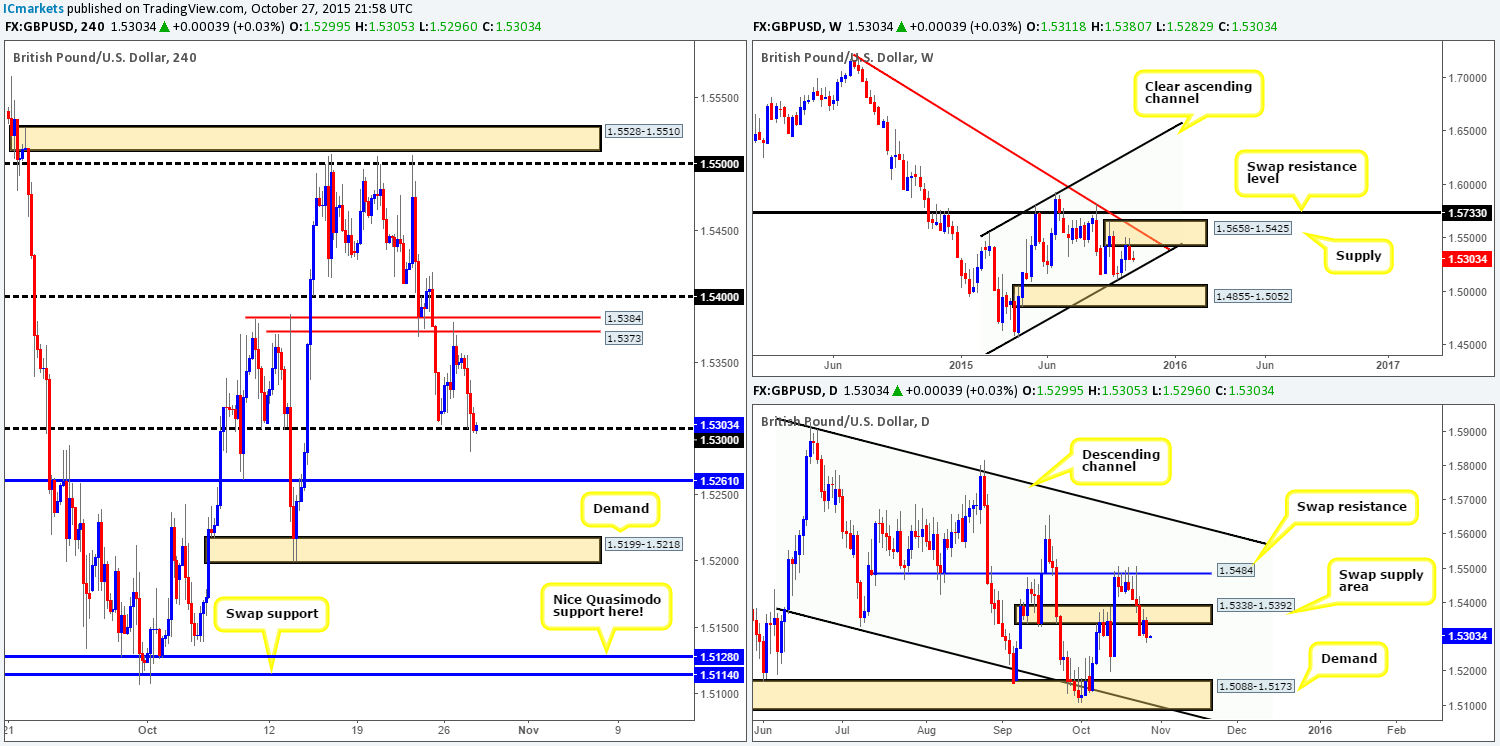
Levels to watch/ live orders:
- Buys: Flat (Stop loss: N/A).
- Sells: Watch for bids to be consumed around 1.5300 and then look to trade any retest seen at this level (confirmation required).
AUD/USD:
The commodity currency saw a decline in value amid yesterday’s trade. Strong sellers stepped in during the early hours of London, consequently surpassing psychological support 0.7200 and connecting with active bids within demand at 0.7165-0.7188 (ties in with downward channel support [0.7197]).
As can be seen from the chart, the buyers and sellers are currently battling for position right now at the underside of 0.7200. Now, one would think that because price is in demand, 0.7200 has a high probability of breaching. However, when we throw the higher timeframes into the mix, the directional bias changes somewhat. Up on the weekly chart, we can see that price continues to be held lower by supply drawn from 0.7438-0.7315. Meanwhile, recent daily action shows price closed below a swap support barrier coming in at 0.7204.
Given the points made above, our approach to this market today will be centered on the current 4hr demand zone. Ultimately, we’re looking for price to close below this barrier and retest the underside as supply. This, in effect, will be our cue to begin looking to short this market, targeting demand at 0.7101-0.7113 first and foremost.
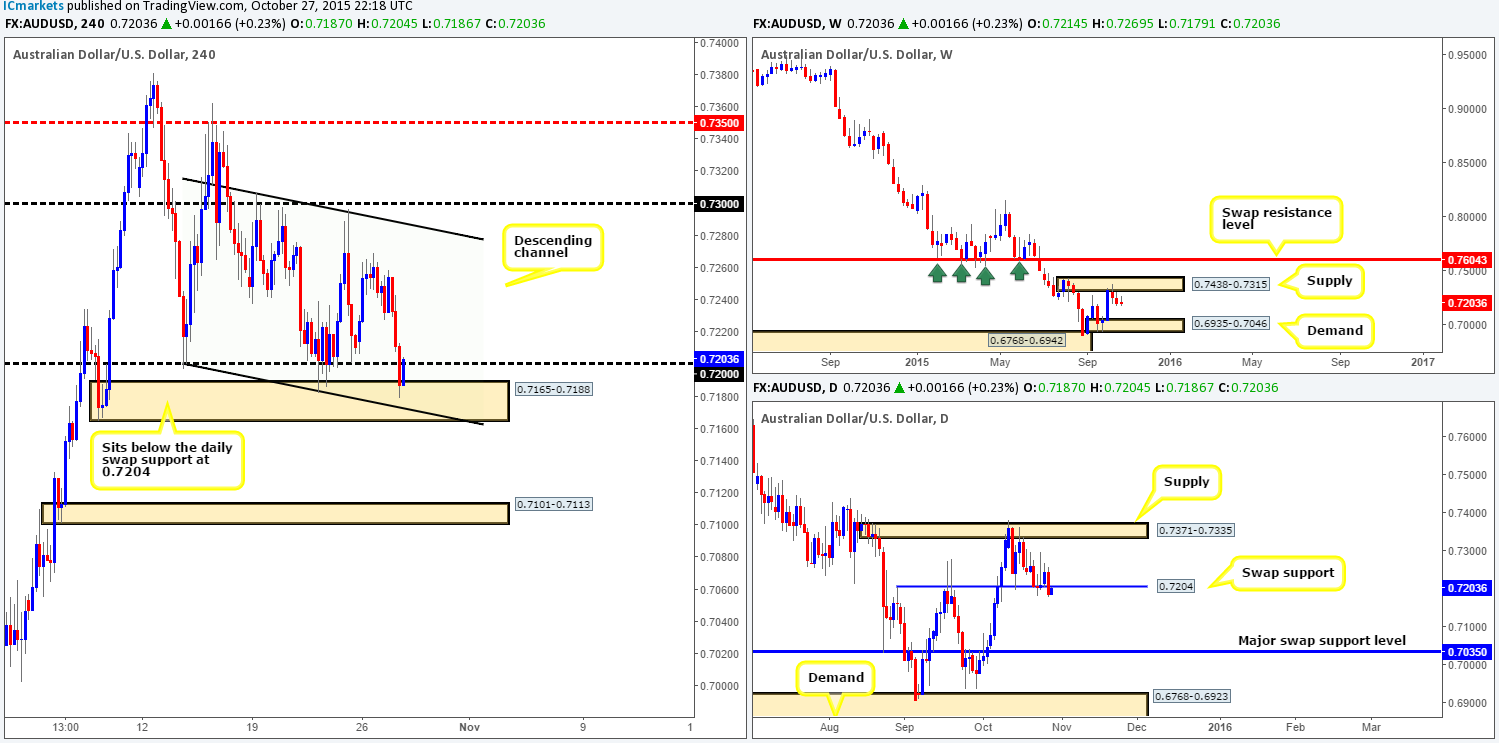
Levels to watch/ live orders:
- Buys: Flat (Stop loss: N/A).
- Sells: Watch for bids to be consumed around 0.7165-0.7188 and then look to trade any retest seen at this area (confirmation required).
USD/JPY:
Kicking off this morning’s analysis with a look at the weekly timeframe shows us that selling interest is currently being seen from the underside of the range resistance area at 122.01-121.40. Should the sellers continue to push this market lower, price will likely attack the range support area visible at 118.22-119.25. On the other side of the spectrum, similar to the weekly chart, we can see that daily action is also selling off from range supply coming in at 121.72-121.21. The next downside target via this timeframe falls in at range demand taken from 118.60-119.26.
Moving down to the pits of the 4hr timeframe, it’s clear enough to see that price begun selling off during the early hours of yesterday’s trade. This descent took out the ignored Quasimodo level at 120.40 and stabbed into demand lurking at 120.05-120.27. We have deemed this demand a valid zone simply because of how well it held the market on Friday at 120.22 (green arrow). Other than this though, it, at least as far as we can see, boasts little supporting convergence from the higher timeframe structures.
Considering that the weekly is selling off from range supply and the daily is, at the time of writing, trading mid-range (see above), as tempting as it is to look for buys from the current 4hr demand zone, we’re going to step aside as the most we see price reaching to from here is the mid-level number 120.50. Ideally, we are going to be looking to short this market on the break and (possible) retest of 120.00, and trail our stop until price reaches the top-side of the aforementioned daily range demand. Potentially troublesome areas to be aware of in between can be seen around demand at 119.61-119.72, followed closely by mid-level support 119.50.
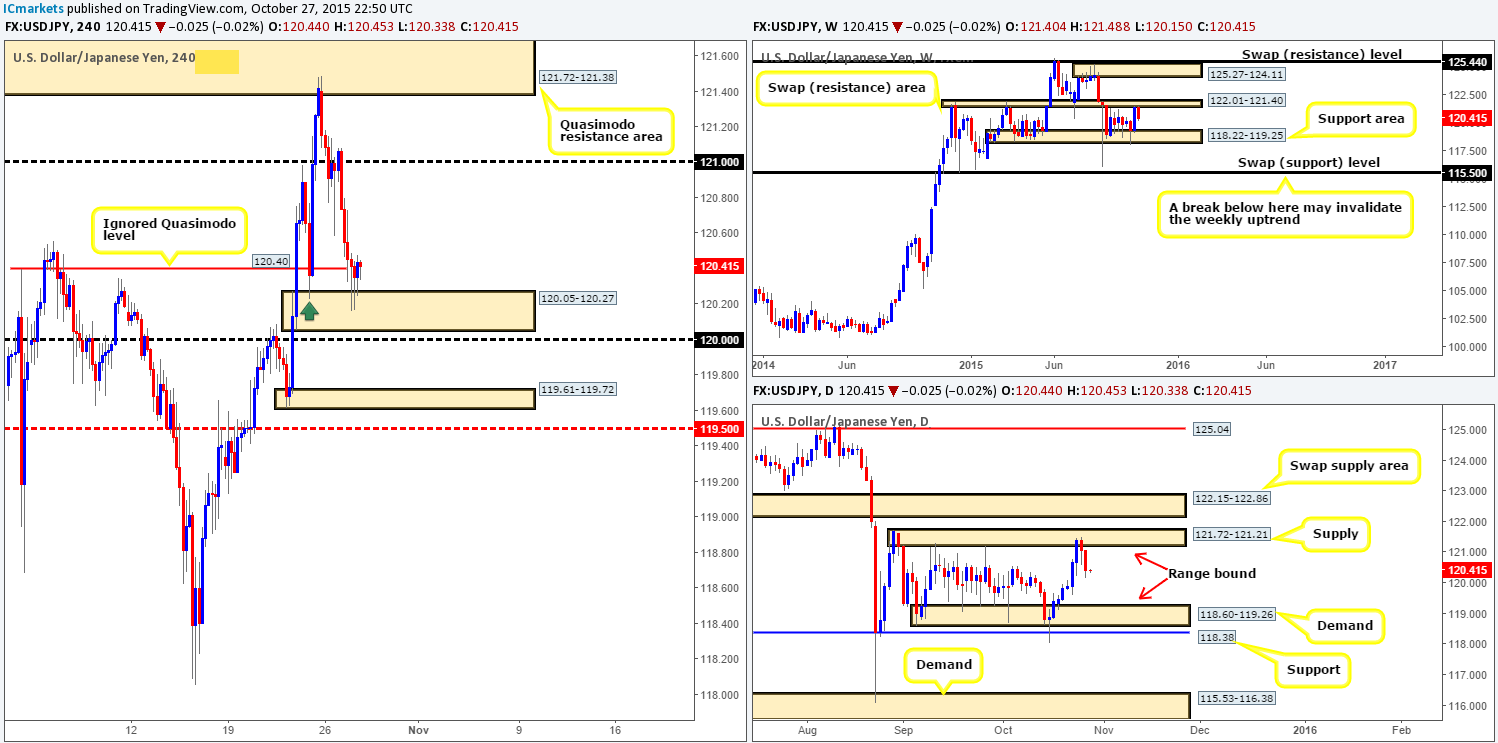
Levels to watch/ live orders:
- Buys: Flat (Stop loss: N/A).
- Sells: Watch for bids to be consumed around 120.00 and then look to trade any retest seen at this level (confirmation required).
USD/CAD:
The USD/CAD saw a sharp increase in value on Tuesday reaching highs of 1.3272 on the day. This, as you can see, took out both psychological resistance 1.3200 and also mid-level resistance 1.3250. In addition, a nice-looking AB=CD bearish pattern was painted on approach, topping out around the 1.3275 mark. This – coupled with price converging with the upward channel resistance taken from the high 1.3142 and psychological resistance just above at 1.3300 could be enough to temporarily halt further buying.
Why only halt and not reverse? Well, when we scanned the higher timeframes on this pair, we could see space to run higher on the weekly scale up to a swap resistance level at 1.3381. Meanwhile, down on the daily timeframe, price reacted very positively yesterday to Monday’s retest of the recently broken weekly swap (resistance) level at 1.3128. What is more, like the weekly chart, there is also room seen on this scale for price to move higher up to at least Quasimodo resistance at 1.3352.
Therefore, our team is only going to be looking for a small (confirmed) intraday short between 1.3275/1.3300 (green sell zone) today. However, once we see price cross above 1.3300, our team will shift into buy mode. Assuming that price retests this number as support following a close higher and lower timeframe action shows positive signs of bullish interest, we’ll jump in long, targeting the aforementioned daily Quasimodo resistance, followed by 4hr supply at 1.3429-1.3398.
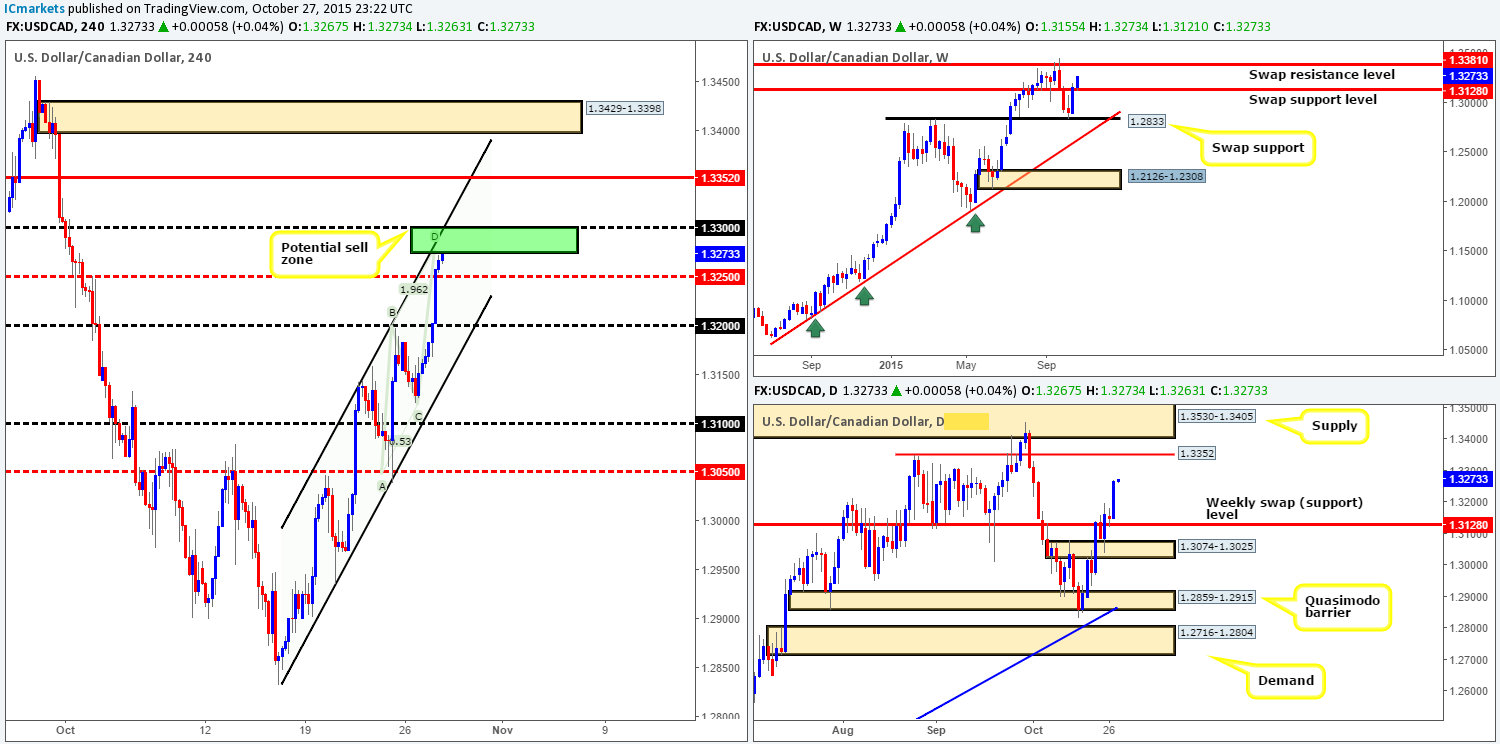
Levels to watch/ live orders:
- Buys: Watch for offers to be consumed around 1.3300 and then look to trade any retest seen at this level (confirmation required).
- Sells: 1.3275/1.3300 [Tentative – confirmation required] (Stop loss: dependent on where one confirms this area).
USD/CHF:
Overall, the USD/CHF extended higher from lows of 0.9805 (just three pips shy of the ignored Quasimodo level 0.9802) amid trade yesterday. Consequent to this, price was forced to shake hands with a daily fakeout level coming in at 0.9861. Judging by the response seen from here on the 4hr timeframe, the offers around this daily level appear very weak! With that in mind, where do we see this market headed today?
Well, from the weekly timeframe it is difficult to tell until the current candle closes up shop. But for now, we will say that if price closes above the swap resistance level 0.9796, the path north will likely be free up to a stacked area of supply coming in at 1.0239-1.0131/1.0216-1.0044. In addition to this formation, we also see a nice-looking AB=CD Harmonic pattern completing around 1.0046, thus making this one heck of a sell zone should price reach this high! Daily action on the other hand, shows that price failed to close above the daily fakeout level by one pip yesterday! Therefore, it is also difficult to say whether there is potential to the upside yet from this angle.
Taking the above into account, we are going to remain flat during today’s trade and wait for the next daily close before making any further judgments.

Levels to watch/ live orders:
- Buys: Flat (Stop loss: N/A).
- Sells: Flat (Stop loss: N/A).
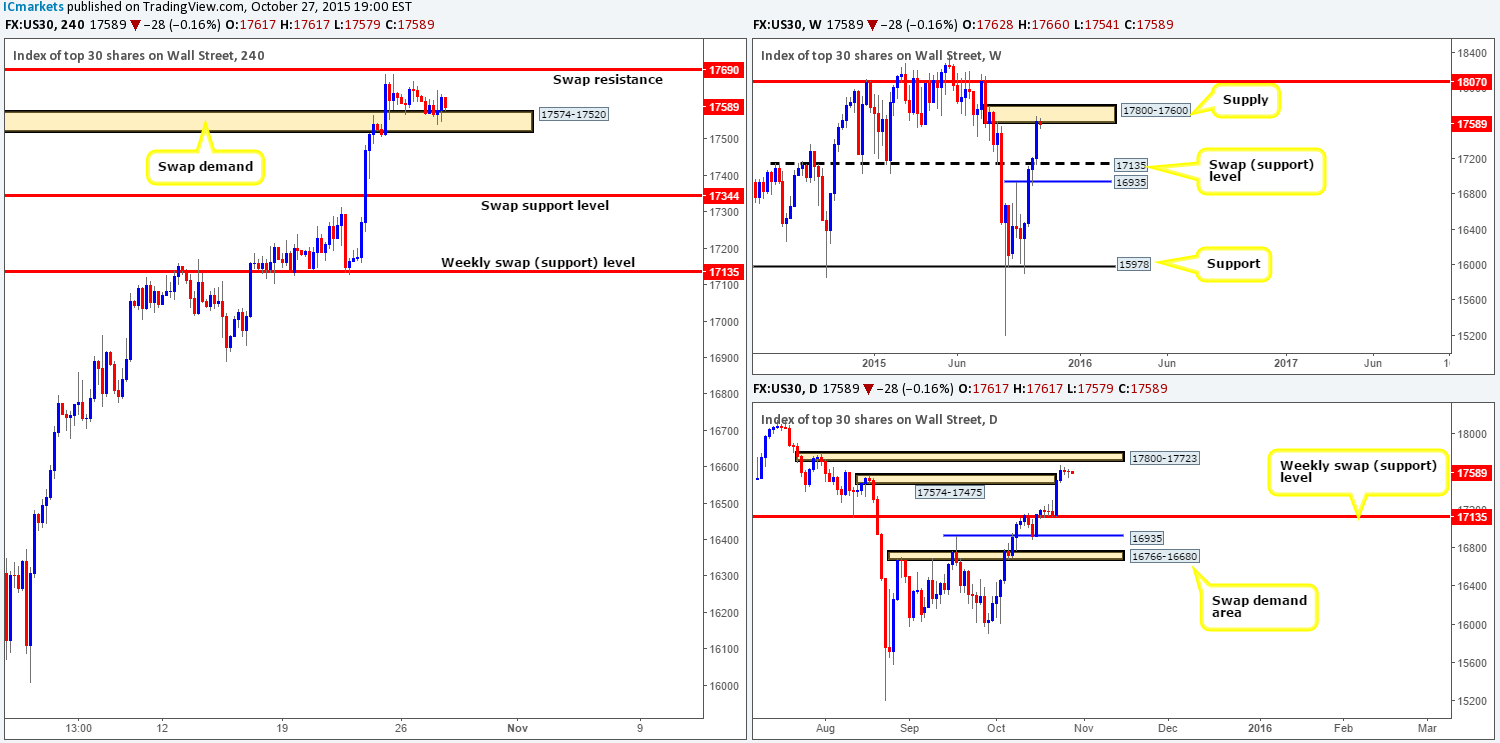
DOW 30: (We still have a LIVE short in the market from 17527 with our stop at 17830 [above weekly supply]).
Once again, the DOW moved very little during the course of yesterday’s sessions as price is still seen meandering within the swap demand zone coming in at 17574-17520. Consequent to this, much of the following analysis will remain similar to the previous.
As we write, weekly action still resides at the underside of supply drawn from 17800-17600, whilst on the daily timeframe; price is seen consolidating just below supply coming in at 17800-17723 (located deep within the aforementioned weekly supply).
Taking all of the above into consideration, here is what we have jotted down so far:
- It is very possible price will attack the 4hr swap (resistance) level at 17690 today seen directly above the aforementioned swap demand zone. However, placing a pending sell order here is very risky indeed. Reason being is that above this hurdle sits the daily supply zone mentioned above at 17800-17723. Therefore, do expect a fakeout above this 4hr level before considering a short!
- In the event that price closes below the 4hr swap demand area at 17574-17520 today, we feel the DOW will likely head lower to at least the swap support level at 17344 (a nice target for any intraday shorts). That being the case, should price retest the underside of this barrier and show some form of lower timeframe selling strength here, we may consider shorting this market, adding to our current position from 17527.
Levels to watch/ live orders:
- Buys: Flat (Stop loss: N/A).
- Sells: 17527 [LIVE] (Stop loss: 17830) 17690 [Tentative – confirmation required] (Stop loss: dependent on where one confirms this level since a fakeout up to daily supply at 17800-17723 is highly possible) watch for bids to be consumed around 17574-17520 and then look to trade any retest seen at this area (confirmation required).
XAU/USD: (Gold)
Working our way from the top down this morning, we can see that weekly price is still hovering above the swap support barrier coming in at 1157.4. Looking at the daily timeframe reveals that Gold has been loitering within a swap demand zone at 1169.8-1154.7 since the market opened this week.
Turning our attention to the 4hr timeframe, it is clear to see that market action has entered into a phase of consolidation fixed between 1168.2/1162.0. A breakout north of this range could force price to challenge the resistance area seen above at 1180.7-1176.9 (located just below daily supply seen at 1187.6-1179.6). Conversely, a push lower places the Quasimodo support base at 1151.7-1154.7 back in the firing range. This is an interesting zone. Not only does it have strong momentum from the base back on the 13th October, it also converges nicely with a swap support level at 1153.7 and is located just below the daily swap (demand) area at 1169.8-1154.7.
Given the above points, price effectively could bounce either way today. Whichever way price breaks, we’d need to see a retest of the consolidation area together with corresponding lower timeframe confirmation for us to consider a position in this market. Targets for a break above or below can be seen in the text above in bold.
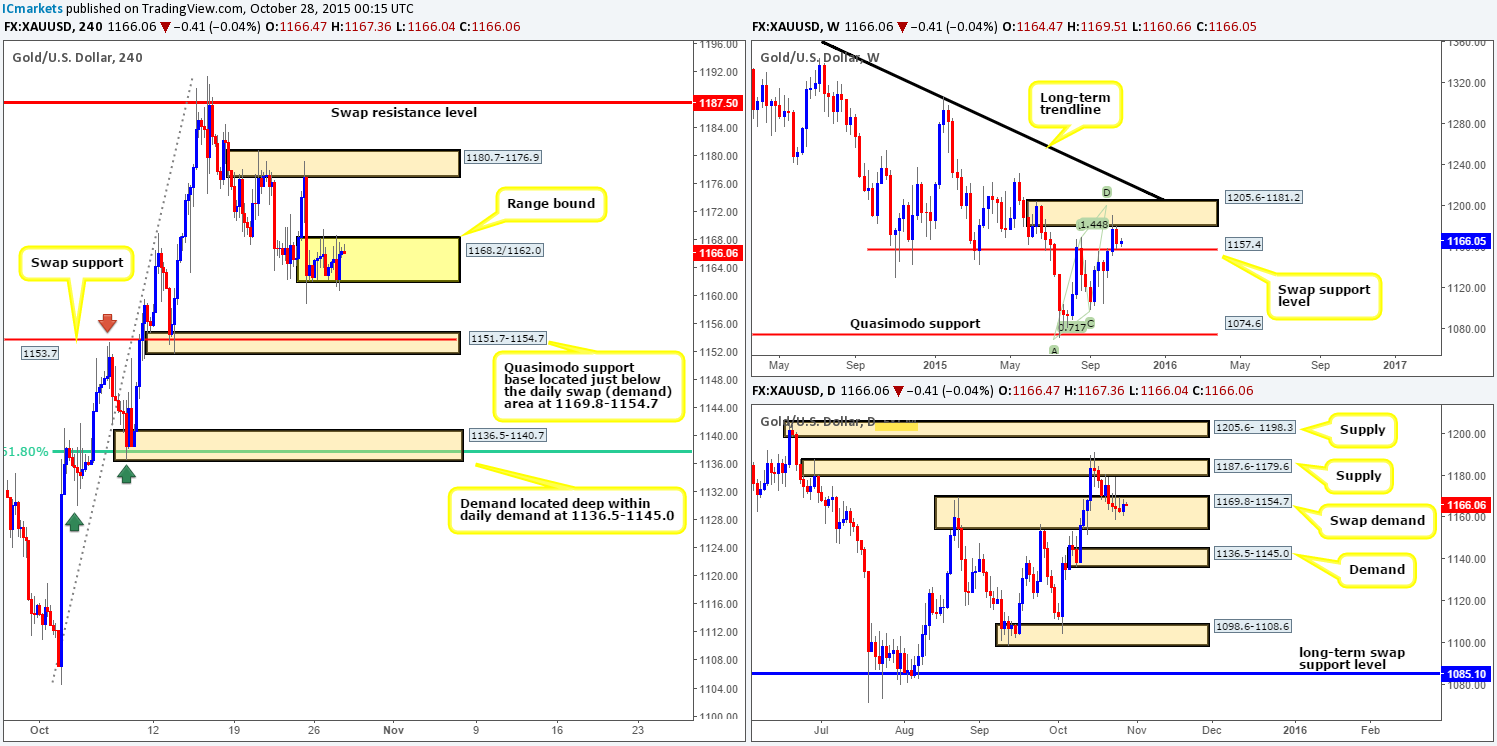
Levels to watch/ live orders:
- Buys: Watch for offers to be consumed at the range resistance 1168.2 and then look to trade any retest seen at this level (confirmation required).
- Sells: Watch for bids to be consumed at the range support 1162.0 and then look to trade any retest seen at this level (confirmation required).


