
Key risk events today:
BoC Rate Statement and Overnight Rate.
(Previous analysis as well as outside sources – italics).
EUR/USD:
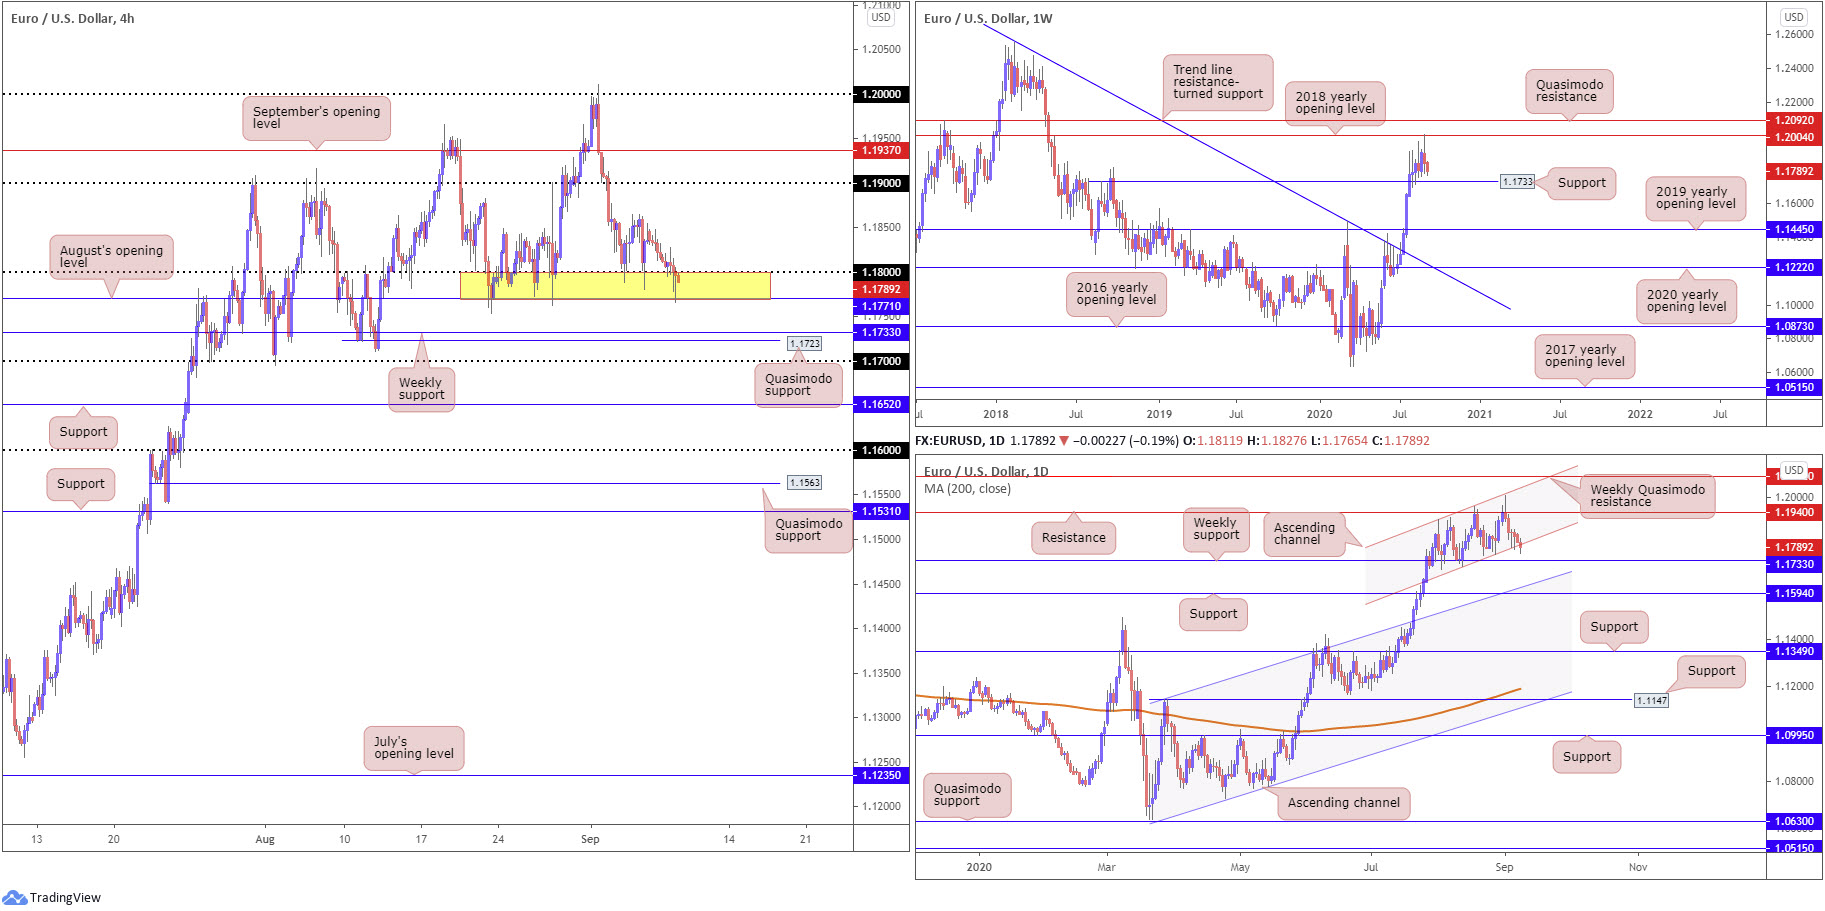
Europe’s single currency eased further against the US dollar on Tuesday, clocking a session low at 1.1765.
Technically, the weekly timeframe forecasts further downside could be in store to 1.1733, a previous Quasimodo support, following last week’s rejection off the 2018 yearly opening value at 1.2004. Beyond 1.1733, however, we could decline as far south as the 2019 yearly opening value at 1.1445.
The daily timeframe somewhat confirms weekly flow at the moment, recently tripping sell-stop liquidity under channel support, extended from the low 1.1711. Beyond 1.1733 on the daily chart, nonetheless, support can be found in the form of a channel resistance-turned support, taken from the high 1.1147, followed by support at 1.1594.
Based on the H4 timeframe, price is seen testing a familiar support area made up of August’s opening level at 1.1771 and the 1.18 handle (yellow). Traders with a focus on multi-timeframe analysis will also acknowledge the aforementioned support area joins together with channel support on the daily timeframe. Gains from the H4 zone will likely pull in the 1.1865 early September peaks, with a break exposing 1.19 and September’s opening level at 1.1937. Brushing aside 1.1771/1.18, on the other hand, has weekly support to contend with at 1.1733 and H4 Quasimodo support at 1.1723.
Areas of consideration:
Although the possibility of reaching for 1.1733 support on the weekly timeframe is still present, the H4 support area at 1.1771/1.18, given the base converges with daily channel support, may still have enough fuel to spark another recovery attempt, targeting the aforementioned resistances highlighted in bold.
Moving through 1.1771/1.18 is unlikely to be enough to entice selling, with most noting the possibility of weekly support at 1.1733 to attract buying.
GBP/USD:
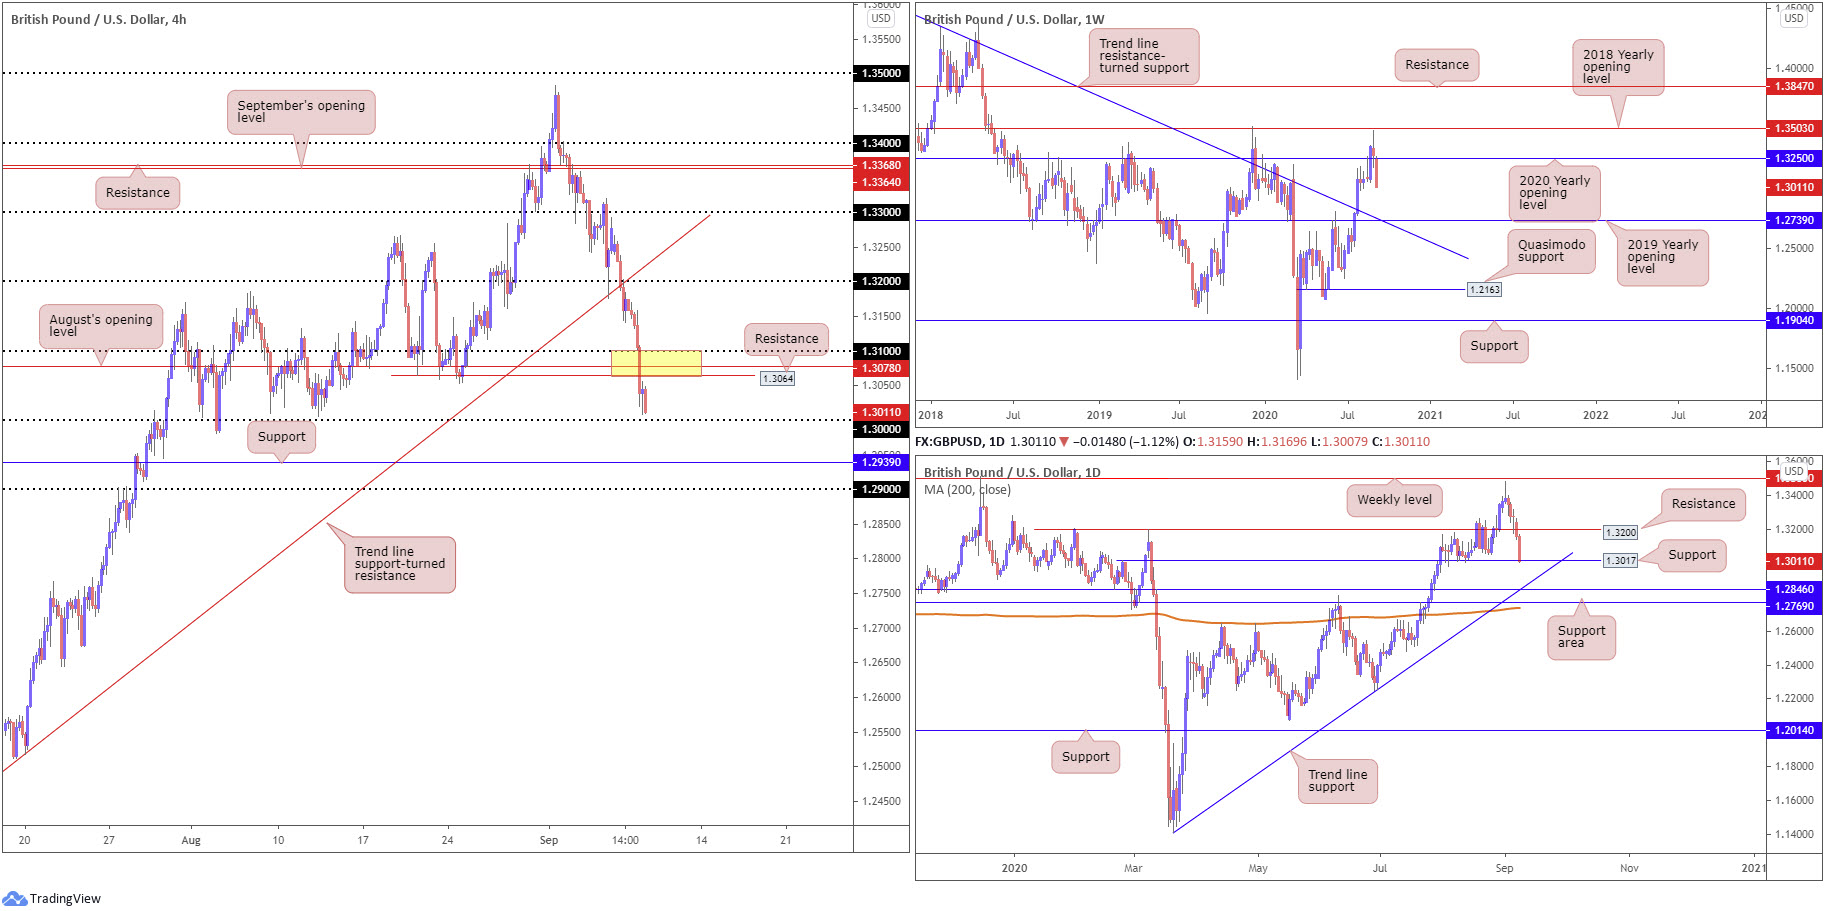
Negative Brexit vibes continued to weigh on the British pound Tuesday, eking out a 150-pip loss against the US dollar.
- Technical studies on the weekly timeframe show that we could perhaps sink to deeper waters this week, with limited support visible until reaching the 2019 yearly opening value at 1.2739, merging closely with trend line resistance-turned support, extended from the high 1.5930.
- Yet, on the daily timeframe, support can be found at 1.3017, a prior Quasimodo resistance level, closely shadowed by trend line support, taken from the low 1.1409, as well as a nearby support area coming in at 1.2769/1.2846 and a 200-day SMA (orange – 1.2737).
- The story on the H4 timeframe has candle action poised to tackle the key figure 1.30 after breaching a number of key supports, including the 1.31 handle. In fact, 1.31, August’s opening level at 1.3078 and a resistance level at 1.3064 (yellow) forms a reasonably tight area of resistance to keep an eye on. Dropping through 1.30 on the H4 scale has support at 1.2939 to target.
Areas of consideration:
Daily support at 1.3017 and the key figure 1.30 on the H4 might form enough of a floor to halt current selling today and offer buyers a chance to participate. However, 1.31/1.3064 (yellow) on the H4 may put up a fight, providing sellers the opportunity to short in line with weekly direction.
Breaching 1.30 sends a strong bearish tone across this market, with intraday players likely to load up and target H4 support at 1.2939.
AUD/USD:
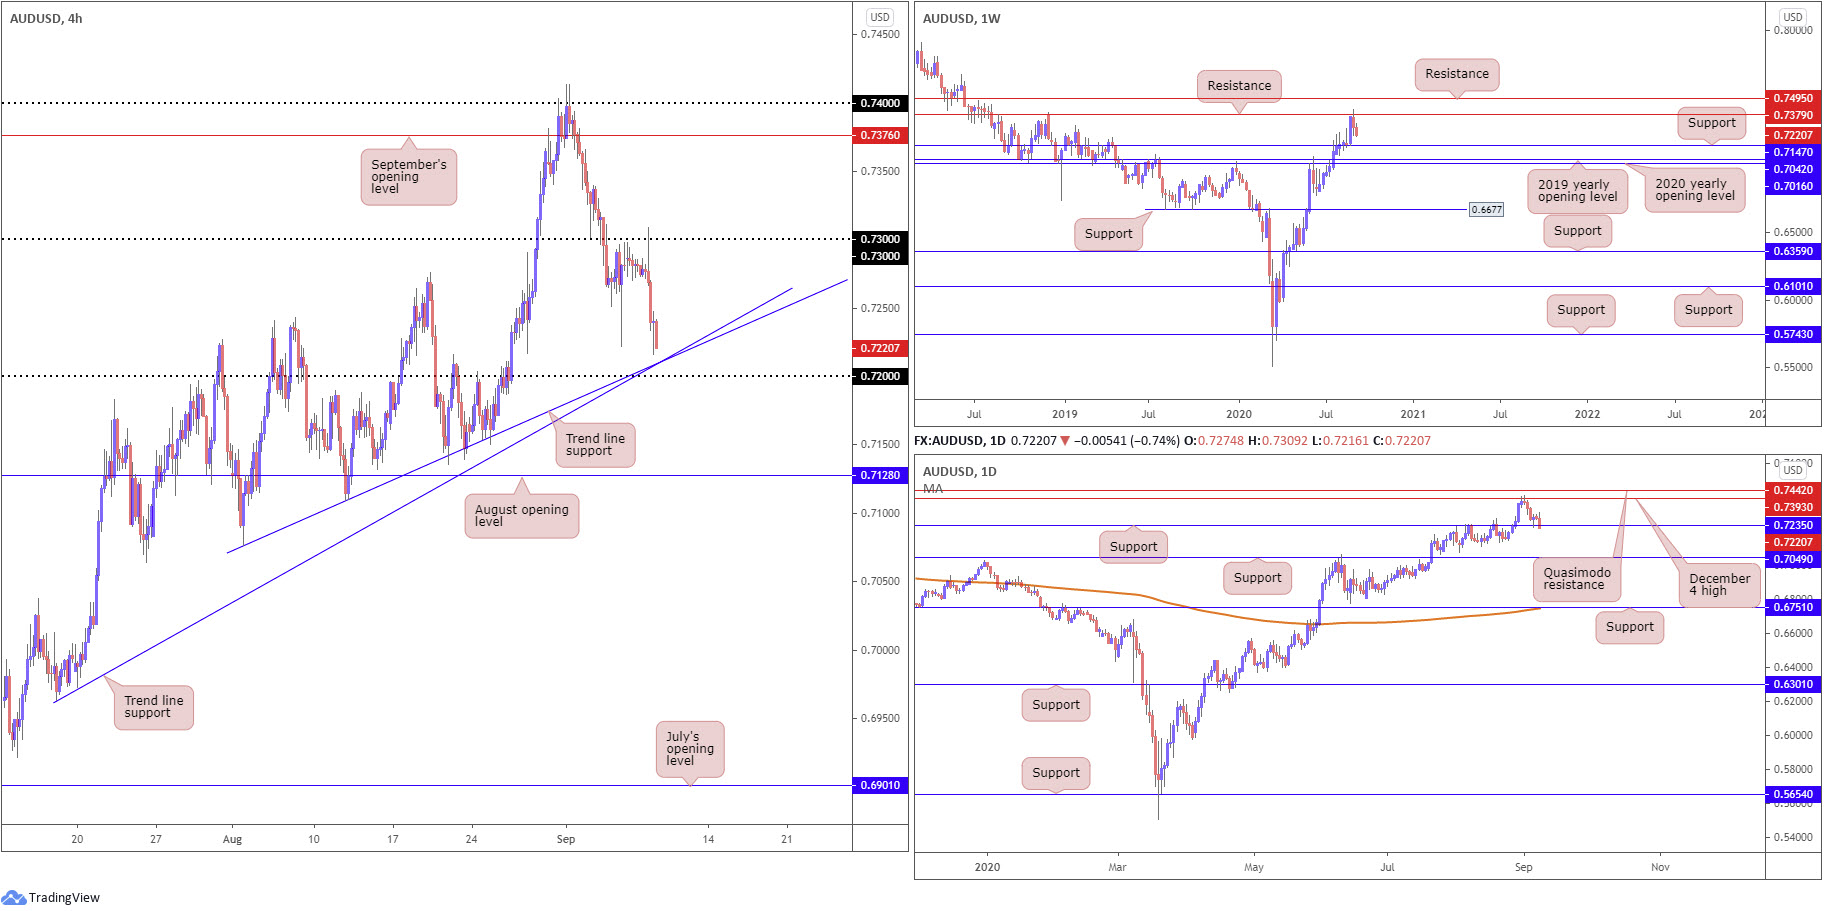
Risk currencies such as the Australian dollar took a tumble Tuesday, erasing 0.8% against the US dollar.
0.73 proved solid resistance on the H4 timeframe, withstanding an early attempt to push higher as we moved into European hours. This produced a shooting star candle pattern, which was followed up with a strong move to lows at 0.7216, consequently revealing two trend line supports (0.7076/0.6963) nearby, followed by 0.72.
From the weekly timeframe, following an animated near-full-bodied push from support at 0.7147, longer-term activity recently crossed swords with resistance at 0.7379 and clocked fresh yearly highs at 0.7413. Although we only printed a moderate reaction from the aforementioned resistance last week, alongside the market trending northbound since early 2020, sellers are seen strengthening their grip, perhaps targeting support at 0.7147.
A closer reading on the daily timeframe shows price recently engaged support at 0.7235, after last week’s rejection from the 0.7393 December 4 high (a level linking up closely with weekly resistance). Should sellers take on lower levels from here, weekly support mentioned above at 0.7147, followed by a possible push for daily support located at 0.7049, could be seen.
Areas of consideration:
The two H4 trendline supports, coupled with the 0.72 handle, could hold price action higher today. Conservative buyers here, however, may seek additional confirmation before pulling the trigger, due to the weekly timeframe indicating follow-through selling towards weekly support at 0.7147. On account of this, a H4 close under 0.72 today may also prompt bearish scenarios, targeting the weekly level at 0.7147 and August’s opening level at 0.7128 on the H4 as initial take-profit zones.
USD/JPY:
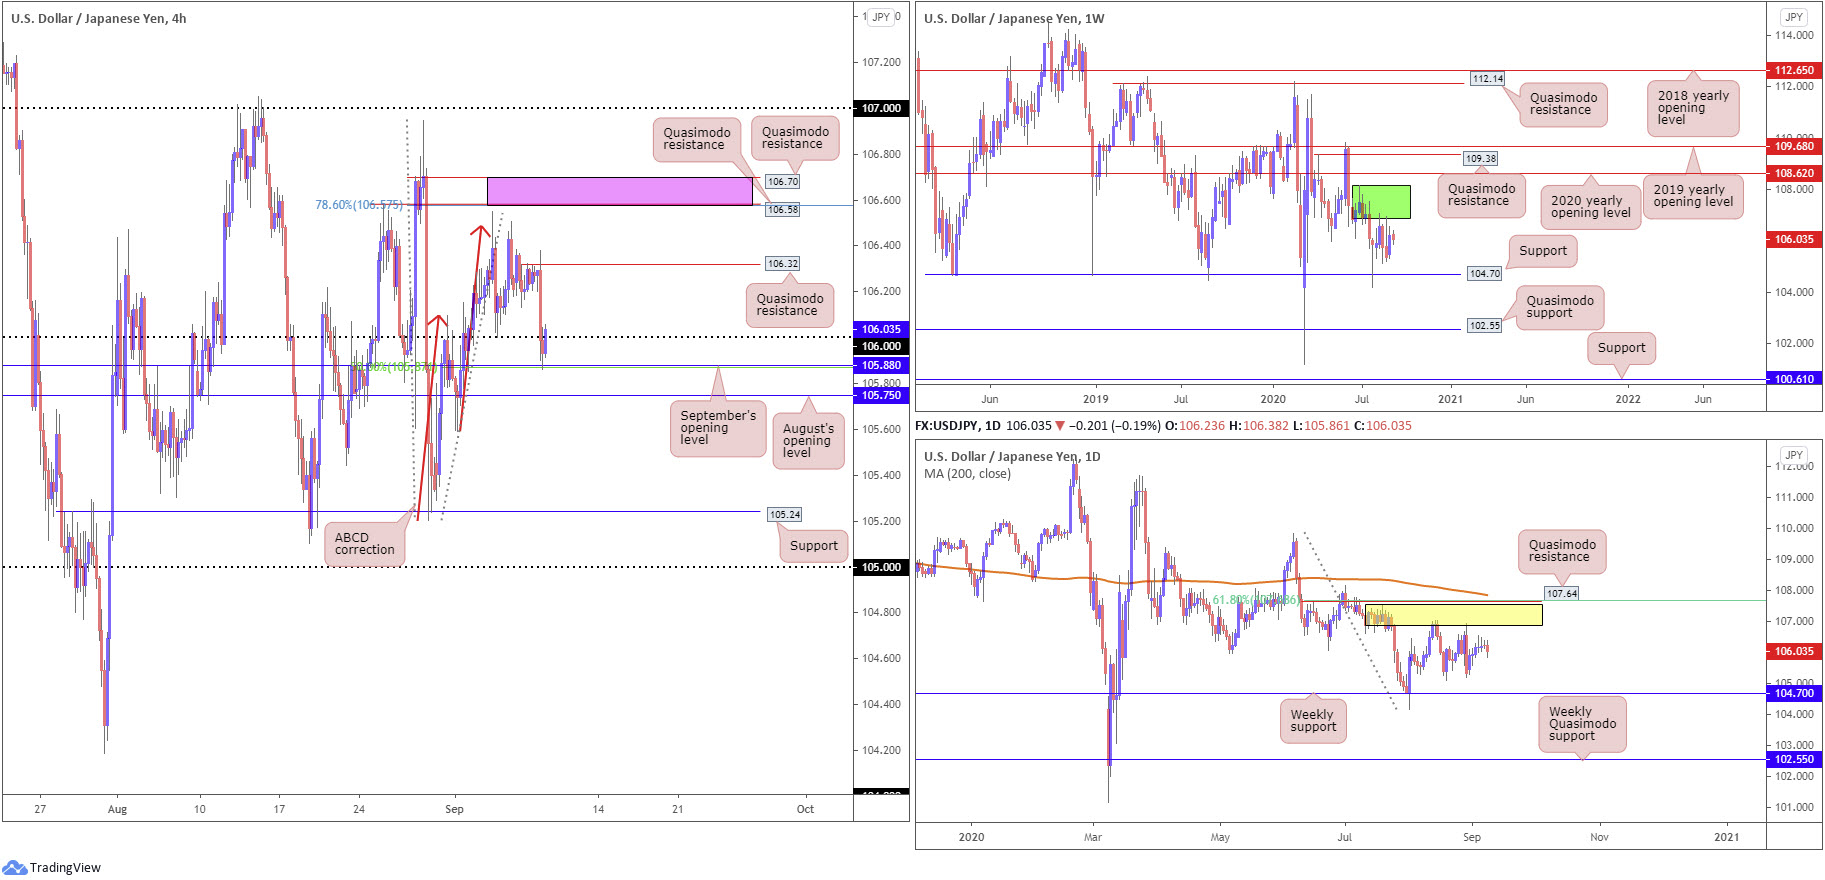
Initial action witnessed USD/JPY carve out a reasonably calm tone during the first half of Tuesday’s session, though heading into US trading the pair unwound strongly amid risk aversion, as US stocks sold off sharply.
This led to the H4 candles whipsawing through 106 into September’s opening level at 105.88 (and a 50% retracement at 105.86). Upside targets from this area fall in at a Quasimodo resistance at 106.32, with a break potentially underlining two Quasimodo formations at 106.58 (merges with 78.6% Fibonacci resistance at 106.57) and 106.70 (pink).
Further afield on the higher timeframes, little has changed from a technical perspective. Consequently, the analysis put forward in Monday’s technical briefing remains valid.
Weekly timeframe:
Snapping a two-week bearish phase, USD/JPY bulls went on the offensive last week and, despite leaving support at 104.70 unchallenged, added nearly 100 pips. Supply remains prominent on the weekly timeframe at 108.16-106.88 (dark green) after price made its way off support at 104.70 at the end of July. Should buyers hold recent upside, the 2020 yearly opening level at 108.62 may eventually enter view, closely tracked by Quasimodo resistance at 109.38.
Daily timeframe:
Supply at 107.55/106.89 (yellow), an area housed within the lower boundary of weekly supply mentioned above at 108.16-106.88, has proved a tough nut to crack on the daily timeframe. Downside from current price could target weekly support underlined above at 104.70. In the event buyers climb, Quasimodo resistance at 107.64 might enter play, reinforced by a 61.8% Fibonacci retracement ratio at 107.68 and 200-day SMA (orange – 107.85).
Areas of consideration:
The recent whipsaw through 106 to 105.88 likely caught a lot of intraday traders out – those attempting to fade the round number and those who reached for bearish breakout strategies south of the round number. A H4 close above 106, although this boasts little confluence from the higher timeframes, could have buyers try for at least H4 Quasimodo resistance from 106.32, and with a little enthusiasm possibly the two H4 Quasimodo resistances at 106.70/106.58.
USD/CAD:
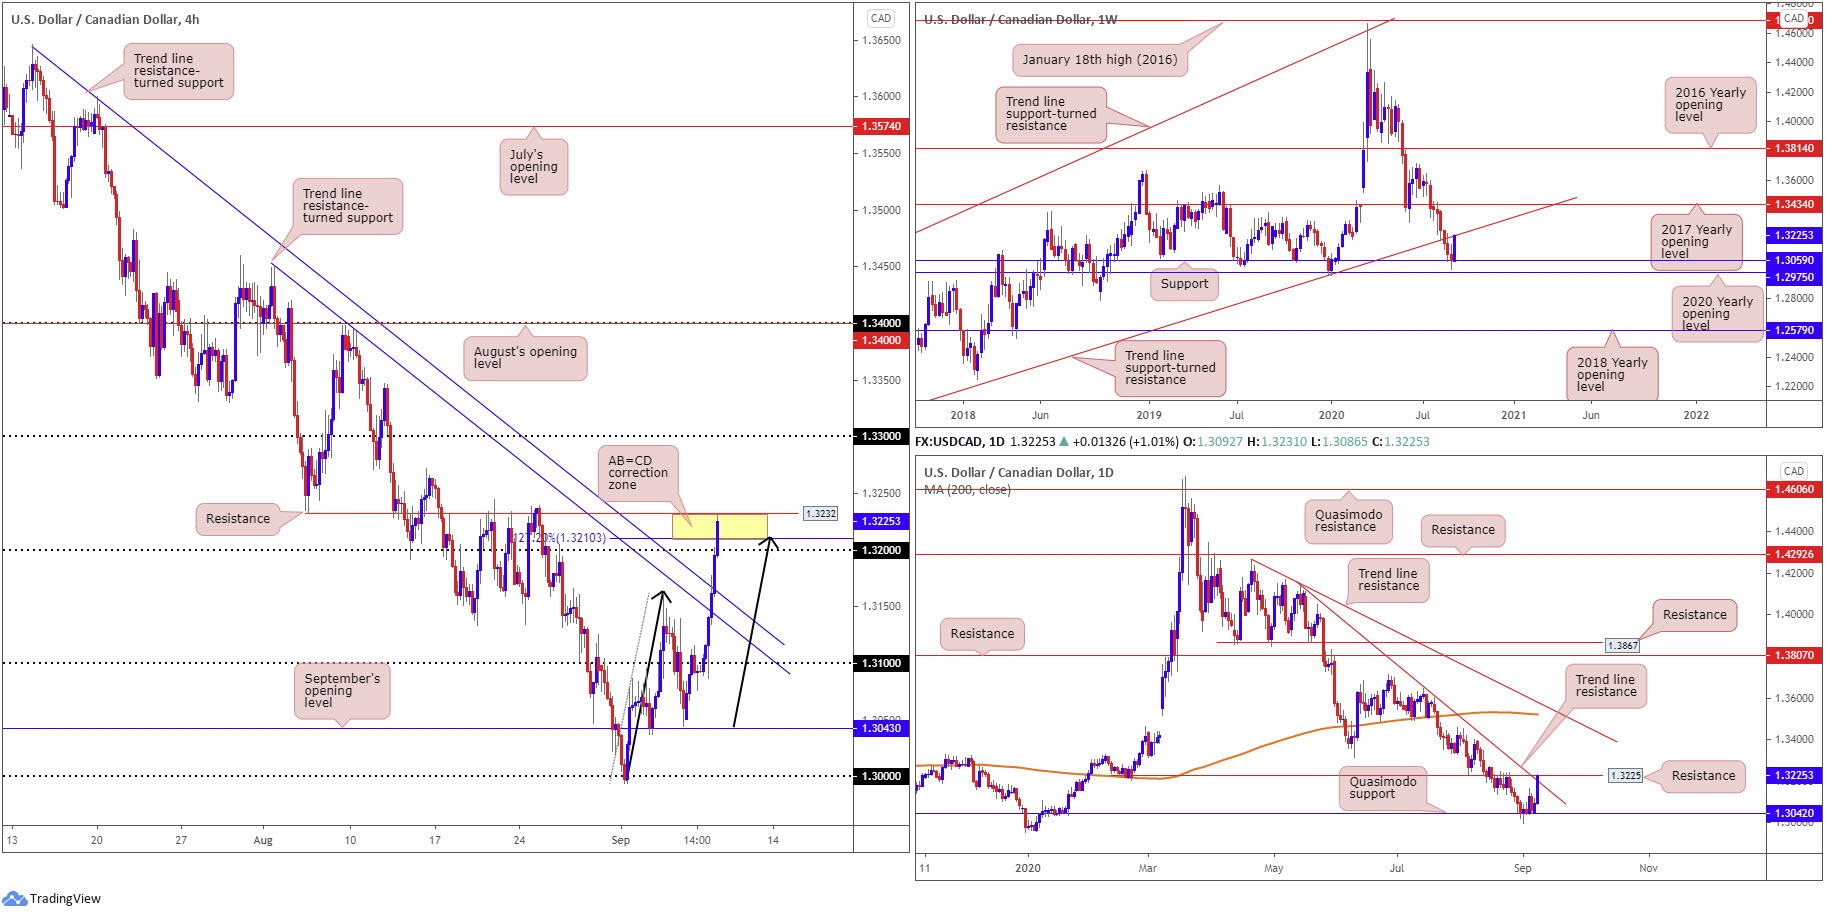
USD/CAD concluded Tuesday sharply higher, eking out a 1% gain as the buck explored higher levels amid risk aversion.
Following a swift 1.31 retest, H4 overthrew two trend line resistances, from 1.3646 and 1.3451, and made contact with a significant area of resistance above the 1.32 handle, specifically an AB=CD correction zone (made up of H4 resistance at 1.3232, a 127.2% Fibonacci extension point at 1.3210 and the AB=CD correction [black arrows]).
From the higher timeframes, we also trade from resistances at the moment. On the weekly timeframe, trend line support-turned resistance, taken from the low 1.2061, is in play. Coming from the daily timeframe, resistance at 1.3225 (a prior Quasimodo support) along with a trend line resistance, taken from the high 1.4140, is also in play.
Areas of consideration:
Keeping things simple this morning, the H4 AB=CD correction zone (coupled with buy-stop liquidity taken from above 1.32), as well as the higher timeframe resistances, are likely to interest sellers today.
Given the strength of the recent up move, nevertheless, sellers might be nervous taking shorts at current price. Conservative players, therefore, may opt to wait and see if H4 can close back under 1.32 before taking action, targeting the recently broken H4 trend line resistances as the initial port of call.
USD/CHF:
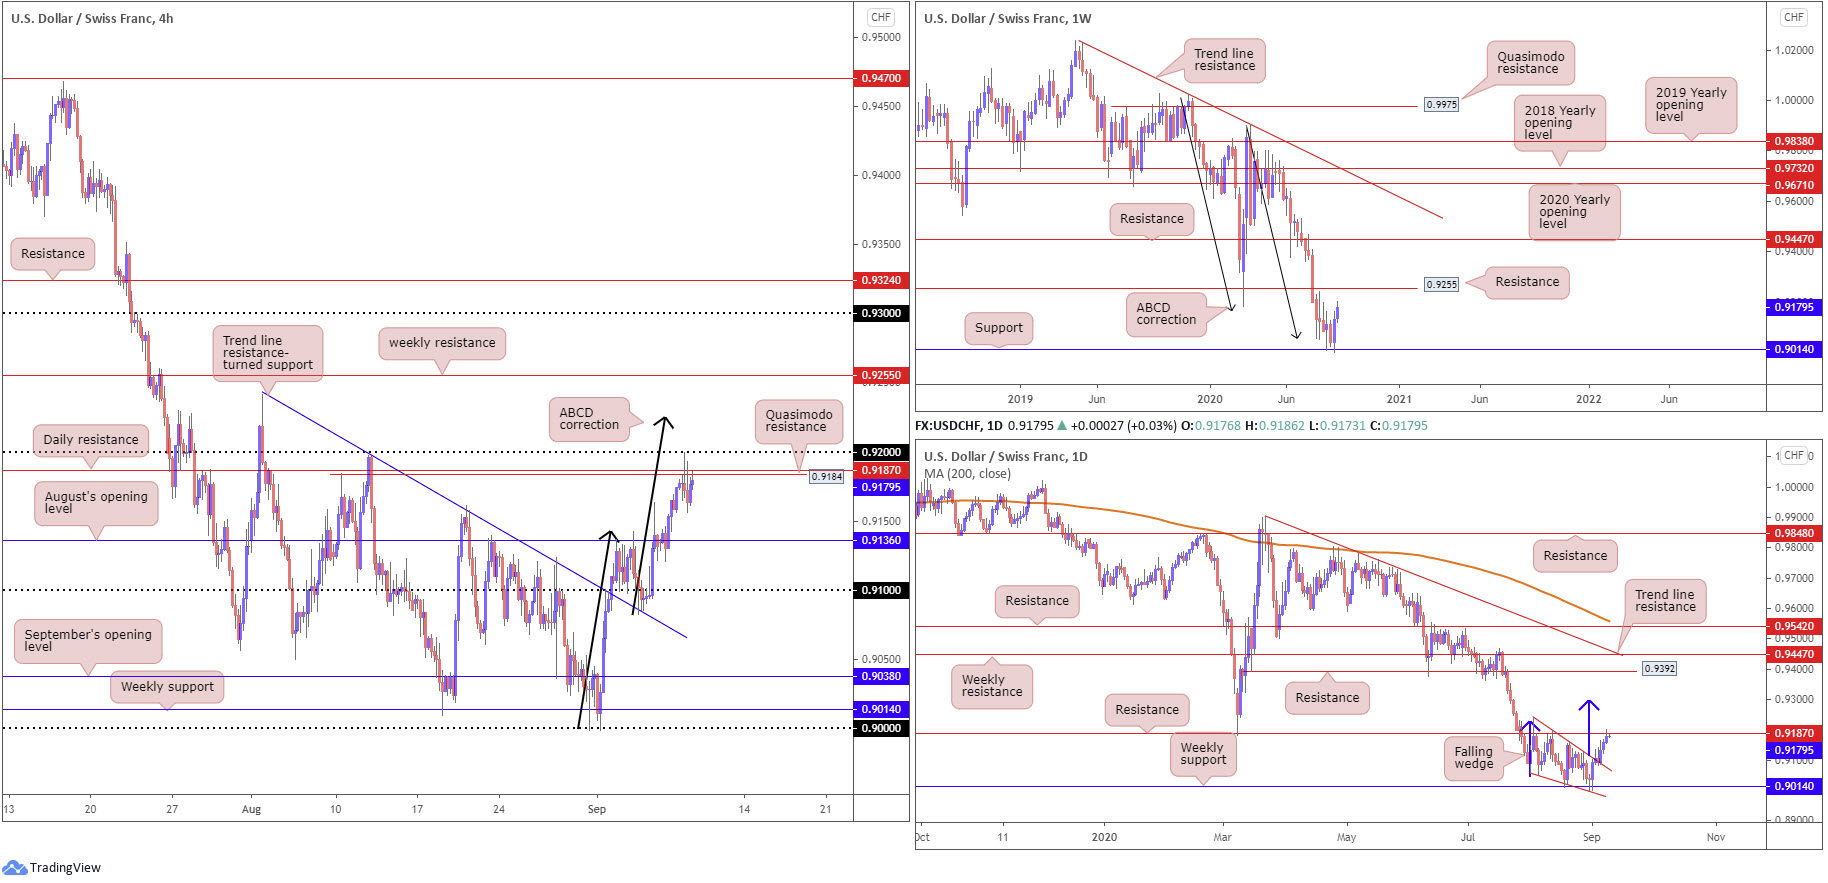
Recording a third consecutive daily gain Tuesday, strengthened amid a healthy USD bid across the board on risk aversion, USD/CHF connected with 0.92 on the H4, along with daily resistance priced in at 0.9187 and H4 Quasimodo resistance at 0.9184. Traders will also likely acknowledge a potential H4 ABCD correction above 0.92 at 0.9224 (black arrows), followed closely by weekly resistance at 0.9255.
The weekly timeframe reveals the pair recently rebounded from support at 0.9014, gleaning additional impetus from ABCD support at 0.9051 (black arrows). According to technical studies, continued upside targets resistance mentioned above at 0.9255, a previous Quasimodo support level.
The key observation on the daily timeframe is the recently penetrated falling wedge pattern pencilled in from the high 0.9241 and a low of 0.9056. In addition, daily price also shook hands with resistance at 0.9187.
Areas of consideration:
The test of daily resistance at 0.9187 likely had a number of buyers (those who bought the breakout above the daily falling wedge, and also those who entered long at the retest [seen clearly on the H4 as the trend line resistance represents the upper boundary of the daily wedge]) liquidate partial profits.
Above 0.92 on the H4, traders’ crosshairs are perhaps fixed on the H4 ABCD correction point around 0.9224, followed by weekly resistance at 0.9255 and then the 0.93 handle, which aligns with the daily wedge take-profit target (blue arrows).
Dow Jones Industrial Average:
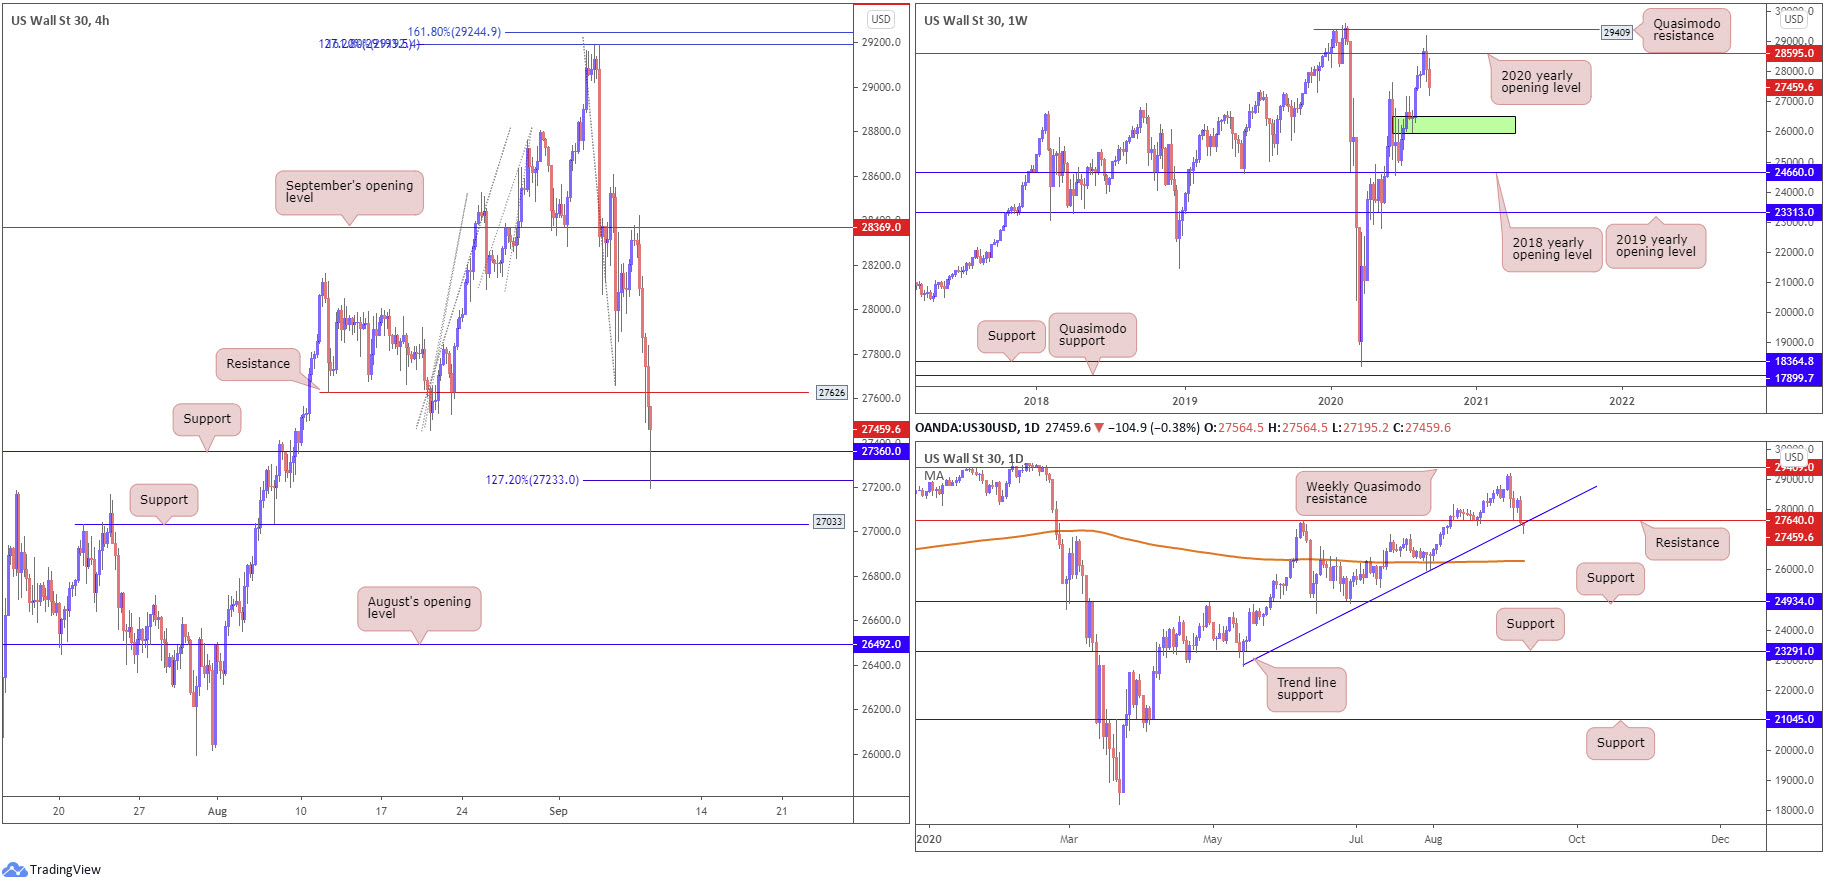
US equity benchmarks plunged Tuesday, weighed by the sell-off in major technology stocks. The Dow Jones Industrial Average declined 632.42 points, or 2.25%; the S&P 500 fell 95.12 points, or 2.78% and the tech-heavy Nasdaq 100 traded lower by 553.87 points, or 4.77%.
The weekly timeframe reveals price movement failed to sustain gains north of the 2020 yearly opening value at 28595 (sited just under Quasimodo resistance at 29409). Further selling could retreat as far south as demand (green) at 25916-26523.
From the daily timeframe, price action modestly crossed through support at 27640 yesterday and is, as we write, attempting to topple trend line support, taken from the low 22803. If a break lower comes to pass, this could bring light to the 200-day SMA (orange – 26292).
The H4 timeframe found support from a 127.2% Fibonacci extension point at 27233, placed south of support at 27360. The recovery seen from here so far could retest 27626 resistance, a recently engulfed Quasimodo support level.
Areas of consideration:
H4 resistance stationed at 27626 along with daily resistance at 27640, technically, represents a reasonably formidable ceiling to contend with today. A retest of this range, therefore, may entice bearish themes and potentially force a daily close under the current daily trend line support.
Printing a H4 close above 27640, however, may tempt bullish scenarios, with a relatively clear run visible back to September’s opening level at 28369.
XAU/USD (GOLD):
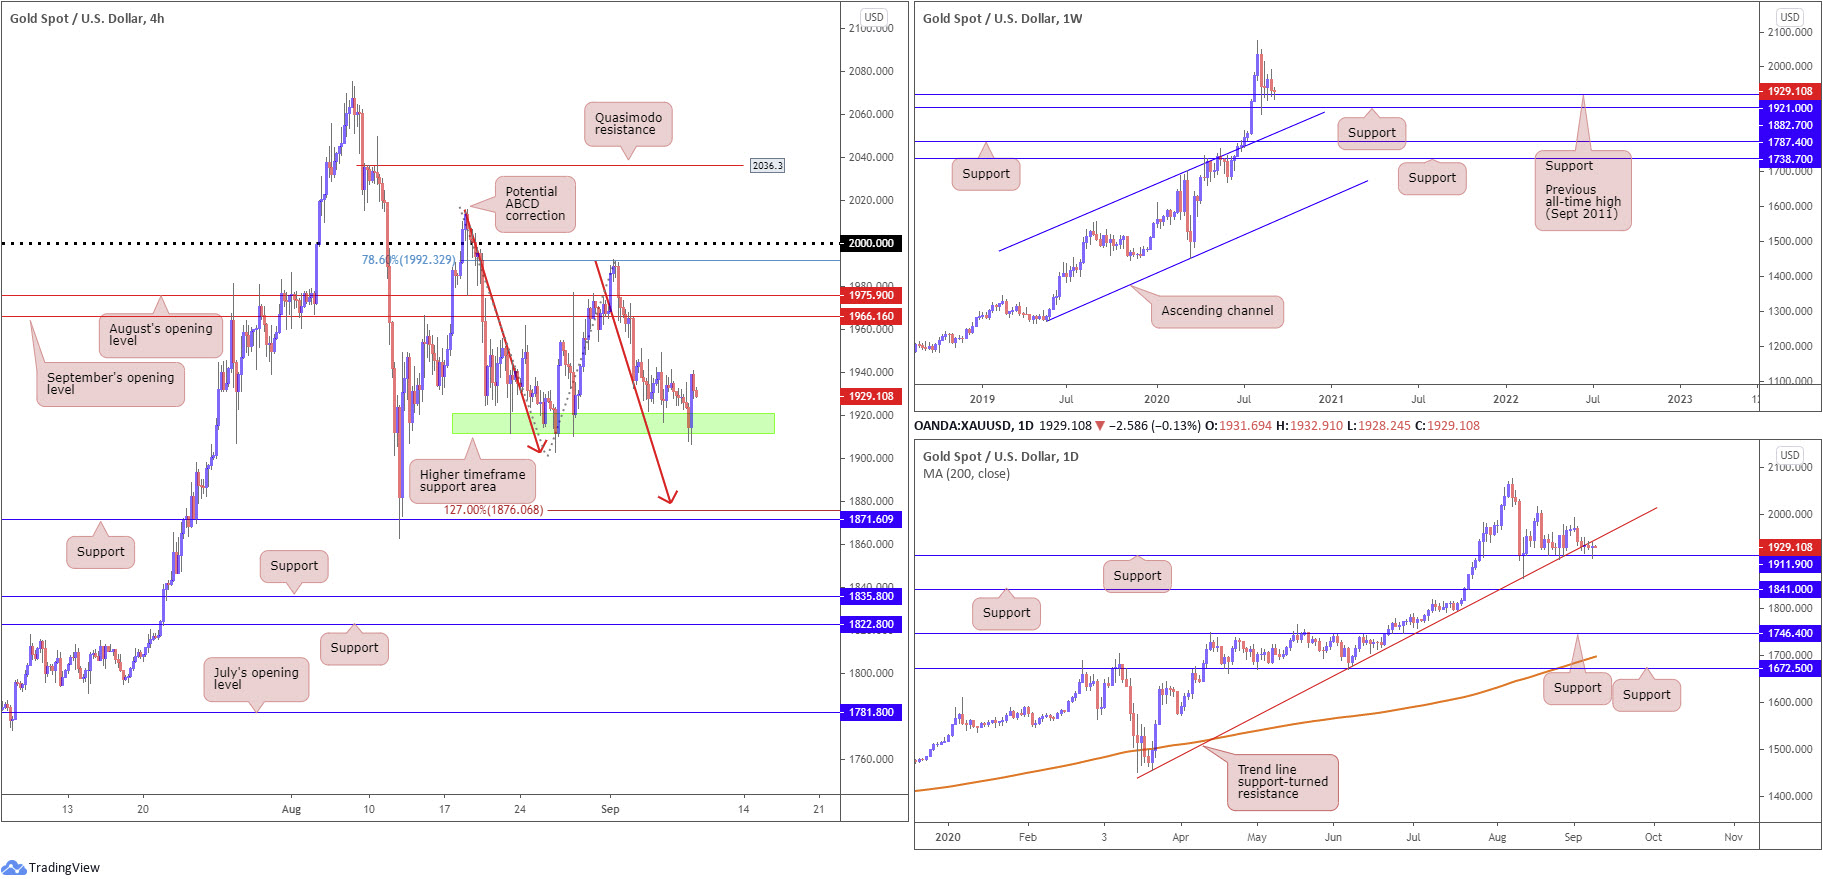
Bullion finished modestly higher against the greenback on Tuesday, significantly off worst levels.
Support at $1,921.00, the previous major all-time high (September 2011), remains in play on the weekly timeframe, located ahead of support at $1,882.70. With the current trend trekking north since 2016, the combination of $1,882.70 and $1,921.00 may still be enough to encourage additional buying, with most targeting all-time peaks at $2,075.28 as the initial point. Failure to hold gains could see weekly channel resistance-turned support, etched from the high $1,703.28, enter view.
Price movement on the daily timeframe shows the unit challenged support at $1,911.90 yesterday, though recovery attempts could be hindered by trend line support-turned resistance, taken from the low $1,455.32. Breaking lower has support at $1,841.00 to target, whereas exploring higher ground might have the $1,992.56 September 1 high denote possible resistance, with a break pushing for the $2,015.72 August 18 high.
H4 has been circling a familiar area of higher timeframe support at $1,911.90-$1,921.00 (green) since late last week. What’s technically appealing here is the recent H4 outside bullish candle formed, suggesting buyers may be ready to take things higher. Areas to keep a tab on should an advance materialise are September’s opening value at $1,966.16, and August’s opening value coming in at $1,975.90. Another possibility on the H4 timeframe, assuming we overrun higher timeframe supports, is the completion of an ABCD correction (red arrows) at $1,879.94, with a BC projection standing at (1.27) $1,876.06 (given leg C terminated at 78.6%), ahead of support coming in at $1,871.60.
Areas of consideration:
Overall, this remains a buyers’ market, according to the current trend – higher since bottoming in 2016.
The H4 bullish candle established from the $1,911.90-$1,921.00 higher timeframe support area may draw in buyers today and target $1,966.16/$1,975.90. The only thing likely to put traders off from entering long at this region is the daily trend line resistance, yet with the trend firmly pointing north as well as weekly support in motion, the odds favour bulls here.
The accuracy, completeness and timeliness of the information contained on this site cannot be guaranteed. IC Markets does not warranty, guarantee or make any representations, or assume any liability regarding financial results based on the use of the information in the site.
News, views, opinions, recommendations and other information obtained from sources outside of www.icmarkets.com.au, used in this site are believed to be reliable, but we cannot guarantee their accuracy or completeness. All such information is subject to change at any time without notice. IC Markets assumes no responsibility for the content of any linked site.
The fact that such links may exist does not indicate approval or endorsement of any material contained on any linked site. IC Markets is not liable for any harm caused by the transmission, through accessing the services or information on this site, of a computer virus, or other computer code or programming device that might be used to access, delete, damage, disable, disrupt or otherwise impede in any manner, the operation of the site or of any user’s software, hardware, data or property.


