
A note on lower timeframe confirming price action…
Waiting for lower timeframe confirmation is our main tool to confirm strength within higher timeframe zones, and has really been the key to our trading success. It takes a little time to understand the subtle nuances, however, as each trade is never the same, but once you master the rhythm so to speak, you will be saved from countless unnecessary losing trades. The following is a list of what we look for:
- A break/retest of supply or demand dependent on which way you’re trading.
- A trendline break/retest.
- Buying/selling tails – essentially we look for a cluster of very obvious spikes off of lower timeframe support and resistance levels within the higher timeframe zone.
- Candlestick patterns. We tend to only stick with pin bars and engulfing bars as these have proven to be the most effective.
For us, lower timeframe confirmation starts on the M15 and finishes up on the H1, since most of our higher timeframe areas begin with the H4. Stops usually placed 5-10 pips beyond your confirming structures.
EUR/USD:
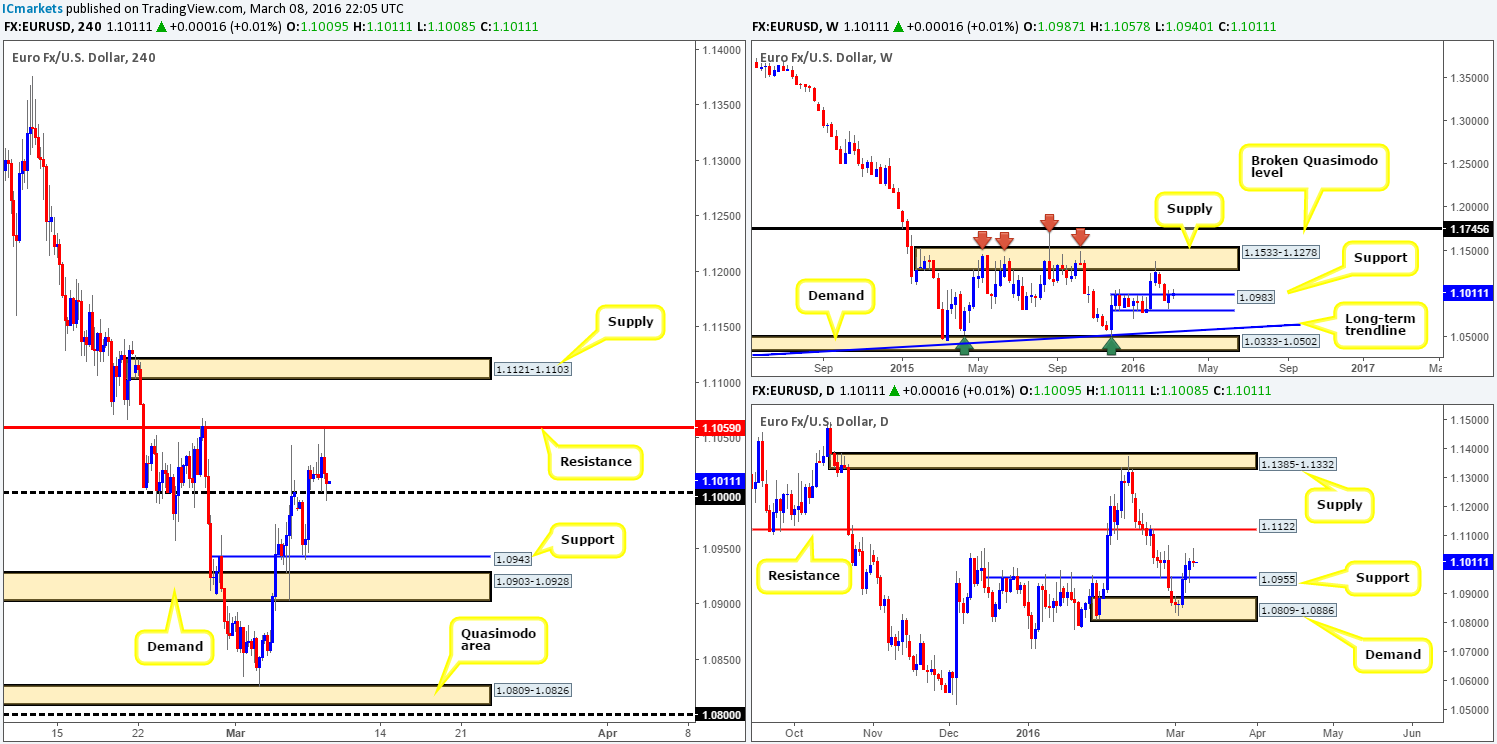
In our previous report (http://www.icmarkets.com/blog/tuesday-8th-march-daily-technical-outlook-and-review/), we mentioned to watch for price to retest the 1.1000 figure for a confirmed long trade. As we can all see, price did indeed retest this level beautifully and shortly after came within two pips of hitting the first take-profit level – a H4 resistance at 1.1059. Well done to any of our readers who managed to bag some pips here!
Going forward, neither a long nor short seems attractive at this time. Granted, one could look to trade long from 1.1000 again, but seeing as price came so very close to hitting the first target already (see above), we personally lack confidence in this level now.
In the event that 1.1000 is taken out today, however, price has the H4 support at 1.0943 to target. For us to trade this move, a break below and confirmed retest would need to take place. While 1.0943 is the H4 target, daily structure shows support coming in higher at 1.0955, with weekly structure support seen above this at 1.0983; therefore traders would need an incredibly tight stop loss to make this short trade worthwhile from a risk/reward perspective.
Conversely, a push above the current H4 resistance places H4 supply at 1.1121-1.1103 in the firing range. Here we can also see that the distance to the first area of trouble from our entry (retest of the broken level) is very small, and like above a very tight stop loss would be needed to trade this move.
Personally we do not like this pair’s structure right now, leaving us little choice but to remain flat going into today’s sessions.
Levels to watch/live orders:
- Buys: Flat (Stop loss: N/A).
- Sells: Flat (Stop loss: N/A).
GBP/USD:
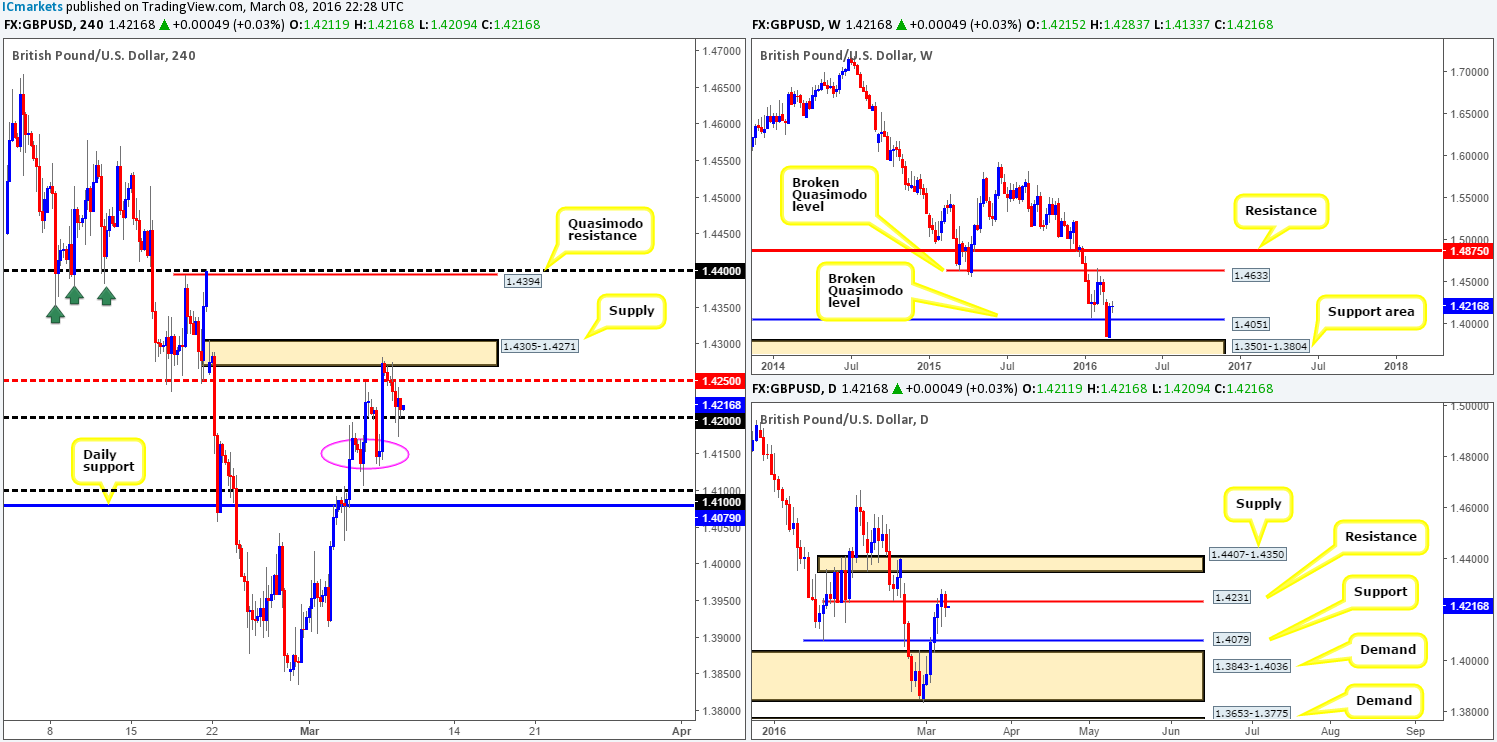
Buying appears to have come to a pause for the first time in six days on this pair, consequently printing a bearish inside pattern on the daily chart. The catalyst for this down move, at least technically, can be seen from the H4 chart in the form of a supply zone penciled in at 1.4305-1.4271. We have to be honest here, we were not expecting price to sell-off quite so much since at that time Cable was trading above daily support (which is now resistance) at 1.4231.
Similar to the EUR/USD chart above, we’re not too keen on trading this market today. Here’s why: right now, price is seen teasing the 1.4200 handle which would be a difficult level to buy from since directly above lurks daily resistance at 1.4231, followed closely by mid-level resistance at 1.4250. Conversely, a cut through bids at 1.4200 and subsequent retest would be just as difficult to trade in our opinion, as there is a lot of wood (support) to chop through around the 1.4150 region (pink circle), before price is free to challenge daily support at 1.4079.
Levels to watch/live orders:
- Buys: Flat (Stop loss: N/A).
- Sells: Flat (Stop loss: N/A).
AUD/USD:
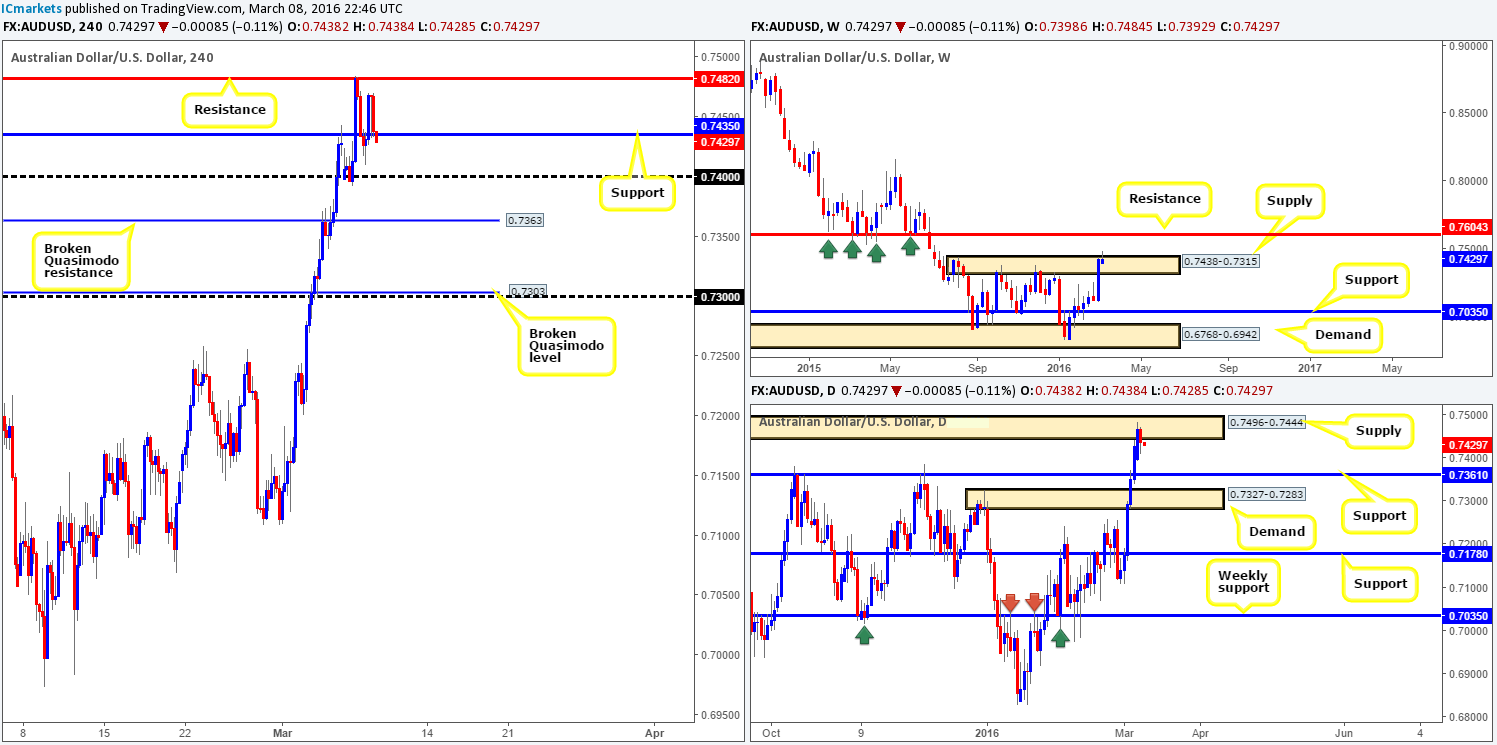
Following the recent break above weekly supply given at 0.7438-0.7315, price is now trading back within the confines of this area giving the impression that this could be a fakeout to drive lower. However, we’d really like to see this weekly candle close up shop before making any further judgment on this timeframe.
Jumping down to the daily chart, supply at 0.7496-0.7444 (positioned above the aforementioned weekly supply) has so far held firm, resulting in yesterday’s session printing a bearish inside candle pattern. On the assumption that further selling is seen today, the next target support to keep a tab on falls in at 0.7361.
Over on the H4 chart, however, the buyers and sellers are currently seen battling for position around support at 0.7435. Directly beneath this barrier sits the 0.7400 handle which held price beautifully on Monday, so a bounce from here is likely. Given this, and the fact that below 0.7400 there’s also a broken Quasimodo line drawn from 0.7363, we unfortunately see little opportunity to enter short in-line with higher-timeframe expectations.
Should price reach 0.7363 today, this level is significant since it converges with daily support mentioned above 0.7361 so do keep a tab on lower timeframe price action around this number in the event of contact.
Levels to watch/live orders:
- Buys: 0.7363 [Tentative – confirmation required] (Stop loss: dependent on where one confirms this level).
- Sells: Flat (Stop loss: N/A).
USD/JPY:
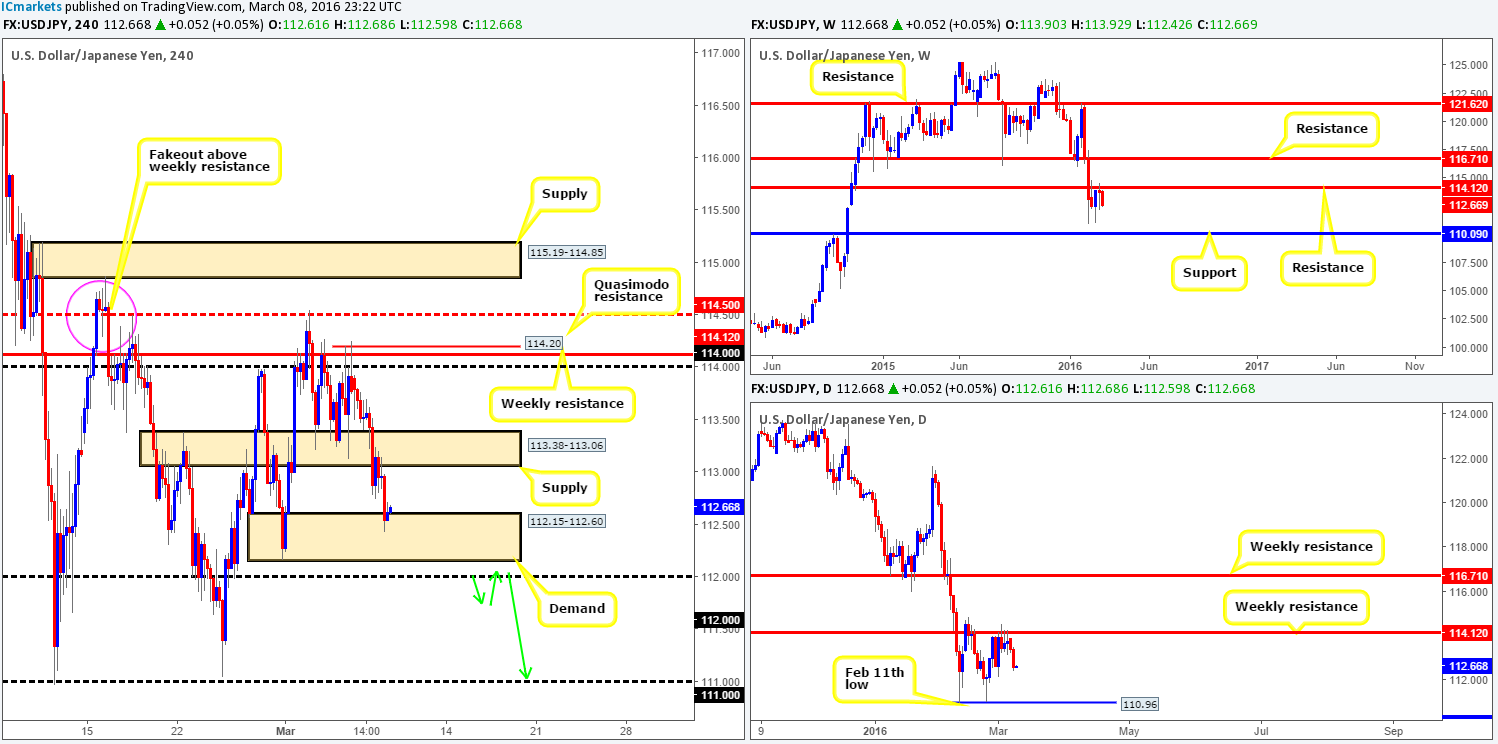
The USD/JPY tumbled lower for the second-straight day yesterday weighed on heavily by the fact that weekly resistance at 114.12 continues to remain in the limelight. From the weekly viewpoint, the next downside target can be seen at 110.09 – a long-term support. Nevertheless, looking at the daily chart, it’s clear that in order for the bears to reach this weekly target, the Feb 11th low (double-bottom support) at 110.96 has to be consumed beforehand.
Across on the H4 chart, nonetheless, demand at 113.38-113.06 was taken out during yesterday’s sessions and shortly after retested as supply before driving into the jaws of a H4 demand chalked up at 112.15-112.60. For those who read our previous report (http://www.icmarkets.com/blog/tuesday-8th-march-daily-technical-outlook-and-review/), this was actually a noted setup to watch for so well done to any of our readers who took advantage of this intraday move!
Going into today’s sessions, it is likely that this pair will consolidate between the two aforementioned H4 areas before continuing lower to test the 112.00 handle, which is the number that we’re interested in! A break below this level, as you can probably see, opens up the path south down to the 111.00 figure which merges with the daily low (Feb 11) mentioned above at 110.96. Therefore, a break below and confirmed retest of 112.00 would allow us to jump in short here and ride this train south as per the green arrows.
Levels to watch/live orders:
- Buys: Flat (Stop loss: N/A).
- Sells: Watch for price to consume the 112.00 level and look to trade any retest seen thereafter (lower timeframe confirmation required).
USD/CAD:
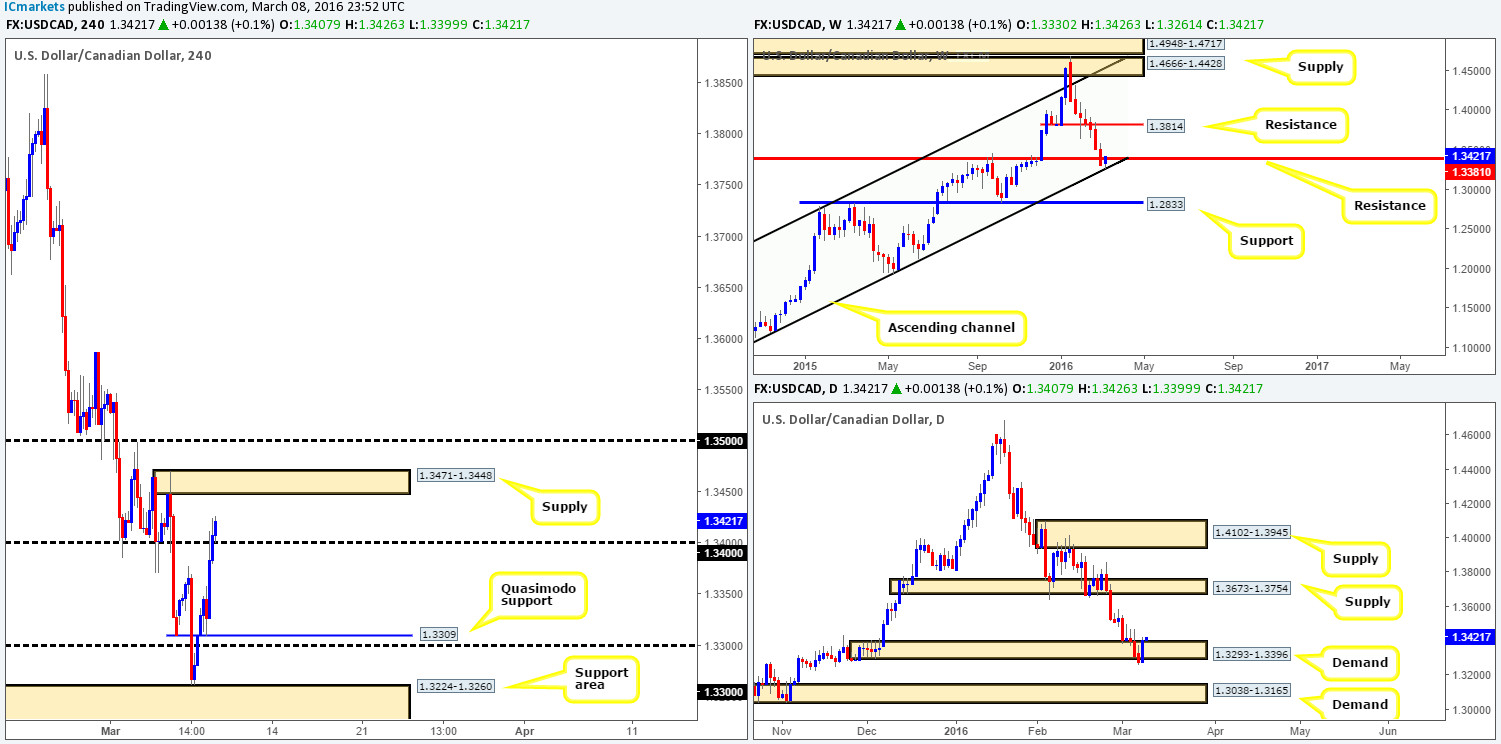
Reporting from the weekly chart this morning, one can see that weekly buyers are currently defending the long-term ascending channel support line extended from the low 1.0620. Before we’re confident that the path north is clear up to resistance at 1.3814, however, price will need to CLOSE above near-term resistance seen at 1.3381. Breaking into the daily chart, demand at 1.3293-1.3396 (despite price closing below this area) appears to be holding ground for the time being. In the event that this continues, the next obvious area of supply can be seen at 1.3673-1.3754.
Looking over to the H4 action, price recently took out 1.3400 and shortly after retested it as support, consequently opening up the runway north towards H4 supply seen at 1.3471-1.3448. Right now, at least from a higher-timeframe perspective (see above), longs may, and we emphasize the word may here, be the best trades to take. However, with the aforementioned supply lurking just above, it’s unlikely we’ll be taking any long positions today. By the same token, shorting from this supply is tricky not only due to the higher-timeframe picture but also due to the 1.3500 handle floating just above which has ‘fakeout’ written all over it!
In light of the above points, our team has decided to take a back seat on this one today and reassess following the day’s close.
Levels to watch/live orders:
- Buys: Flat (Stop loss: N/A).
- Sells: Flat (Stop loss: N/A).
USD/CHF:
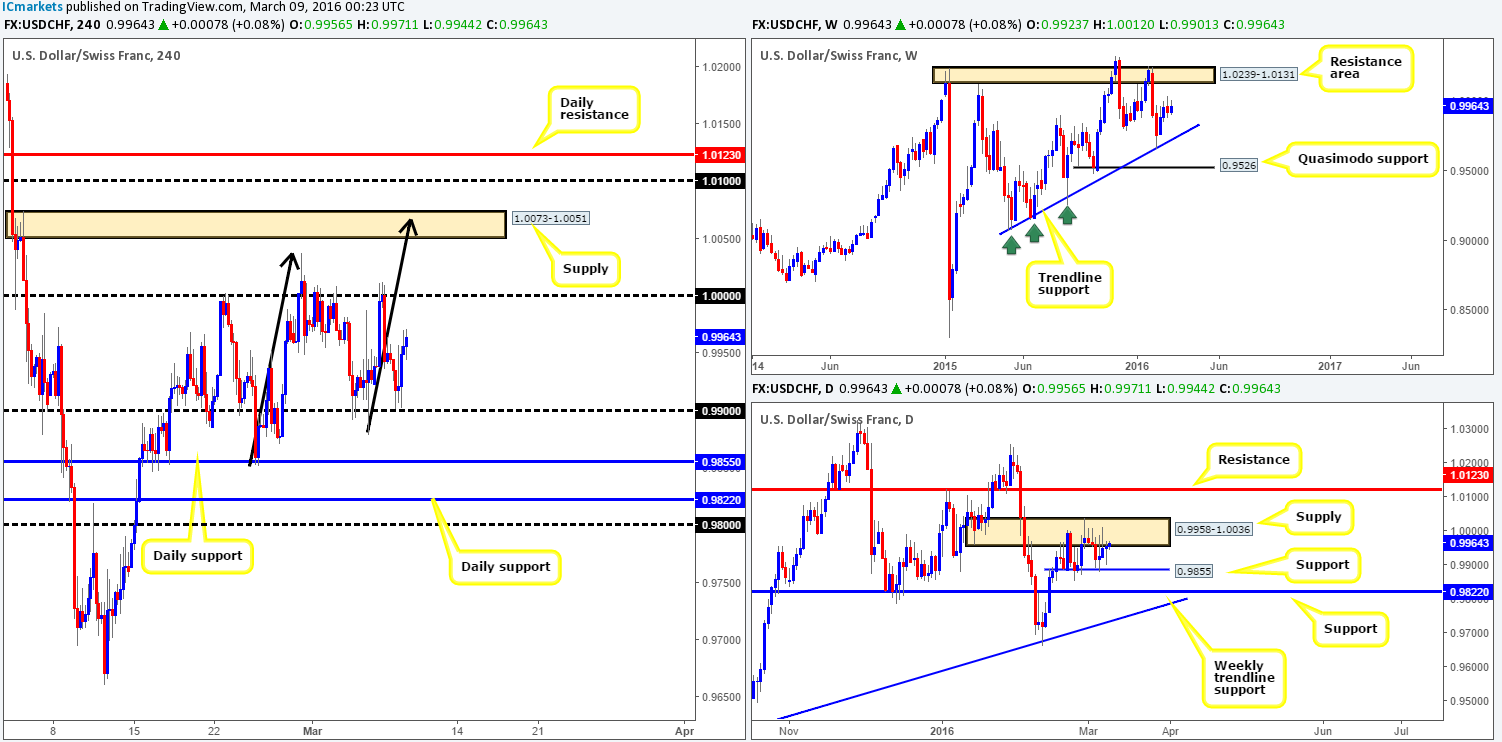
From the daily timeframe, we can see that the buyers and sellers continue to battle for position between supply at 0.9958-1.0036 and support drawn from 0.9855. In the case that this supply area is engulfed, the river north should be ripple free up to resistance coming in at 1.0123 which lies just below a weekly resistance area seen at 1.0239-1.0131. Conversely, a push below the current support would almost immediately place this market within touching distance of support penciled in at 0.9822.
Moving down into the pits of the H4 timeframe, it is pretty clear to see that this market has been confined between parity and the 0.9900 figure since the 29th Feb. Both levels have proved worthy of consideration over the past two week so do keep an eye on lower timeframe price action around these numbers for potential trades today. In addition to these barriers, we also have our eye on the following:
For shorts:
- There is a possibility that a 1:1 Harmonic move could take place up to just above H4 supply at 1.0073-1.0051 (see black arrows). Should one be looking to short this area, you may also want to take note of the 1.0100 handle above, followed closely by daily resistance at 1.0123 since a fakeout to these levels is very possible before sellers step in.
For longs:
- Daily supports 0.9855 and 0.9822 are levels we are expecting some sort of reaction to be seen. We would not be surprised to see price aggressively fake below 0.9855 to collect stops to trade from 0.9822, so do keep this scenario in mind.
Levels to watch/live orders:
- Buys: 09855 [Tentative – confirmation required] (Stop loss: dependent on where one confirms this level). 0.9822 [Tentative – confirmation required] (Stop loss: dependent on where one confirms this level). 0.9900 [Tentative – confirmation required] (Stop loss: dependent on where one confirms this level).
- Sells: 1.0073-1.0051 [Tentative – confirmation required] (Stop loss: dependent on where one confirms this area). 1.0100 [Tentative – confirmation required] (Stop loss: dependent on where one confirms this level). 1.0123 [Tentative – confirmation required] (Stop loss: dependent on where one confirms this level). 1.0000 [Tentative – confirmation required] (Stop loss: dependent on where one confirms this level).
DOW 30:
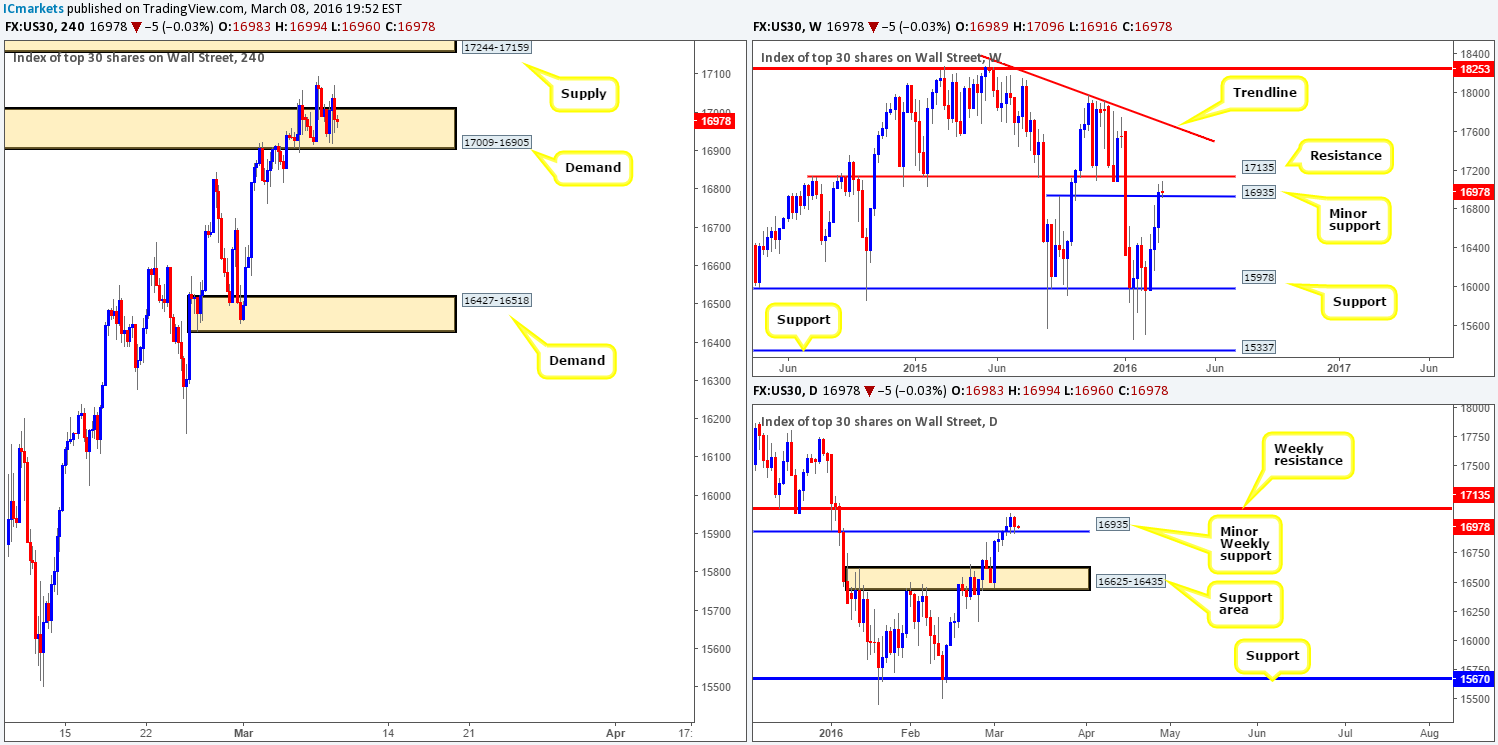
In recent sessions, the DOW index appears to have found a relatively strong foothold within H4 demand seen at 17009-16905. Despite the fact that this area is also bolstered by a minor weekly support level at 16935, there is trouble on the horizon. Directly above the H4 demand lurks a H4 supply at 17244-17159, and just below this there’s a long-term weekly resistance line at 17135 that stretches back to July 2014. In consequence, the bulls have their work cut out for them if they wish to continue pushing this market higher!
In view of the above points, where do we go from here? Well, considering price has come so very close to the weekly resistance level mentioned above at 17135, our team is hesitant to commit to any long positions today. Ultimately, what we’d like to see is a sustained move below the current H4 demand base followed by a retest of this area as supply. Not only would this confirm bearish strength from the weekly resistance level but it could possibly force price to close below the minor weekly support at 16935 on the daily timeframe. This would, along with a lower timeframe sell setup, be a nice place to short targeting H4 demand at 16427-16518 (located within daily demand at 16625-16435).
Levels to watch/live orders:
- Buys: Flat (Stop loss: N/A).
- Sells: Watch for price to consume the 17009-16905 area and look to trade any retest seen thereafter (lower timeframe confirmation required).
XAU/USD: (Gold)
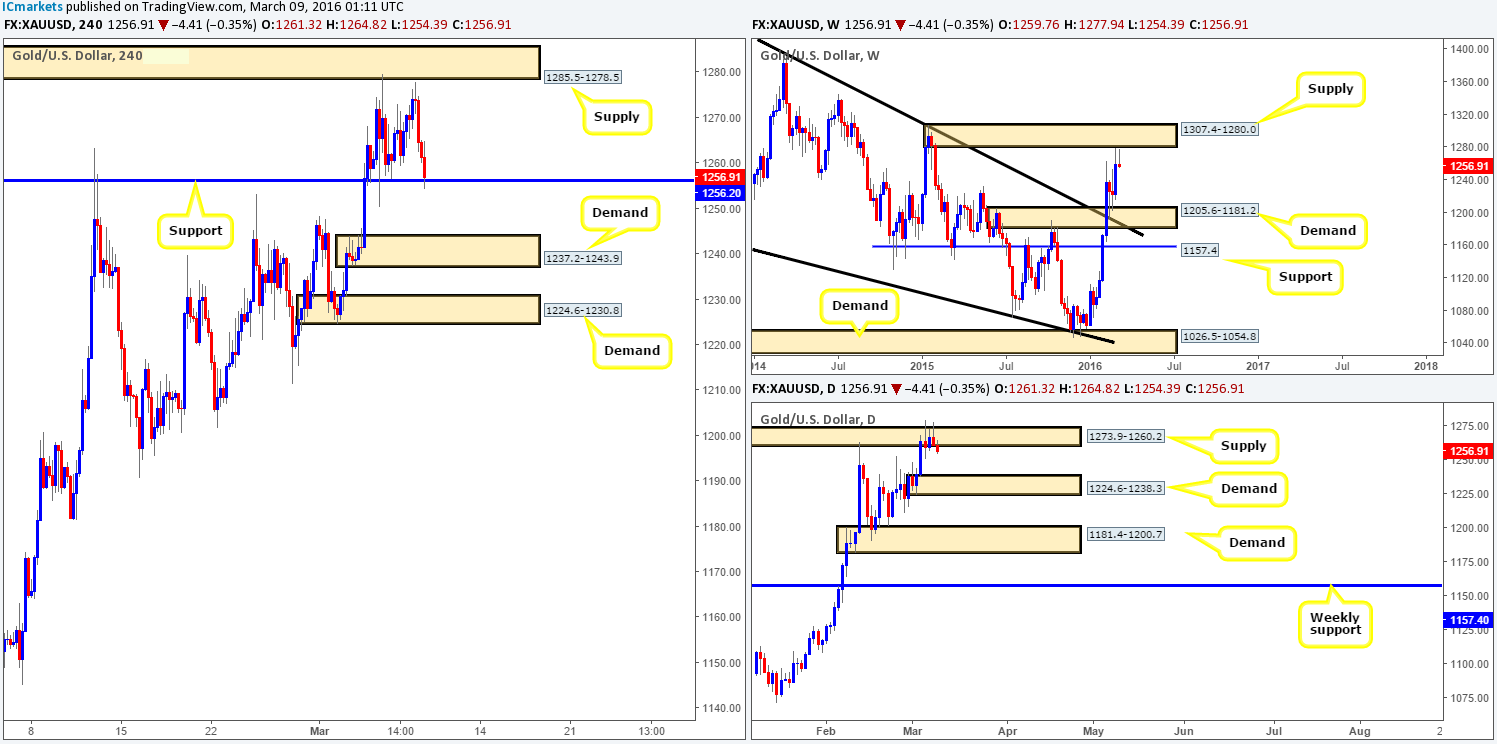
Using a top-down approach this morning, the yellow metal has finally connected with the underside of weekly supply seen at 1307.4-1280.0. Assuming that the sellers remain the dominant force around this base, the next downside target to have an eyeball on is demand coming in at 1205.6-1181.2. Climbing down into the daily timeframe, supply at 1273.9-1260.2 was, as we anticipated, chopped to pieces due to price taking stops from above this area as price rebounded from the weekly zone (see above).
Considering the position of price on the higher-timeframe picture, we have absolutely no interest in buying from the current H4 support level at 1256.2 today. Instead, we’re actually looking for this level to cave in and be retested as resistance for a confirmed short down to H4 demand at 1237.2-1243.9, followed closely by H4 demand at 1224.6-1230.8 (both areas located around daily demand at 1224.6-1238.3).
Levels to watch/live orders:
- Buys: Flat (Stop loss: N/A).
- Sells: Watch for price to consume the 1256.2 level and look to trade any retest seen thereafter (lower timeframe confirmation required).


