A note on lower timeframe confirming price action…
Waiting for lower timeframe confirmation is our main tool to confirm strength within higher timeframe zones, and has really been the key to our trading success. It takes a little time to understand the subtle nuances, however, as each trade is never the same, but once you master the rhythm so to speak, you will be saved from countless unnecessary losing trades. The following is a list of what we look for:
- A break/retest of supply or demand dependent on which way you’re trading.
- A trendline break/retest.
- Buying/selling tails – essentially we look for a cluster of very obvious spikes off of lower timeframe support and resistance levels within the higher timeframe zone.
- Candlestick patterns. We tend to only stick with pin bars and engulfing bars as these have proven to be the most effective.
For us, lower timeframe confirmation starts on the M15 and finishes up on the H1, since most of our higher timeframe areas begin with the H4. Stops usually placed 5-10 pips beyond your confirming structures.
EUR/USD:
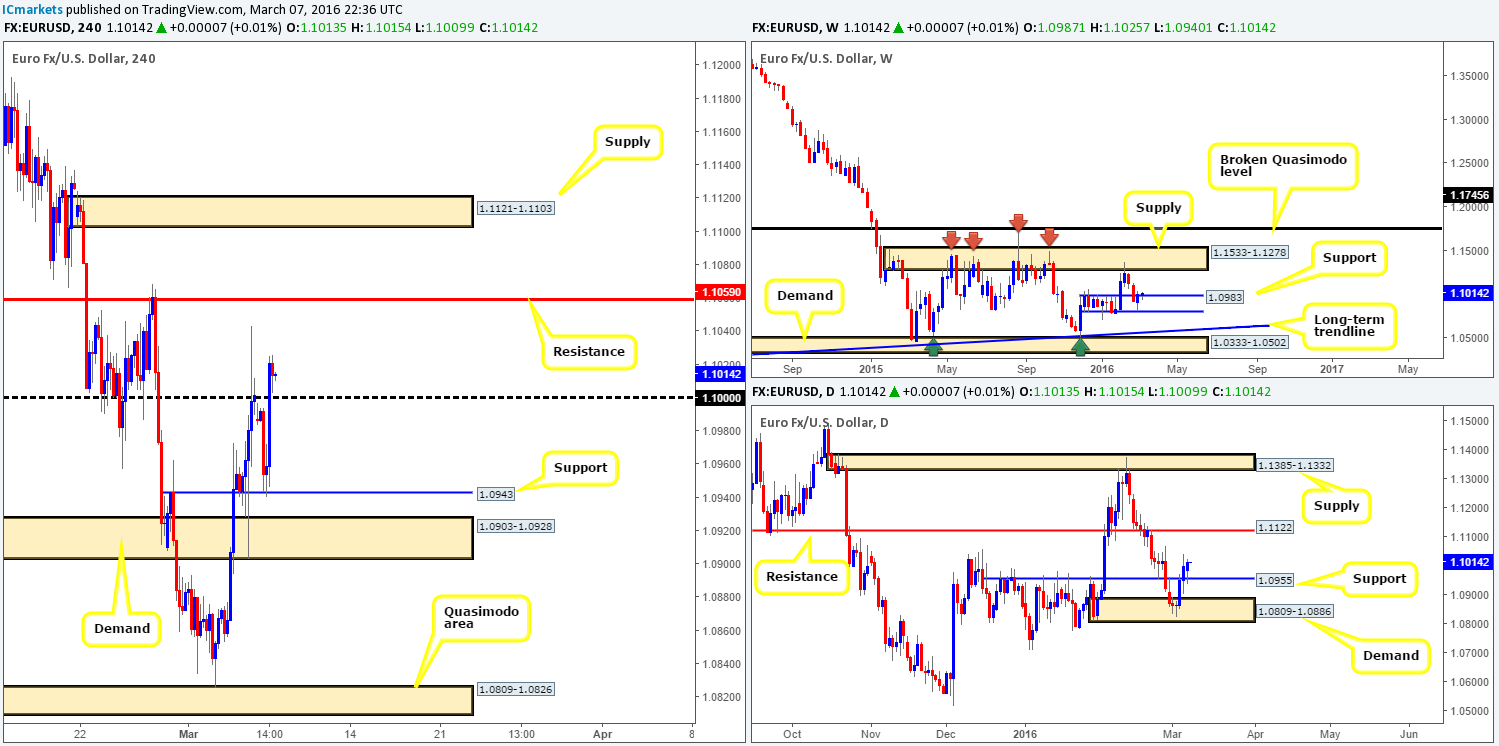
Reporting from the weekly chart this morning, the single currency has so far held ground above support at 1.0983. In the event that the bulls continue to dominate, it’s highly likely we’ll see the supply area at 1.1533-1.1278 come into play soon. Climbing down into the pits of the daily chart, support penciled in at 1.0955 was beautifully retested during yesterday’s session consequently printing a third consecutive bullish candle. Although there’s supply seen to the left of current price from here at 1.1068-1.0986, we’re confident this market will climb to resistance at 1.1122.
On to the H4 chart, yesterday’s action saw the EUR aggressively bounce from support at 1.0943 following three nice-looking buying tails. This, as you can see, pushed price above the large psychological number 1.1000 going into the close 1.1013. Now, given our notes regarding the higher-timeframe picture (see above), today’s spotlight will firmly be focused on the 1.1000 figure. Should price retest this hurdle today and print a lower timeframe buy setup, a trade long is possible up to at least resistance painted at 1.1059, followed by supply at 1.1121-1.1103 (sits directly below the daily resistance barrier we discussed above).
Levels to watch/live orders:
- Buys: 1.1000 [Tentative – confirmation required] (Stop loss: dependent on where one confirms this level).
- Sells: Flat (Stop loss: N/A).
GBP/USD:
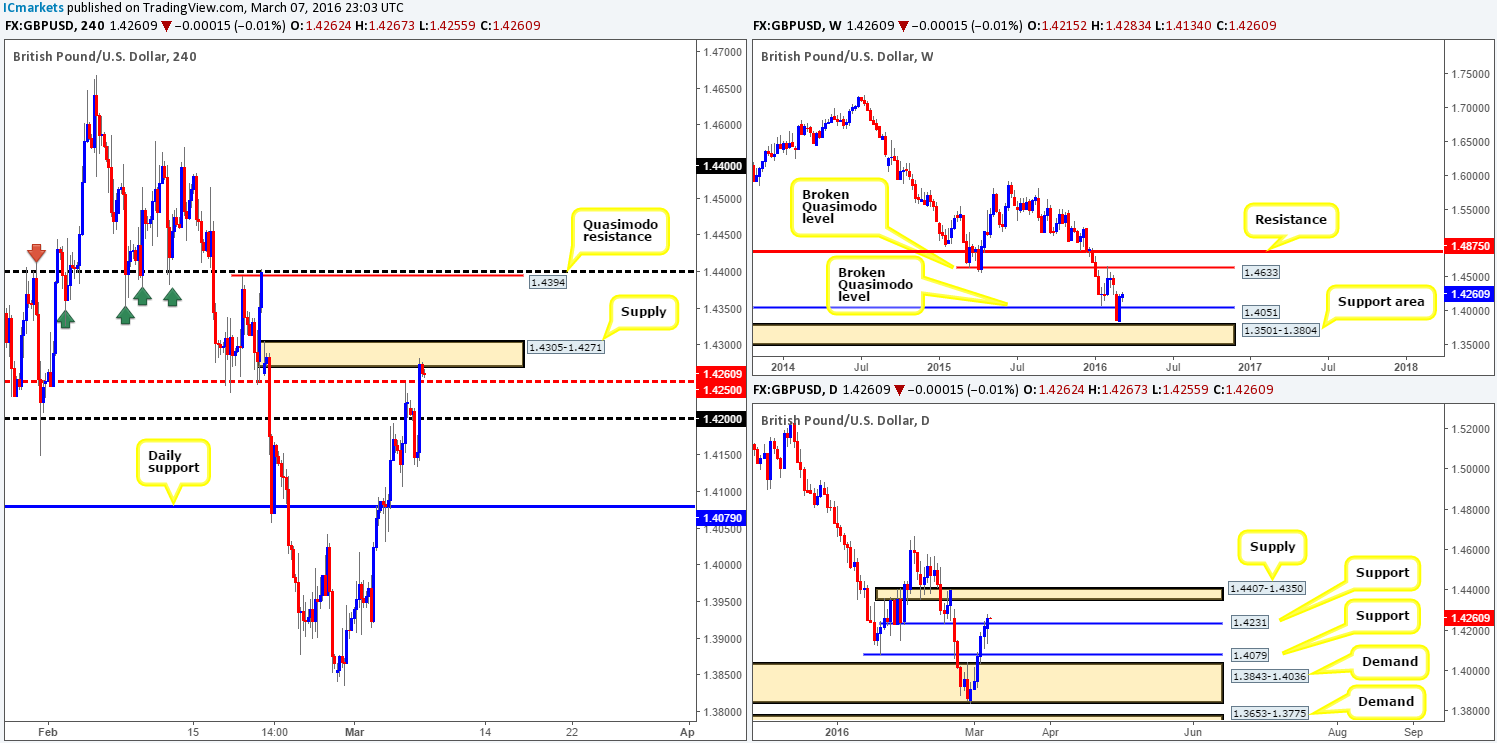
Since the 29th Feb, daily action has steadily increased in value with not one red candle in sight! As we can all see, resistance (now support) at 1.4231 was taken out during yesterday’s advance, potentially opening up the path to further upside towards supply seen at 1.4407-1.4350. Scanning up to the weekly chart, we can see that there is little resistance in sight until price collides with the broken Quasimodo level coming in at 1.4633. Therefore, the H4 supply currently in play at 1.4305-1.4271 has limited downside potential in our opinion. In fact, we struggle seeing the GBP breaking below the mid-level barrier 1.4250!
Before looking to buy this market, however, the aforementioned H4 supply will need to be taken out and retested as demand. Following this, price will be primed (with lower timeframe confirmation) for a long trade up to the combined H4 Quasimodo resistance at 1.4394/1.4400 figure, which is positioned within the extremes of the daily supply area we discussed above. Therefore, not only does this make for a fantastic take-profit zone, it also forms a beautiful-looking sell area! So, be sure to keep these levels noted in your watch lists traders!
Levels to watch/live orders:
- Buys: Watch for price to consume the 1.4305-1.4271 area and look to trade any retest seen thereafter (lower timeframe confirmation required).
- Sells: 1.4400 region [Tentative – confirmation required] (Stop loss: dependent on where one confirms this area).
AUD/USD:
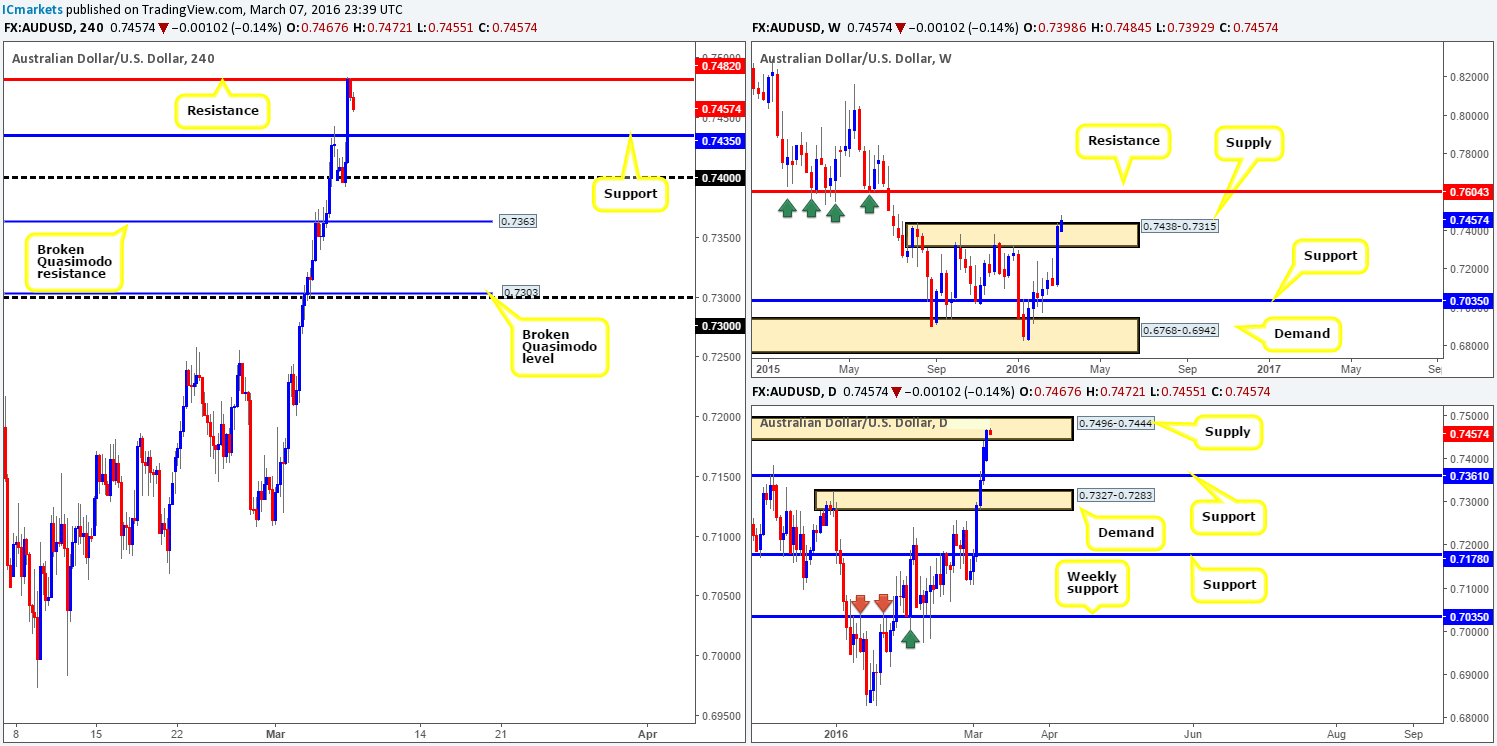
Starting from the top this morning, weekly flow shows that the commodity currency recently breached supply at 0.7438-0.7315, which could indicate further upside towards resistance coming in at 0.7604. However, we’d really like to see this weekly candle close up shop before making any further judgment on this timeframe since this could simply be a fakeout to push prices lower! In addition to this, check out how both the daily chart is trading from supply painted at 0.7496-0.7444, and the H4 chart has already bounced from the H4 resistance at 0.7482, thus suggesting a bearish move ahead.
In light of the above points, we feel weekly action may, and we emphasize the word may here, be in the process of running stops above the aforementioned supply to drive lower. As such, a confirmed short from the above said H4 resistance level would be a fantastic sell trade today. Unfortunately, it seems we may have missed the boat on this one as price is currently steaming down to target one – the H4 support at 0.7435. Nevertheless, price may yet pullback to collect more sellers, so do keep a tab on the 0.7282 level.
Levels to watch/live orders:
- Buys: Flat (Stop loss: N/A).
- Sells: 0.7482 [Tentative – confirmation required] (Stop loss: dependent on where one confirms this level).
USD/JPY:
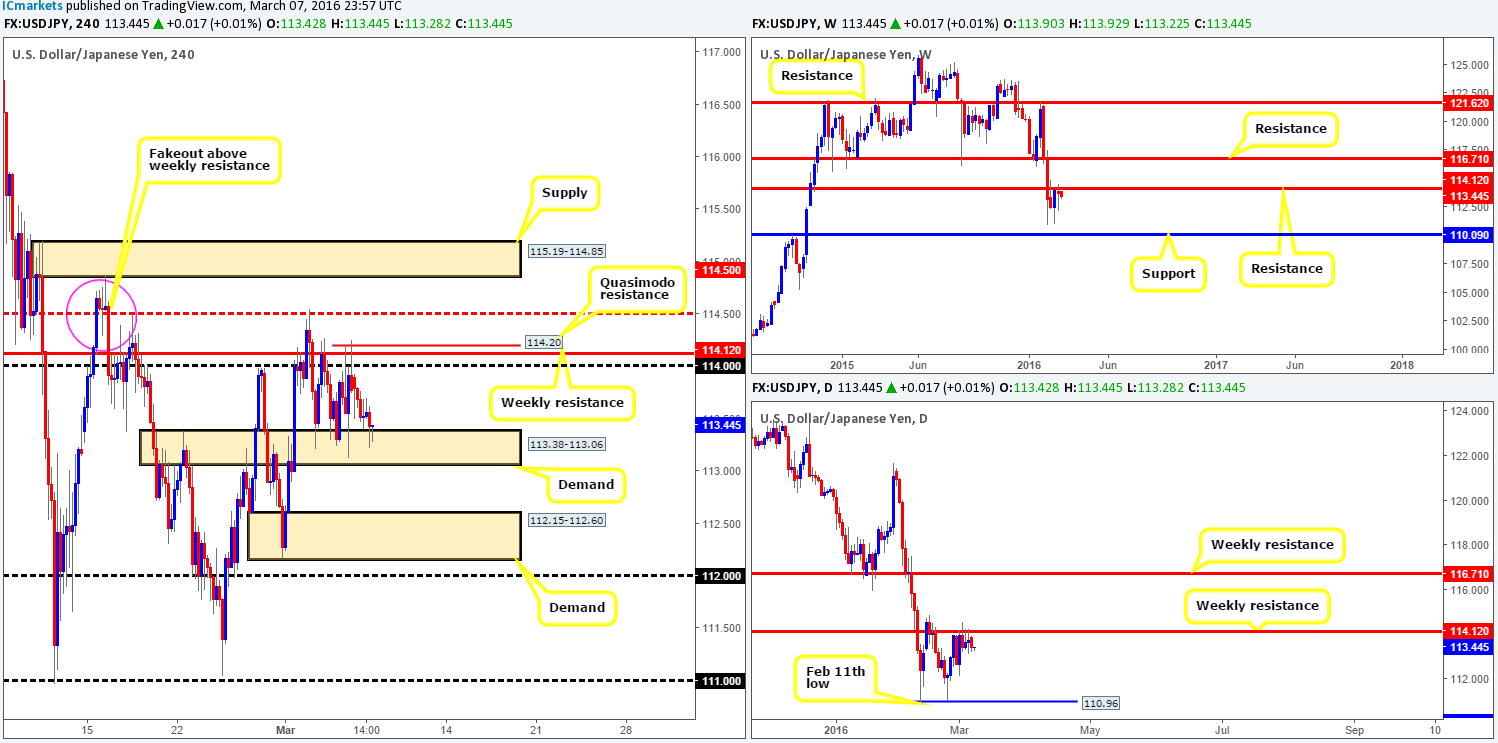
Weekly resistance at 114.12, as can be seen from the chart, continues to suppress buying pressure in this market. On the assumption that the bears remain defensive here, the next downside target can be seen at 110.09 – a weekly support. Nevertheless, looking at the daily chart, it’s clear that for the bears to reach this target, the Feb 11th low (double-bottom support) at 110.96 has to be consumed beforehand.
Jumping across to the H4 chart, however, price action is seen in a rather messy consolidation phase between the aforementioned weekly resistance level and a H4 demand barrier drawn from 113.38-113.06. Personally, we would not feel comfortable trading long from this demand area knowing weekly bears are lurking just above. To that end, battle lines (lower timeframe confirmation preferred at each level) going into today’s sessions are as follows:
- The weekly resistance level at 114.12. Notice that this number also boasts a 114.00 figure and a small (clearer on the lower timeframes) H4 Quasimodo resistance hurdle at 114.20.
- Break below and retest of the current H4 demand as supply, targeting H4 demand at 112.15-112.60 first and foremost.
Levels to watch/live orders:
- Buys: Flat (Stop loss: N/A).
- Sells: 114.20/114.00 [Tentative – confirmation required] (Stop loss: dependent on where one confirms this area). Watch for price to consume the 113.38-113.06 area and look to trade any retest seen thereafter (lower timeframe confirmation required).
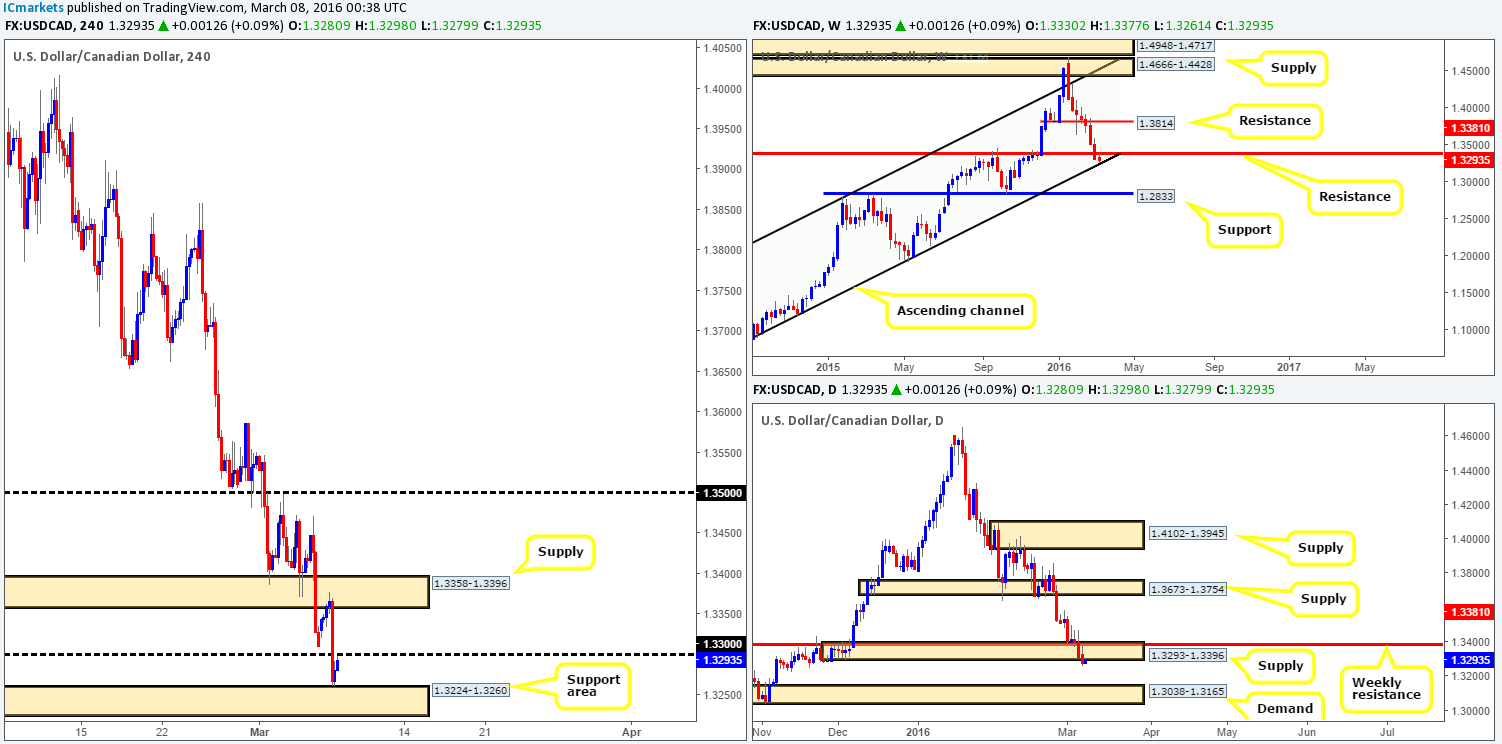
USD/CAD:
Early on in U.S. trading, the Loonie plummeted from the underside of H4 supply drawn from 1.3358-1.3396 into the jaws of a H4 support area coming in at 1.3224-1.3260. Going into yesterday’s close, the bulls, as you can see, made a last-minute bid from here, which has seen early-bird traders further extend price up to the 1.3300 figure this morning.
In view of the above information, where does one go from here? Well, over on the weekly chart, price is now crossing paths with a long-term ascending channel support line extended from the low 1.0620. Meanwhile, down on the daily chart, demand (now acting supply) at 1.3293-1.3396 was recently taken out, thus possibly opening the path south down to demand seen below at 1.3038-1.3165. On account of this, a long position could be feasible should price close above and retest the 1.3300 figure today. However, be sure to liquidate the majority of your position at the H4 supply above at 1.3358-1.3396, since it converges with weekly resistance at 1.3293. Conversely, if 1.3300 holds this market lower, it’s likely that a messy fight will break out between the bulls and the bears within the current H4 support area, which is something we have no interest in participating in!
Levels to watch/live orders:
- Buys: Watch for price to consume the 1.3300 and look to trade any retest seen thereafter (lower timeframe confirmation required).
- Sells: Flat (Stop loss: N/A).


