
EUR/USD:
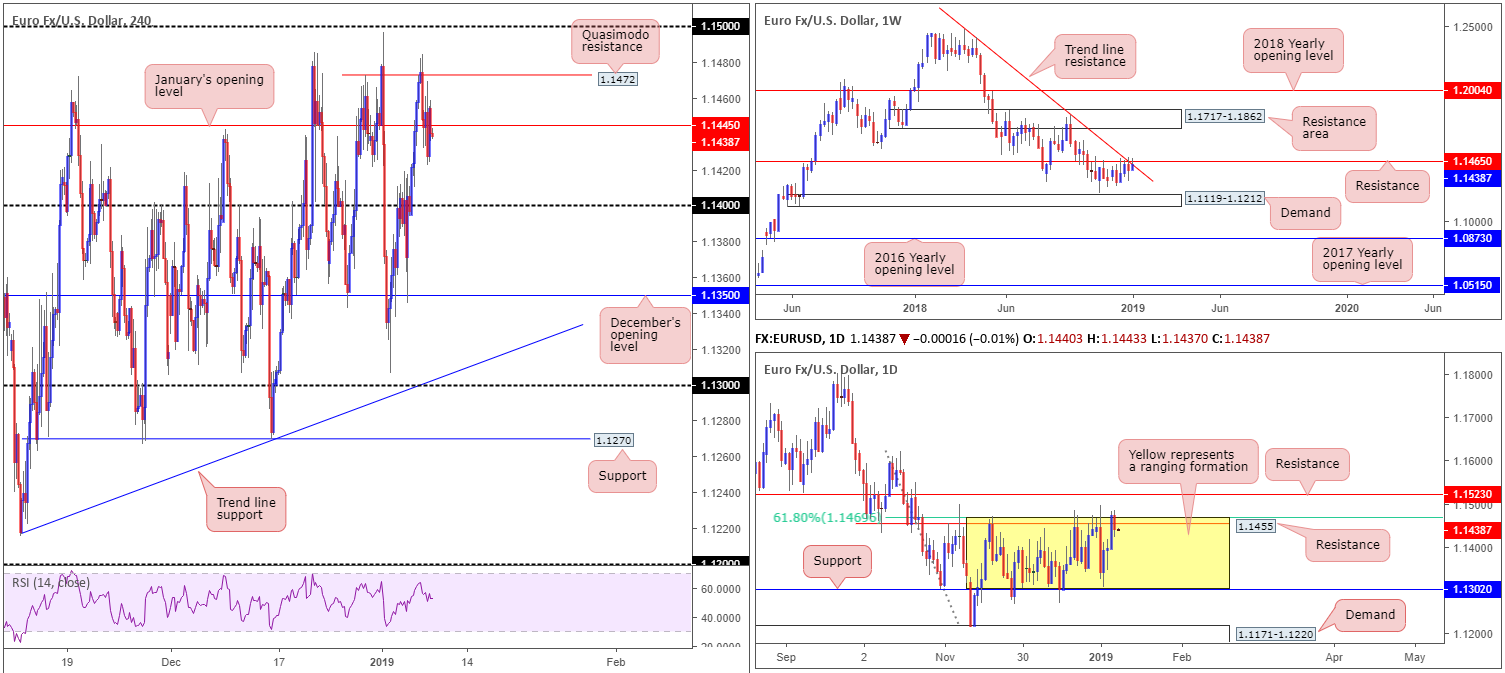
For folks who read Tuesday’s briefing you may recall the piece highlighted a possible sell off the H4 Quasimodo resistance level seen at 1.1472, targeting January’s opening level at 1.1445 as the initial take-profit zone. The research team favoured this barrier due to the following reasons:
- A confirming H4 bearish pin-bar formation. Traders had the option of entering short at 1.1469 (the open of the pin-bar candle) with stop-loss orders positioned two pips above the pin-bar’s wick at 1.1484, equating to a 15-pip stop.
- Weekly movement retesting its merging resistance at 1.1465 and trend line resistance (extended from the high 1.2476).
- Daily flow also visibly tackling the top edge of its range (yellow) at resistance drawn from 1.1455 (converging 61.8% Fibonacci resistance value at 1.1469).
As is evident from the H4 chart this morning, the setup played out as expected and achieved its first take-profit objective. Well done to any of our readers who managed to jump aboard this move.
Areas of consideration:
The recent H4 close underneath 1.1445 potentially sets the stage for further downside today towards 1.14, followed by December’s opening level plotted at 1.1350. The nearest higher-timeframe support is not seen until the lower edge of the daily range at 1.1302, therefore there’s room for sellers to really stretch their legs in this market it seems.
For traders who remain short from 1.1472ish, holding a portion of your position is an option given the overall technical picture displaying a bearish stance. Those who missed the initial short, however, may want to drill down to lower-timeframe levels and attempt to sell sub 1.1445 based on local structure – a break of support/retest play for example.
Irrespective of whether you’re already short or looking to initiate a fresh short, the first downside target, as underlined above, falls in around 1.14, followed then by December’s opening level at 1.1350 and then quite possibly 1.13ish (the lower edge of the current daily range).
Today’s data points: FOMC Members Evans and Rosengren Speak; FOMC Meeting Minutes.
GBP/USD:
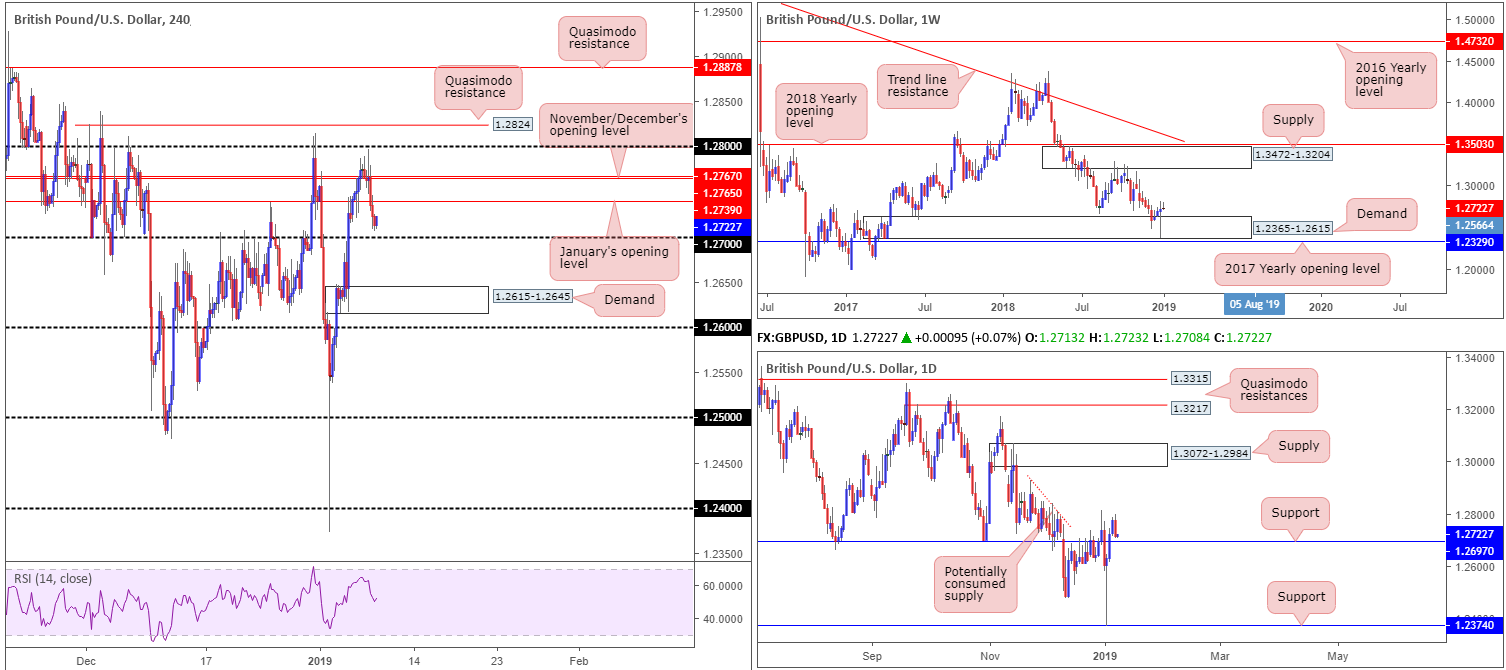
Leaving the underside of 1.28 unopposed in early European trade Monday, the British pound yielded ground to its US counterpart. The EU repeatedly stating that Brexit negotiations are not to be reopened, along with the UK government facing a defeat on the amendment to change the budget legislation and a resurgence of USD bidding, collectively weighed on sterling, down 0.48% on the day.
As indicated on the daily timeframe this morning, fresh selling developed a clear-cut bearish engulfing formation and positioned the GBP/USD just north of support at 1.2697. The H4 candles paint a similar picture, posting up just ahead of its 1.27 handle. Knowing we’re also still seen trading from weekly demand at 1.2365-1.2615, it’s reasonable to expect active buyers to reside around 1.27. A failure of this level, however, exposes H4 demand seen at 1.2615-1.2645.
Areas of consideration:
Entering long from 1.27 has the underside of January’s opening level at 1.2739 as its initial upside target, tailed closely by November and December’s opening levels at 1.2767/65. Traders are urged to ensure risk/reward conditions are in place before pulling the trigger. In other words, confirm you have at least a 1:1 risk/reward ratio towards 1.2739.
In the event we break for lower ground today, though, traders will likely be eyeing the H4 demand area mentioned above at 1.2615-1.2645 for possible longs, initially targeting 1.27. Although this area may very well hold ground, traders should be prepared for the possibility of a fakeout lower to draw in buyers from 1.26.
Today’s data points: BoE Gov. Carney Speaks; FOMC Members Evans and Rosengren Speak; FOMC Meeting Minutes.
AUD/USD:
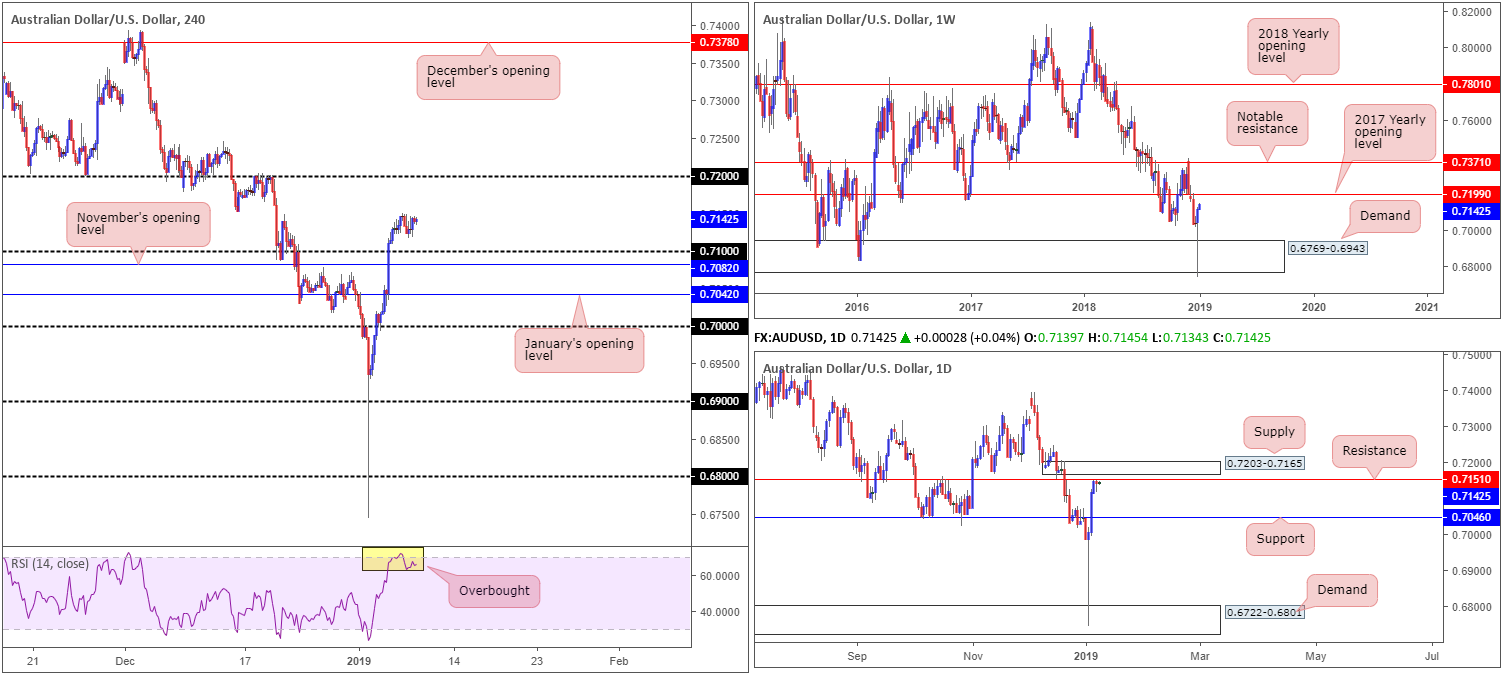
Trading volumes remained light amid Tuesday’s segment, despite disappointing Australian data (trade surplus fell 4.4% in November to $1.93B) and a resurgence in USD bidding.
In view of yesterday’s somewhat lackluster performance, much of the following report will echo thoughts put forward in Tuesday’s briefing.
A WSJ report announced US and China negotiators have narrowed differences on trade, though the two sides are not ready to conclude a deal as negotiations slip into Wednesday. This could account for Tuesday’s indecisive price movement.
From the technical side of things, weekly flow remains poised to extend gains, targeting the 2017 yearly opening level at 0.7199. This comes after a mammoth bullish pin-bar formation printed out of demand priced in at 0.6769-0.6943. Daily movement, on the other hand, is testing waters just south of resistance priced in at 0.7151, shadowed closely by a supply zone at 0.7203-0.7165.
A closer reading of the market sees the H4 candles testing the 0.7148 Dec 20 highs, after making headway above 0.71. Beyond 0.7148, according to this timeframe, limited resistance is seen until the pair crosses swords with 0.72. 0.72, as you can probably see, has a strong connection to the 2017 yearly opening level mentioned above on the weekly timeframe at 0.7199. It might also be of interest to some traders to note the RSI indicator on the H4 scale is currently drawing up an overbought reading.
Areas of consideration:
On account of the above, the research team notes price action could simply continue to press for higher ground this week and eventually test 0.72ish, which, as we already know, denotes weekly resistance. This would imply a break of daily resistance at 0.7151, though, and a run into daily supply at 0.7203-0.7165.
On the other hand, a pullback from the 0.7148 Dec 20 highs to the 0.71 handle on the H4, given the current H4 RSI overbought signal, is also a possibility. In order to secure a trade long from 0.71 in an attempt to join weekly flow, the research team recommends waiting for additional candlestick confirmation to form due to daily sellers potentially entering the fold from its current resistance at 0.7151. Entering on candlestick confirmation enables traders to identify whether buyers have an interest at 0.71, as well as having a structure offering defined entry/stop parameters.
As far as upside targets are concerned, 0.7151 (daily resistance) and the 0.72 handle are both logical take-profit zones.
Today’s data points: FOMC Members Evans and Rosengren Speak; FOMC Meeting Minutes.
USD/JPY:
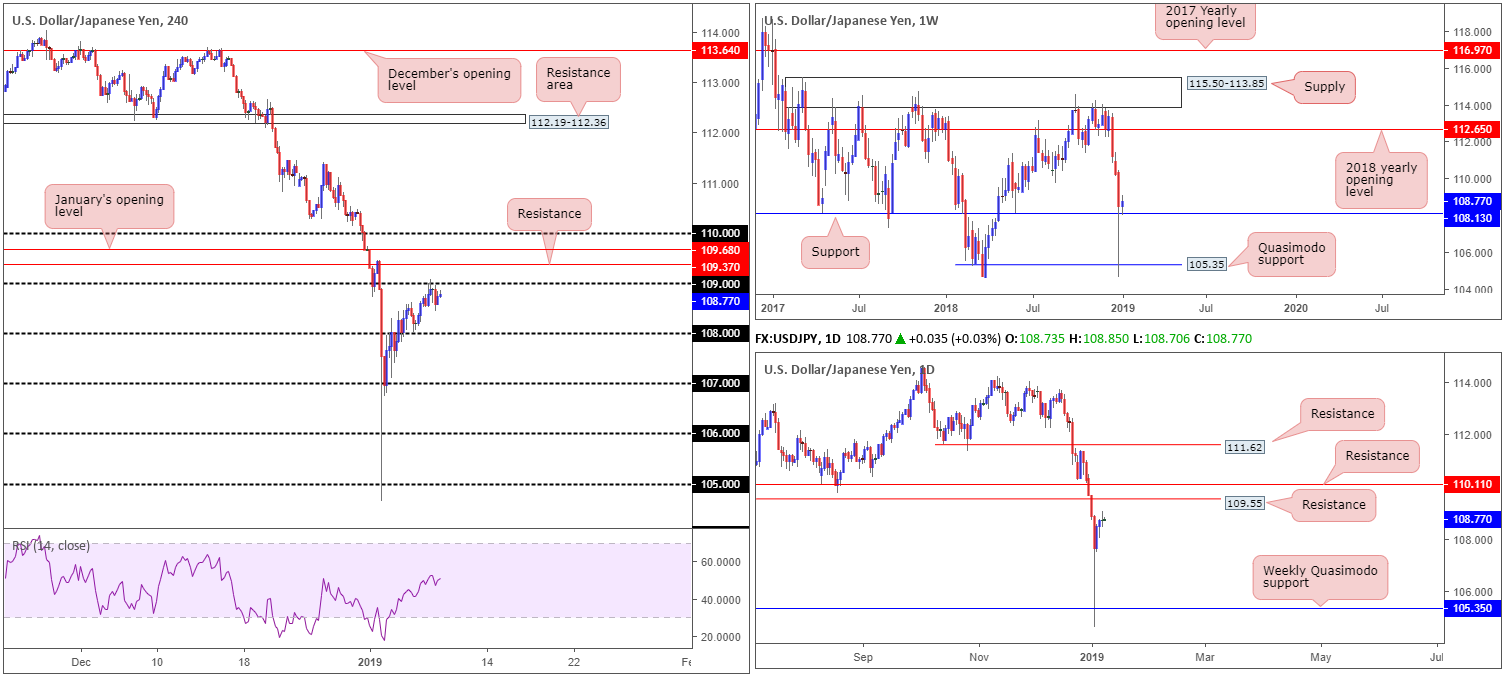
USD/JPY prices remain unchanged this morning, as the pair encountered sturdy opposition around its 109 handle, consequently receding to mid-108 into the closing bell. Directly above 109, traders may want to note potential resistance residing around 109.37, shadowed closely by January’s opening level at 109.68.
Weekly movement, however, remains optimistic. The research team notes the unit tested support at 108.13 Monday and has thus far held ground. On this timeframe, a moderately clear path to the upside is seen until we connect with the 2018 yearly opening level at 112.65. In conjunction with weekly flow, daily action also exhibits scope to explore higher ground, steering towards resistance plotted at 109.55, followed closely by another layer of resistance at 110.11.
Areas of consideration:
Having seen weekly price defend support at 108.13 and daily price displaying room to press higher, there’s potential for further upside. How do traders take advantage of this information on the H4? Entering long on the H4 timeframe is restricted, knowing we have a gathering of resistances loaded up above us, the first being 109.
Unfortunately, the research team does not have the answer unless traders are willing to risk buying into defined H4 resistance in the hope higher-timeframe players keep pushing higher, as suggested. For that reason, opting to remain on the sidelines is an option in this market this morning.
Today’s data points: FOMC Members Evans and Rosengren Speak; FOMC Meeting Minutes.
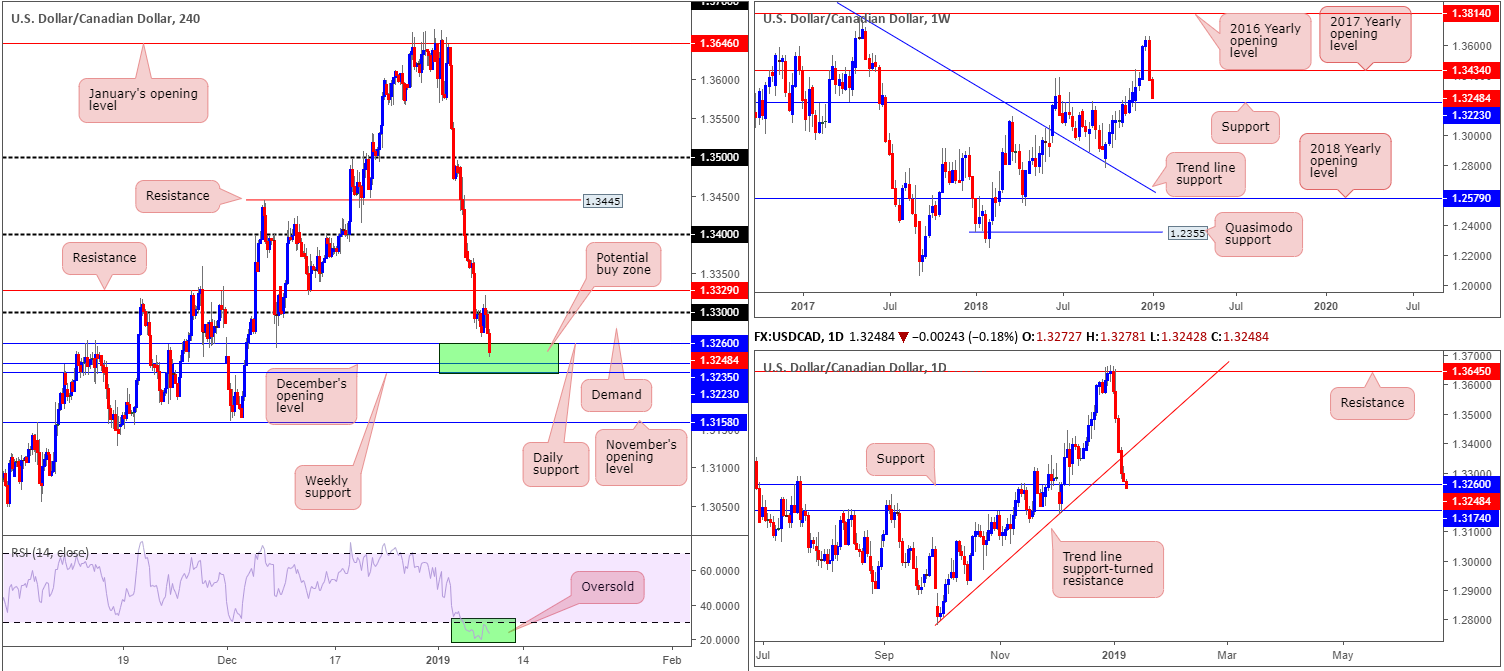
USD/CAD:
In recent hours, traders observed a round of selling take place after the pair established resistance sub 1.33 amid Tuesday’s segment.
As can be seen on the H4 timeframe this morning, this brought the candles into an interesting area of support (green) at 1.3223/1.3260 (comprised of weekly support at 1.3223, December’s opening level at 1.3235 and daily support at 1.3260). In addition to this, it might be worth noting the H4 RSI indicator is displaying an oversold reading.
Areas of consideration:
Keeping it as simple as possible, the green H4 zone at 1.3223/1.3260 is an area buyers may look to enter the fight. Therefore, should traders observe signs of buying in the shape of a bullish candlestick formation (entry/stop parameters can be defined according to this pattern) a long in this market is considered high probability, targeting 1.33 as the initial port of call, followed by H4 resistance at 1.3329.
Today’s data points: FOMC Members Evans and Rosengren Speak; FOMC Meeting Minutes; BoC Monetary Policy Report, BoC Rate Statement, Overnight Rate, BoC Press Conference.
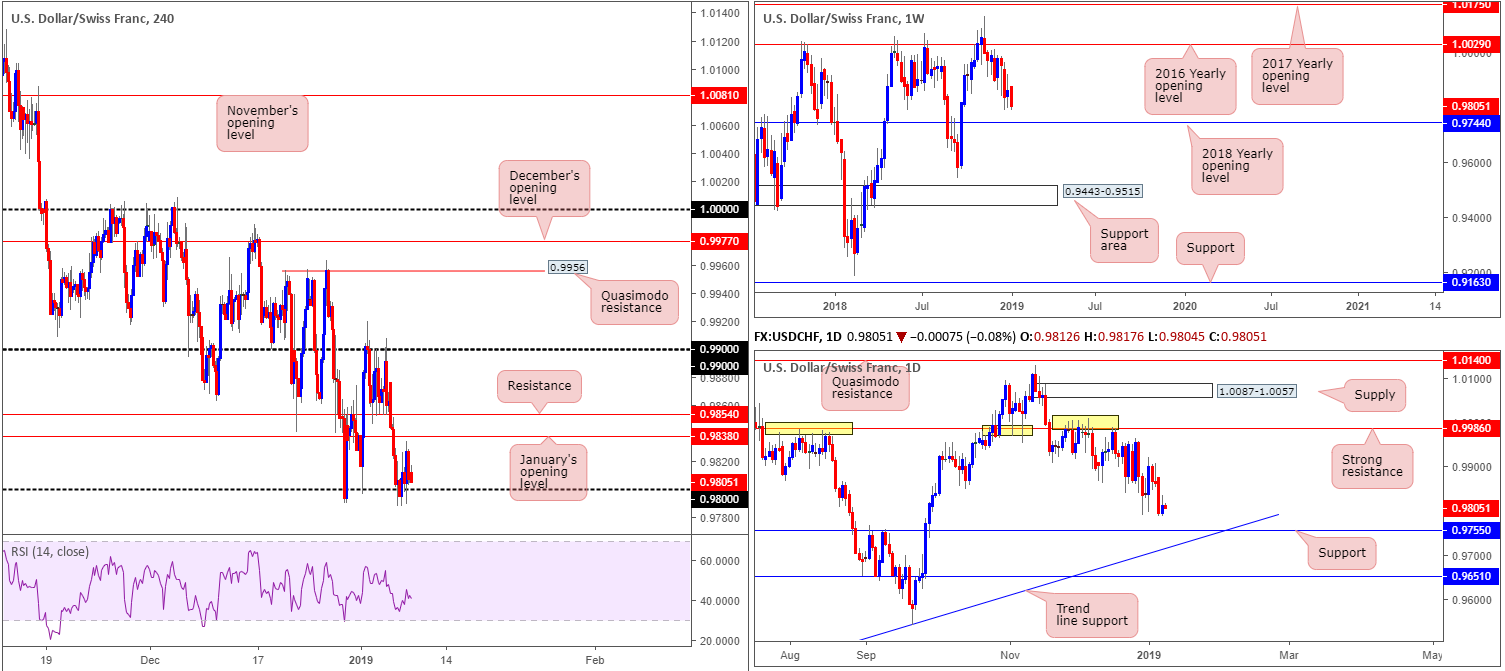
USD/CHF:
The USD/CHF, which recently suffered three consecutive days in the red, staged a modest recovery Tuesday. Bolstered by a broadly stronger buck, the pair managed to hold firm around 0.98, though failed to shake hands with nearby H4 resistance in the form of January’s opening level at 0.9838. Beyond 0.98, H4 demand coming in at 0.9737-0.9763 (not seen on the screen) is marked as the next downside target.
As highlighted in Tuesday’s briefing, our technical studies on the higher timeframe shows price meandering just north of the 2018 yearly opening level at 0.9744, which is sited within the walls of the current H4 demand. In addition to this, daily price reveals support fixed at 0.9755, also located within the H4 demand zone.
Areas of consideration:
In view of the above reading, two possible scenarios remain in view today:
- In the event we break beneath 0.98, a retest play to the underside of this number, targeting the top edge of the H4 demand area at 0.9737-0.9763 is a possibility. Ultimately, traders are urged to enter on the back of additional confirmation here, and ensure risk/reward conditions are favourable. In other words, confirm you have at least a 1:1 risk/reward ratio towards the top edge of the H4 demand before pulling the trigger.
- A long from the current H4 demand, knowing we have both weekly and daily support levels fixed within, is a high-probability trading opportunity. With stop-loss orders tucked beneath the lower edge of the area at 0.9735 and an entry at 0.9763, this offers traders 37 pips of profit to the underside of 0.98 as an initial take-profit zone.
Today’s data points: FOMC Members Evans and Rosengren Speak; FOMC Meeting Minutes.
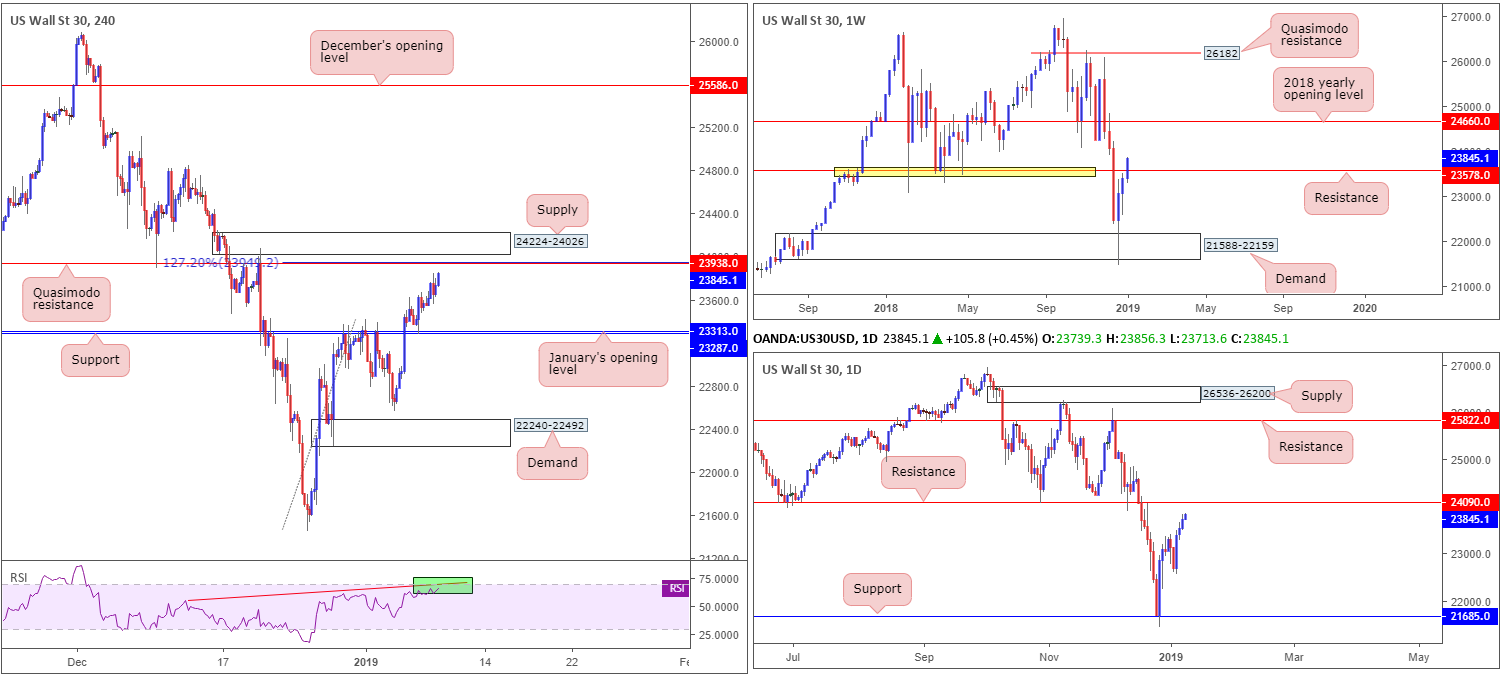
Dow Jones Industrial Average:
The Dow Jones Industrial Average closed higher for a third straight session Tuesday, with real estate and internet stocks leading the way. Investors also remain encouraged by the progress reported surrounding trade talks between the US and China.
In terms of where we stand on the weekly timeframe from a technical viewpoint, resistance at 23578, which has strong historical significance, appears to have been engulfed, potentially exposing the 2018 yearly opening level at 24660. Daily flow, on the contrary, is poised to attack nearby resistance drawn from 24090. Note this level also boasts reasonably strong historical meaning.
Supporting the current daily resistance, H4 structure recognizes a Quasimodo resistance at 23938 (also merges with a 127.2% Fibonacci extension point at 23949), trailed closely by supply at 24224-24026. Note the supply area also proved its worth once already in late December 2019. Further adding to this, the RSI indicator is seen fast approaching its overbought value and close to forming a divergence reading (green).
Areas of consideration:
Despite weekly price attempting to make headway beyond resistance at 23578, the research team notes active sellers likely reside around the current H4 structure: Quasimodo resistance at 23938 and supply at 24224-24026. A H4 bearish candlestick pattern (entry/stop parameters can be defined according to this pattern) printed from these areas would, according to the local confluence and current daily resistance, be considered a high-probability selling opportunity, targeting H4 support at 23287/January’s opening level at 23313.
Today’s data points: FOMC Members Evans and Rosengren Speak; FOMC Meeting Minutes.
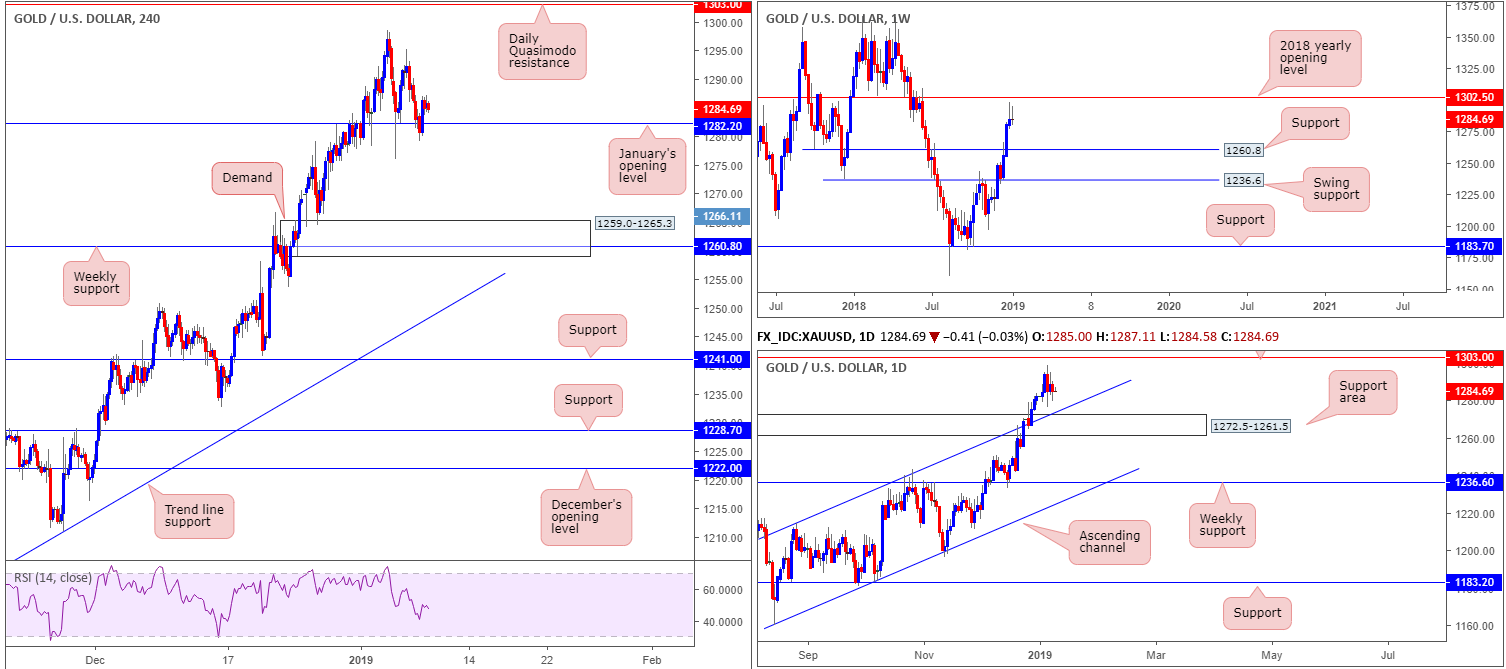
XAU/USD (Gold):
It was a reasonably subdued session Tuesday, with the H4 candles, once again, establishing a floor of support around January’s opening level at 1282.2. A break beyond this level would, according to our technical drawings, expose demand coming in at 1259.0-1265.3.
With the above in mind, weekly price remains sluggish ahead of the 2018 yearly opening level at 1302.5 in the shape of a bearish pin-bar formation. By and of itself, this could be enough to encourage further selling in the market. The picture on the daily timeframe, however, shows price action is lodged between a Quasimodo resistance level at 1303.0, and a channel resistance-turned support (taken from the high 1214.3) that merges with a support area coming in at 1272.5-1261.5.
Areas of consideration:
In light of the above reading, and echoing much the same vibe as in Tuesday’s briefing, the research team notes to be wary of longs from January’s opening level at 1282.2, largely because the level houses limited higher-timeframe convergence. With that being the case, the H4 demand zone mentioned above at 1259.0-1265.3 remains a possible area for longs this week. Not only is the zone connected to weekly support at 1260.8, it is also housed within the lower limits of the current daily support area at 1272.5-1261.5.
With stop-loss orders placed beneath the lower edge of the current H4 demand (1259.0), a rotation from this area is high probability, given the overall market picture.
The use of the site is agreement that the site is for informational and educational purposes only and does not constitute advice in any form in the furtherance of any trade or trading decisions.
The accuracy, completeness and timeliness of the information contained on this site cannot be guaranteed. IC Markets does not warranty, guarantee or make any representations, or assume any liability with regard to financial results based on the use of the information in the site.
News, views, opinions, recommendations and other information obtained from sources outside of www.icmarkets.com.au, used in this site are believed to be reliable, but we cannot guarantee their accuracy or completeness. All such information is subject to change at any time without notice. IC Markets assumes no responsibility for the content of any linked site. The fact that such links may exist does not indicate approval or endorsement of any material contained on any linked site.
IC Markets is not liable for any harm caused by the transmission, through accessing the services or information on this site, of a computer virus, or other computer code or programming device that might be used to access, delete, damage, disable, disrupt or otherwise impede in any manner, the operation of the site or of any user’s software, hardware, data or property.


