
A note on lower timeframe confirming price action…
Waiting for lower timeframe confirmation is our main tool to confirm strength within higher timeframe zones, andhas really been the key to our trading success. It takes a little time to understand the subtle nuances, however, as each trade is never the same, but once you master the rhythm so to speak, you will be saved from countless unnecessary losing trades. The following is a list of what we look for:
- A break/retest of supply or demand dependent on which way you’re trading.
- A trendline break/retest.
- Buying/selling tails – essentially we look for a cluster of very obvious spikes off of lower timeframe support and resistance levels within the higher timeframe zone.
- Candlestick patterns. We tend to only stick with pin bars and engulfing bars as these have proven to be the most effective.
For us, lower timeframe confirmation starts on the M15 and finishes up on the H1, since most of our higher timeframe areas begin with the H4.
EUR/USD:
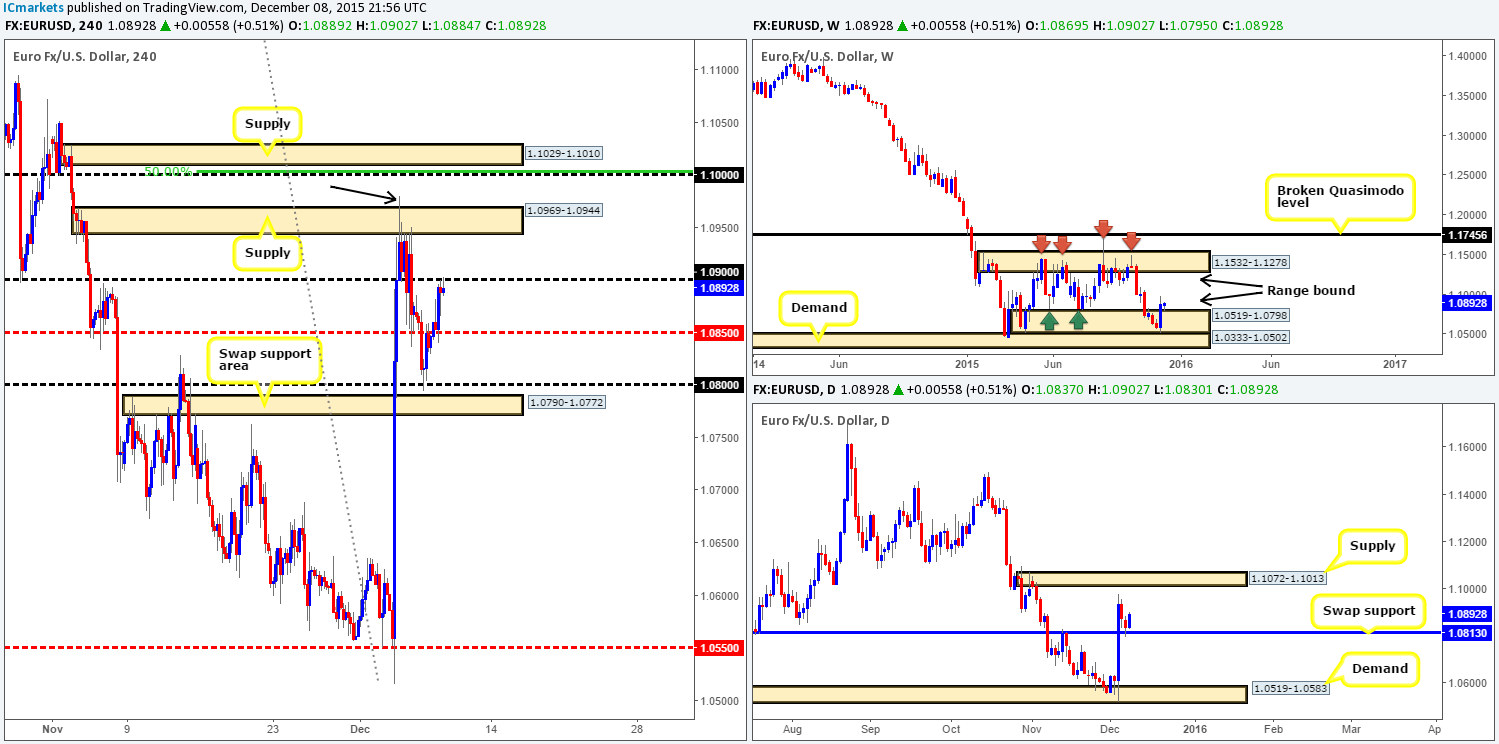
Early trade saw the EUR currency close above mid-level resistance 1.0850, which, as you can see, was later used as support mid-way through London’s morning session to push prices up to psychological resistance 1.0900. This was a noted move to watch out for in our previous report (http://www.icmarkets.com/blog/tuesday-8th-december-daily-technical-outlook-and-review/), well done to any of our readers who managed to lock in some green pips here!
In view of price now kissing the underside of 1.0900 right now, what direction do we see this pair heading today? Well, we have little interest in shorting from here, since price is currently trading from not only a weekly range demand at 1.0519-1.0798, but also a daily swap (support) level at 1.0813. To that end, what we’re looking for is a sustained move above 1.0900 during today’s sessions. To our way of seeing things, this would effectively clear the path north up to the large psychological resistance 1.1000 (converges nicely with the 50.0% Fibonacci level at 1.1002), followed closely by supply at 1.1029-1.1010. Reason being is that near-term supply at 1.0969-1.0944 has likely been consumed by the strong wick seen marked with a black arrow at 1.0980.
On account of the above structure, our prime focus today will be looking for price to close above 1.0900 and retest this level (with lower timeframe confirmation) as support. Should this come to fruition, we’ll be eyeing the top-side of the aforementioned near-term supply at 1.0969 as our immediate take-profit area since there may be residual orders left over, followed by 1.1000 for trade closure.
Levels to watch/live orders:
- Buys:Watch for offers to be consumed around 1.0900 and then look to trade any retest seen at this number (confirmation required).
- Sells: Flat (Stop loss: N/A).
GBP/USD:
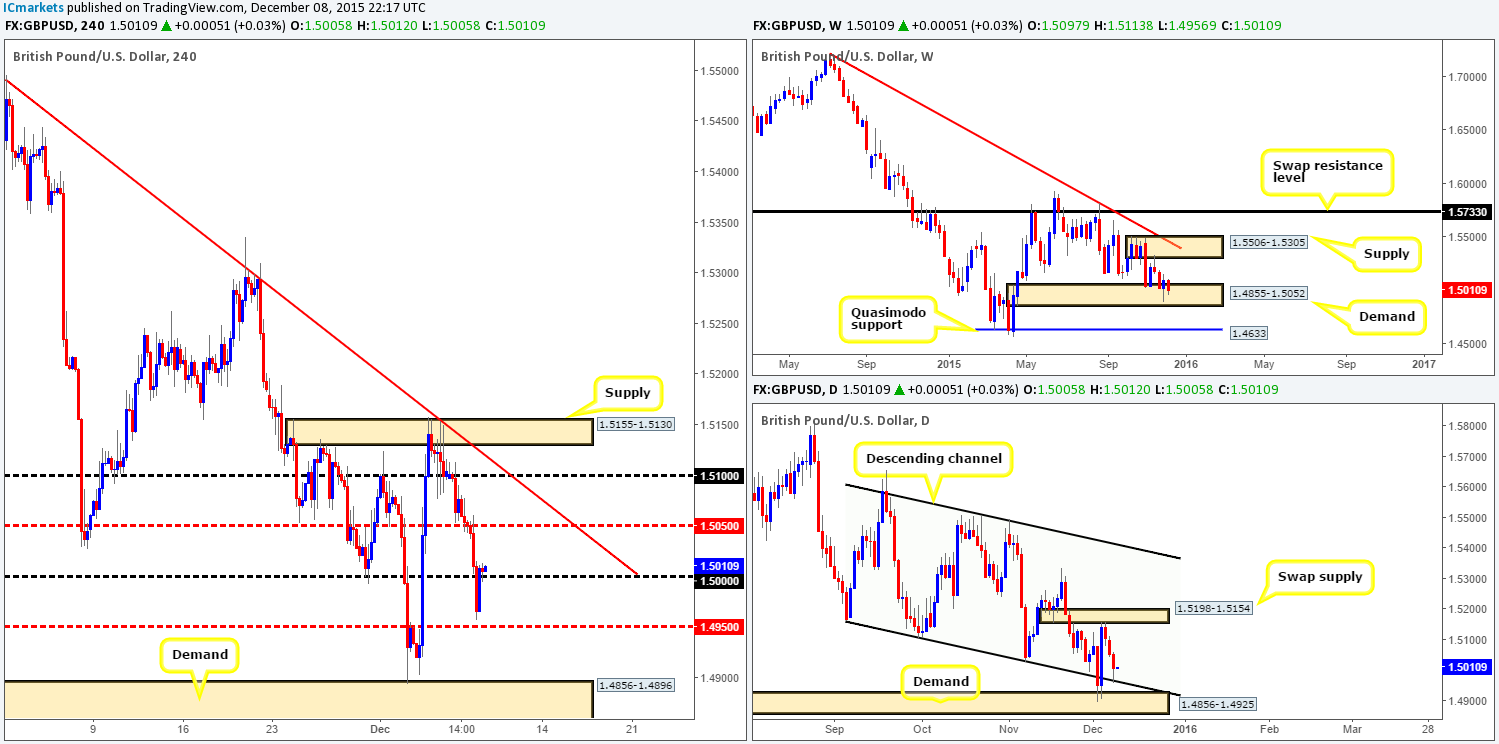
Cable came alive going into yesterday’s London trade, as the sellers hammered this market south, reaching lows of 1.4956 on the day. It was from this point, the American open, did things turn around and break back above the large psychological resistance 1.5000, which, at the time of writing, is holding as support.
As long as 1.5000 continues to hold firm today, we should see this pair rally up to at least mid-level resistance 1.5050, or possibly even psychological resistance 1.5100. We say this because weekly action remains loitering within demand at 1.4855-1.5052, and price on the daily timeframe has just touched gloves with a channel support line drawn from the low 1.5162.
Therefore, our plan of attack today will consist of looking for lower timeframe buy entries around 1.5000, targeting 1.5050 as our first take-profit zone.
Levels to watch/ live orders:
- Buys: 1.5000 [Tentative – confirmation required] (Stop loss: dependent on where one confirms this level).
- Sells: Flat (Stop loss: N/A).
AUD/USD:
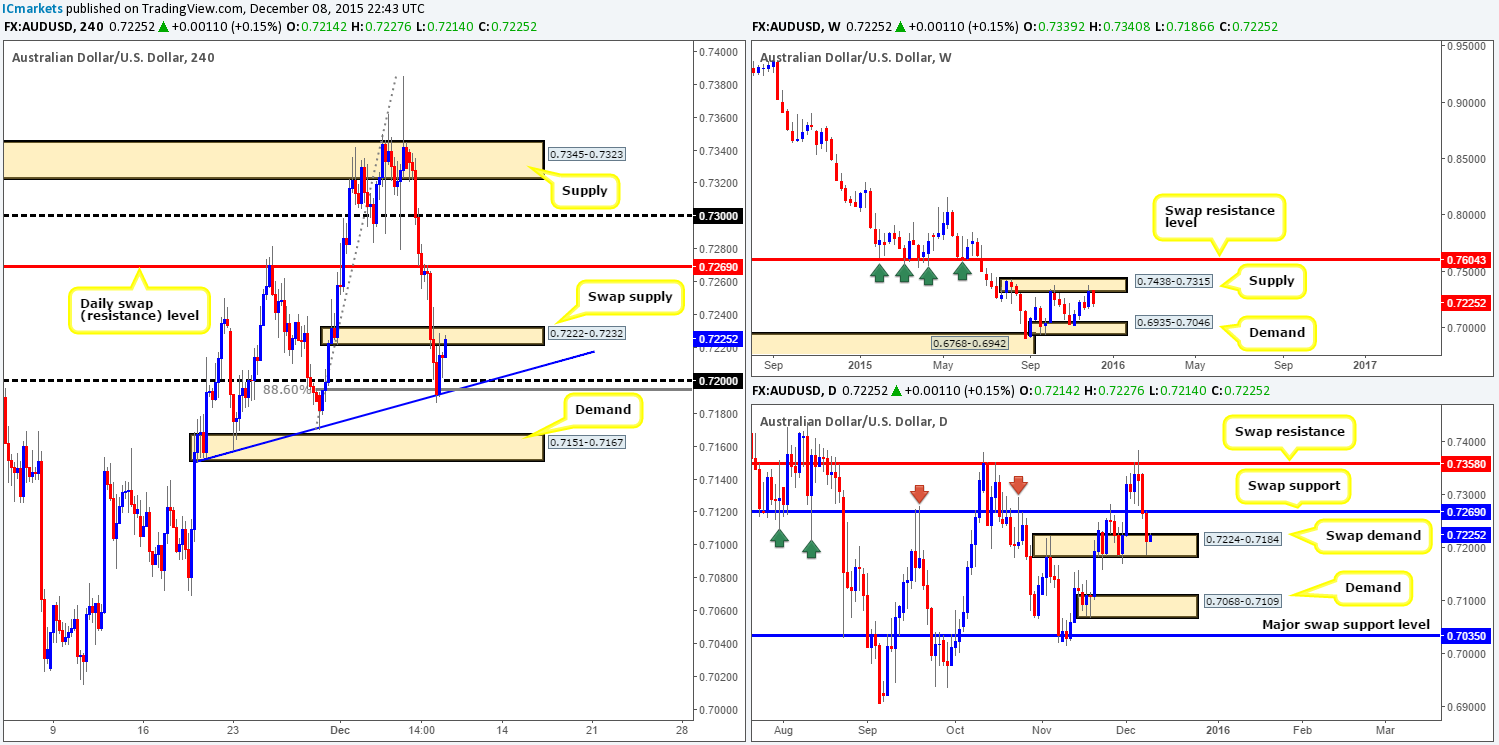
Following the close below the daily swap (support) level at 0.7269, price retested this beauty on the H4 as resistance and sold off into the early hours of yesterday’s trade, consequently recording its second consecutive daily loss. This southerly assault ended with price rebounding from a H4 trendline extended from the low 0.7153. This was no ordinary trendline, however, asitconverged beautifully with a daily swap (demand) area at 0.7224-0.7184, a deep 88.6% Fibonacci level at 0.7195 and the psychological support 0.7200, which we unfortunately missed completely! The response from here so far has pushed the Aussie up to a recently engulfed demand (now supply) at 0.7222-0.7232.
Given the above, here is what we have jotted down so far:
- A break above the current H4 swap supply could open the gates for prices to challenge the daily swap resistance level at 0.7269. However, we’ll pass on this, since the Aussie recently sold off from a proven weekly supply coming in at 0.7438-0.7315.
- That leaves us with shorts… As should be obvious from the H4 structure, there is little room to sell into this market right now. In fact, for us to be confident sellers in this market, we’d need to see price consume H4 demand at 0.7151-0.7167, as this would also take out the above said daily swap (demand) area as well.
Levels to watch/ live orders:
- Buys: Flat (Stop loss: N/A).
- Sells: Flat (Stop loss: N/A).
USD/JPY:
This morning’s analysis for the USD/JPY pair will kick-off with a look at the weekly chart. From this angle, price has been loitering mid-range between supply at 125.27-124.11, and a swap support area at 122.01-121.40 for over four weeks now. Moving down to the daily structure, however, the weekly ranging motion becomes more prominent. A clearly defined consolidation zone has formed between resistance at 123.59 and support drawn from 122.22. Turning our attention to the H4 timeframe, we can see that the sell-side of this market was clearly the more dominant yesterday, with price tumbling down to lows of 122.81, before seeing a slight rebound north by the day’s end.
Given the points made above, battle lines going into to today’s sessions are as follows:
Buys:
- H4 trendline support taken from the low 119.83. Judging by how well this line has held price in the past, we will be keeping an eye on this level for possible (CONFIRMED) buy trades today.
- Directly below this line sits demand at 122.22-122.42 – another potential buy zone today since this area effectively forms the lower limits of the above said daily range. Nevertheless, consequent to the amount of hits this level has received we would need to see lower timeframe strength form before considering a trade here.
- Just below this level is psychological support 122.00. This barrier not only sits at the top-side of the weekly swap (support) area mentioned above at 122.01-121.40, it also boasts 50.0% Fibonacci support at 122.01, thus making it a high-probability reversal zone in our book. Dependent on the approach to this number and the time of day, we may consider entering at market here.
Sells:
- Mid-level resistance 123.50 coupled with the H4 Quasimodo resistance level just above it at 123.59. Due to this effectively being the upper boundary for the aforementioned daily range, this area is certainly worth paying attention to. However, our team has come to a general consensus that before a trade can be executed here, lower timeframe selling action would need to be seen due to the possibility of another fakeout just like the one on the 2nd December!

Levels to watch/ live orders:
- Buys: Keep an eye on the H4 trendline for possible longs (Confirmation required). 122.22-122.42[Tentative – confirmation required] (Stop loss: dependent on where one confirms this area) 122.00 [dependent on the approach and time of day, we may enter long here at market] (Stop loss: around the 121.83 area).
- Sells: 123.59/123.50 [Tentative – confirmation required] (Stop loss: dependent on where one confirms this area).
USD/CAD:
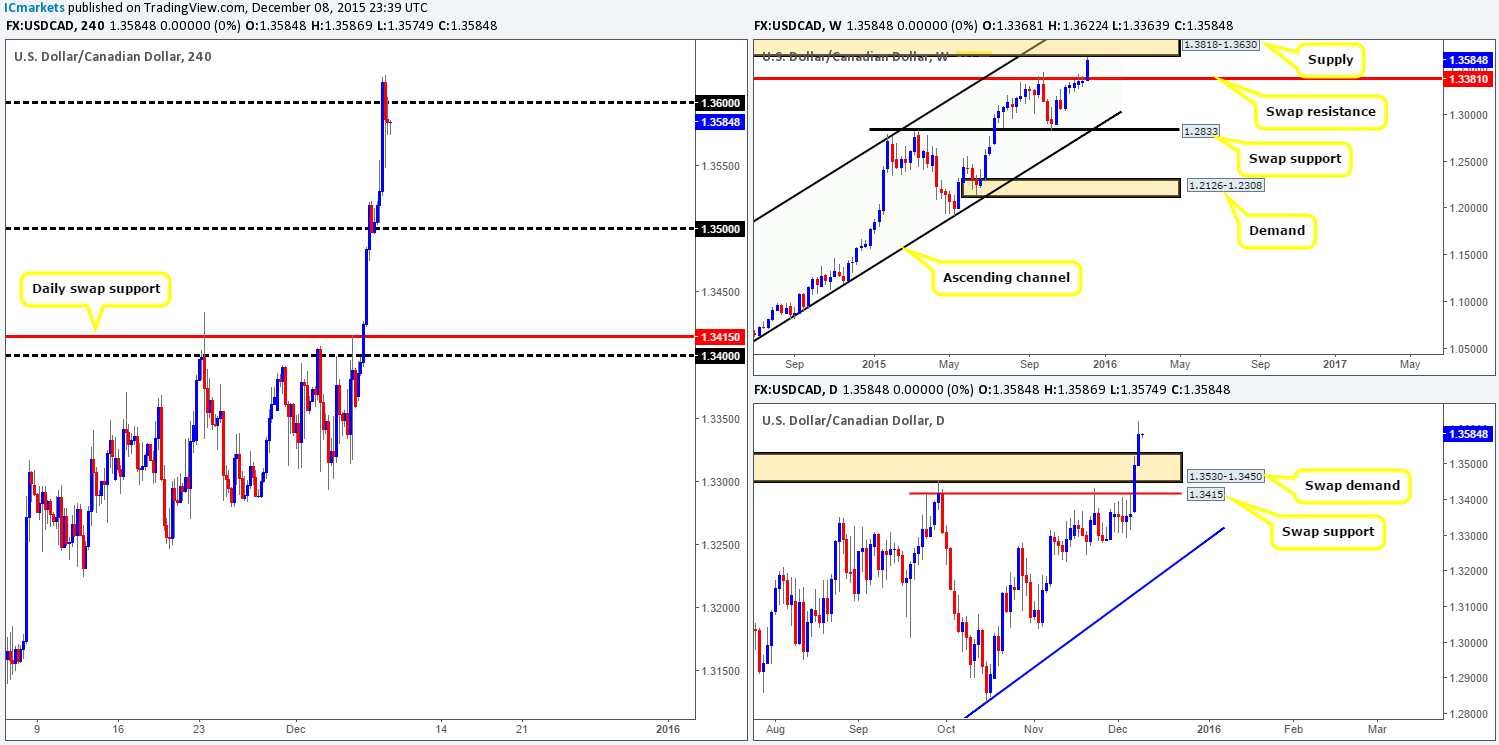
Following the break above and retest of 1.3500, the USD/CAD continued to extend higher yesterday, along with oil dropping below $37/barrel. This upside move faked above psychological resistance 1.3600 and managed to reach highs of 1.3266 on the day, before turning south back below 1.3600.
As a result of this recent advance, we can see that weekly action came so very close to connecting with supply at 1.3818-1.3630. Down on the daily timeframe, however, the market closed above supply (now demand) at 1.3530-1.3450, suggesting further upside could be possible towards Quasimodo resistance coming in at 1.3721 (located within the aforementioned weekly supply).
Taking the above into consideration, we believe, at least technically, there is room for this market to depreciate down to at least the 1.3500 mark today. However, trading against this current upside momentum (and the fact that daily movement is suggesting a move higher is on the cards – see above) is not something we’re comfortable with. As such, remaining flat until more conducive price action presents itself is the route we’ve chosen to take.
Levels to watch/ live orders:
- Buys: Flat (Stop loss: N/A).
- Sells: Flat (Stop loss: N/A).
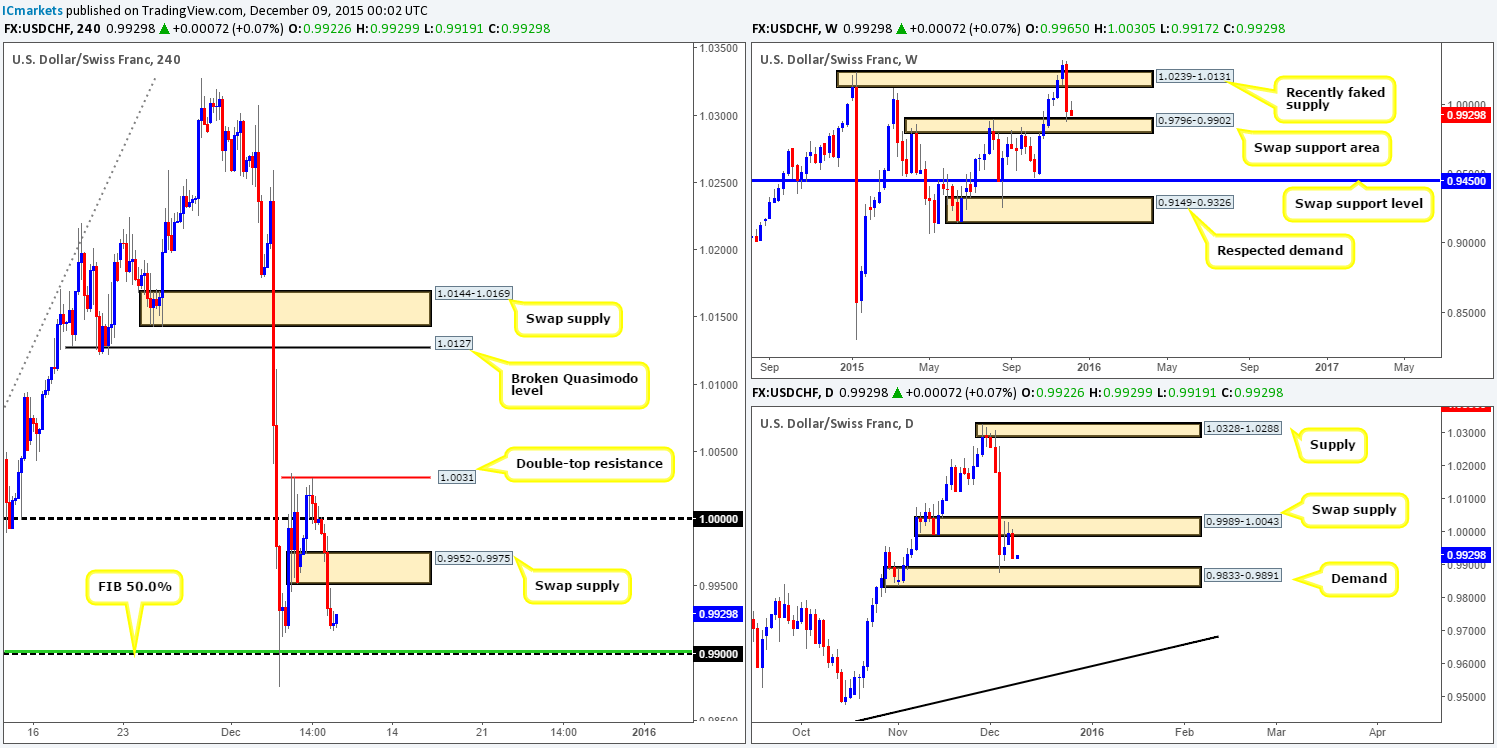
USD/CHF:
In the thick of trade yesterday, the USD/CHF pair fell sharply. Demand (now supply) at 0.9952-0.9975 was completely annihilated, with price reaching lows of 0.9917 by the day’s end.
Despite this recent decline in value, our team still favors the upside. Below yesterday’s low sits psychological support 0.9900, which, as you can see, merges nicely with the 50.0% Fibonacci level at 0.9901. What is more, 0.9900 represents the top-side of the weekly swap (support) area at 0.9796-0.9902, and also hovers just above daily demand drawn from 0.9833-0.9891. Therefore, we are quite confident that should prices reach 0.9900 today, there will highly likely be a reaction seen which we’re very interested in trading.
While a bounce from this area is likely, fixed levels such as these have proved incredibly difficult to trade since fakeouts are so common. What we have found to be the best remedy in such situations is to wait for lower timeframe confirming price action to present itself before considering the number to be legit. That way, one usually misses any fakeout that takes place and has a defined area to place one’s stop (for details on how to confirm an area, please see the top of this page).
Levels to watch/ live orders:
- Buys: 0.9900 [Tentative – confirmation required] (Stop loss: dependent on where one confirms this level).
- Sells: Flat (Stop loss: N/A).
DOW 30
There was not much hope for any buying yesterday, as the DOW spiraled south taking out a H4 swap support (now resistance) at 17658, managing to reach lows of 17482 on the day. Directly below current price, there’s a near-term H4 swap support level coming in at 17440 which merges relatively nicely with the 61.8% Fibonacci level at 17407. This barrier has withstood two bearish attacks butunfortunately has no higher timeframe converging support. To the upside, however, the swap resistance mentioned above at 17658 is a level which has great swap level history, but also has little higher timeframe converging resistance.
Although both levels lack higher timeframe backing, we will still be keeping a close eye on these barriers for confirmed intraday bounces today. However, given that price sold off from the underside of a weekly trendline taken from the high 18365, and from the underside of a daily supply zone drawn from 17977-17872, we are also watching the following levels:
- H4 trendline drawn from the low 16889. We like this trendline simply because it converges beautifully with daily demand seen at 17133-17314. Waiting for the lower timeframes to confirm strength exists here might be the best path to take since trendlines are, in our humble opinion, not the most stable of lines to trade from.
- The weekly swap (support) mentioned above at 17135. Granted, this level is a little way off yet, but still one to have firmly planted on your watch list! One only has to look at the weekly chart to see how significant this hurdle has been to this market in the past. Confirmation would once again be required here due to the risk of a deep fakeout.

Levels to watch/ live orders:
- Buys: 17440 [Tentative – confirmation required] (Stop loss: dependent on where one confirms this level). H4 trendline drawn from the low 16889 [Tentative – confirmation required] (Stop loss: dependent on where one confirms this line). 17135 [Tentative – confirmation required] (Stop loss: dependent on where one confirms this level).
- Sells: 17658 [Tentative – confirmation required] (Stop loss: dependent on where one confirms this level).
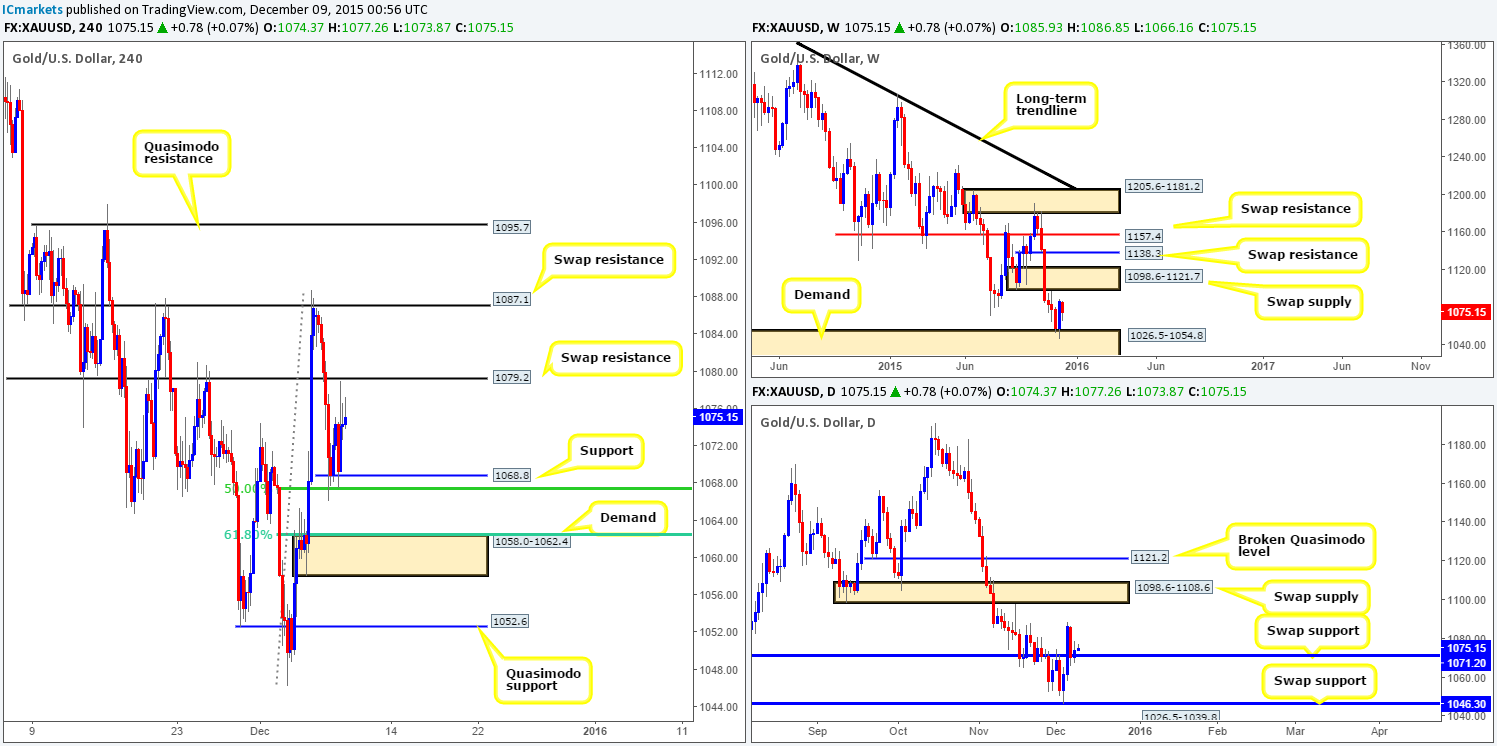
XAU/USD: (Gold)
Coming at you directly from the weekly timeframe this morning, current action remains capped between demand at 1026.5-1054.8 and a swap supply zone at 1098.6-1121.7. Zooming in and looking at the daily picture, however, shows us that the swap support hurdle seen at 1071.2 is so far holding firm. Despite this though, as we move down to the H4 timeframe, yesterday’s action reveals that price rallied directly into offers sitting at a swap resistance level drawn from 1079.2.
Therefore, in a nutshell we have the following to work with:
- Weekly showing little direction at present as it lingers between two opposing structures (see above).
- Daily establishing support from around 1071.2, but has yet to show any noteworthy buying from here.
- Consequent to yesterday’s rebound from the H4 swap resistance level mentioned above at 1079.2, H4 action is now capped between this barrier and support (coincides with the 50.0% Fibonacci level at 1067.4) seen at 1068.8.
With the above points in mind, we’ll be watching support at 1068.8 for confirmed buys today. In addition to this, we’ll also be keeping a tab on the demand area just below it at 1058.0-1062.4 since it merges with the 61.8% Fibonacci level at 1062.0. In addition to this, should Gold break above 1079.2 and retest it as support, we may, dependent on how the lower timeframes behave following the retest, look to buy this market up to the swap resistance level at 1087.1, followed by the Quasimodo resistance at 1095.7 (located just below both a weekly and daily swap supplies (1098.6-1121.7/1098.6-1108.6).
Levels to watch/ live orders:
- Buys: 1068.8 [Tentative – confirmation required] (Stop loss: dependent on where one confirms this level). 1058.0-1062.4 [Tentative – confirmation required] (Stop loss: dependent on where one confirms this area). Watch for offers to be consumed around 1079.2 and then look to trade any retest seen at this number (confirmation required).
- Sells:Flat (Stop loss: N/A).


