
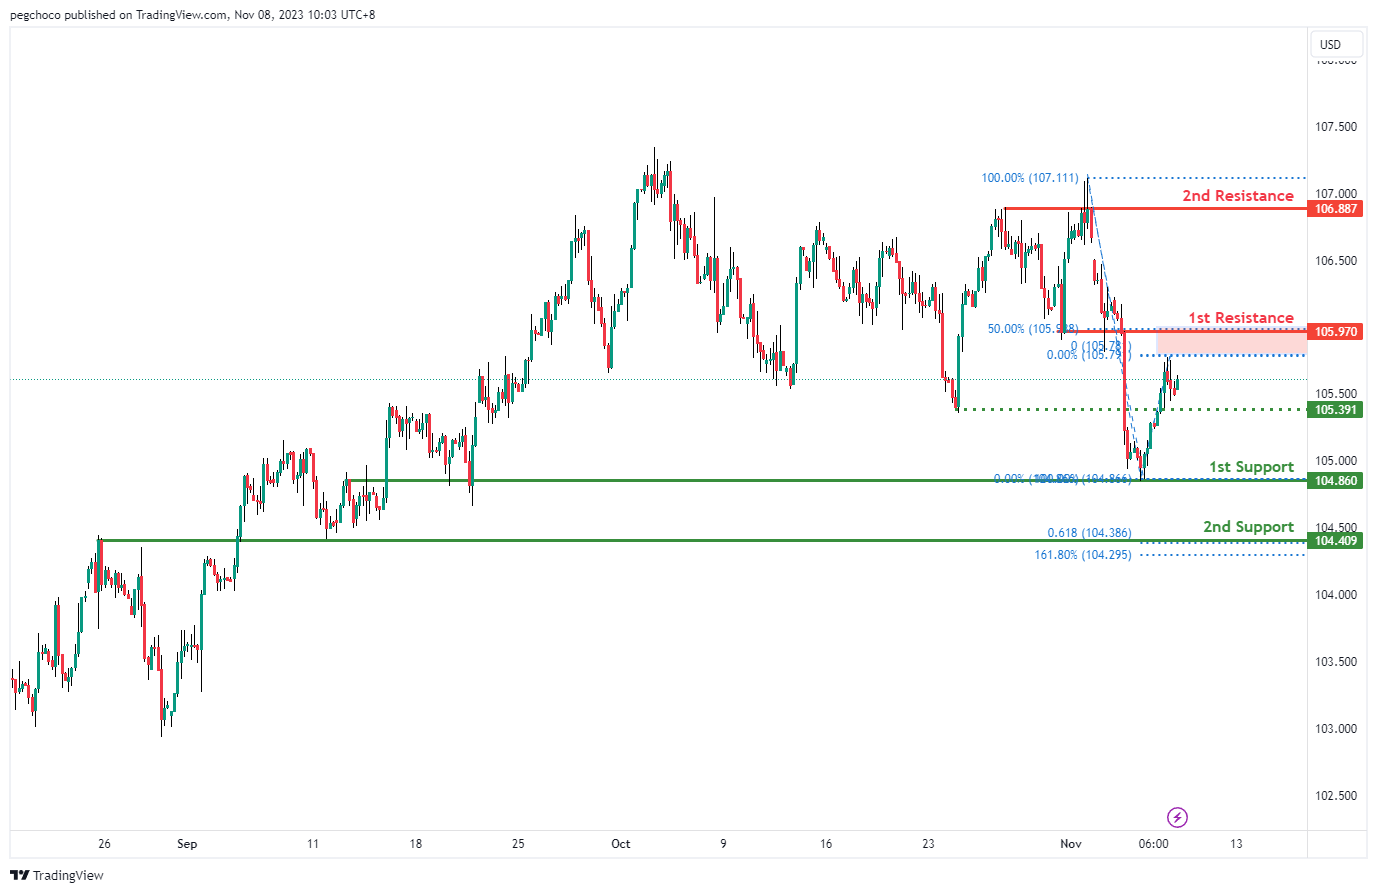
DXY:
The DXY (US Dollar Index) chart currently exhibits a bearish overall momentum, suggesting the potential for a bearish reaction off the 1st resistance level, followed by a drop towards the 1st support level.
The 1st support at 104.86 is identified as an overlap support, indicating it could be a significant level where the price might find support. Additionally, the 2nd support at 104.40 is considered an overlap support and is reinforced by the presence of the 161.80% Fibonacci Extension and the 61.80% Fibonacci Projection, indicating Fibonacci confluence. This makes it a strong support zone where buyers may step in.
On the resistance side, the 1st resistance at 105.97 is categorized as a pullback resistance, suggesting it could act as a level where the price faces selling pressure and potentially reverses its bearish movement.
Furthermore, the 2nd resistance at 106.88 is identified as a multi-swing high resistance, indicating another potential level where the price may encounter obstacles in its upward movement.
Intermediate support at 105.39 is noted as a pullback support, providing an additional support level to watch for potential price movements.
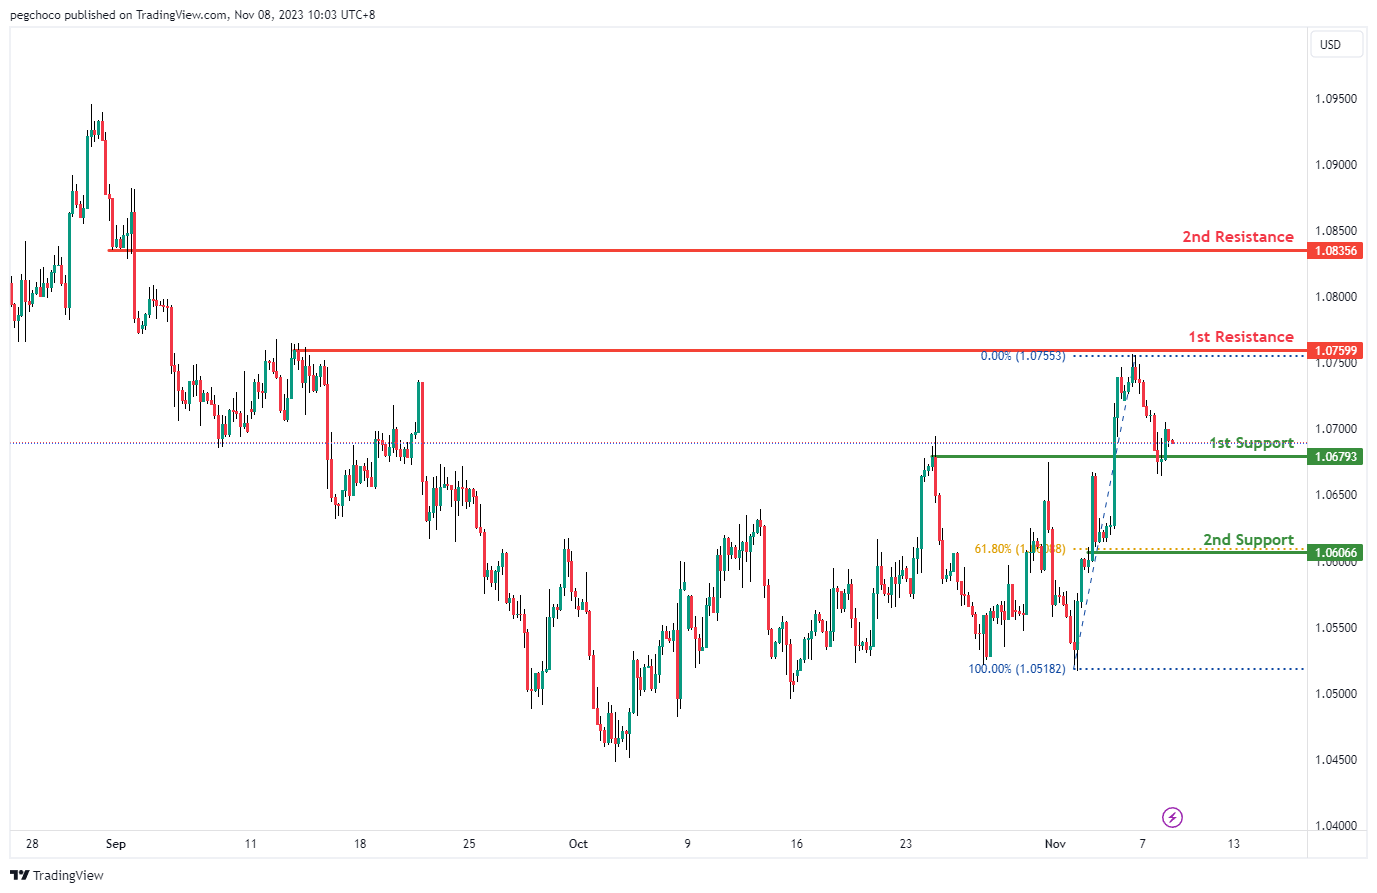
EUR/USD:
The EUR/USD chart currently exhibits a bullish overall momentum, indicating the potential for a bullish continuation towards the 1st resistance level.
The 1st support at 1.0679 is identified as an overlap support, suggesting it could be a significant level where the price may find buying interest. Additionally, the 2nd support at 1.0606 is reinforced by the presence of the 61.80% Fibonacci Retracement, making it another strong support level.
On the resistance side, the 1st resistance at 1.0759 is categorized as a multi-swing high resistance, indicating it could act as a level where the price faces selling pressure and may encounter obstacles in its upward movement.
Furthermore, the 2nd resistance at 1.0835 is identified as a pullback resistance, suggesting it could also serve as a point where the price may find resistance and potentially reverse.
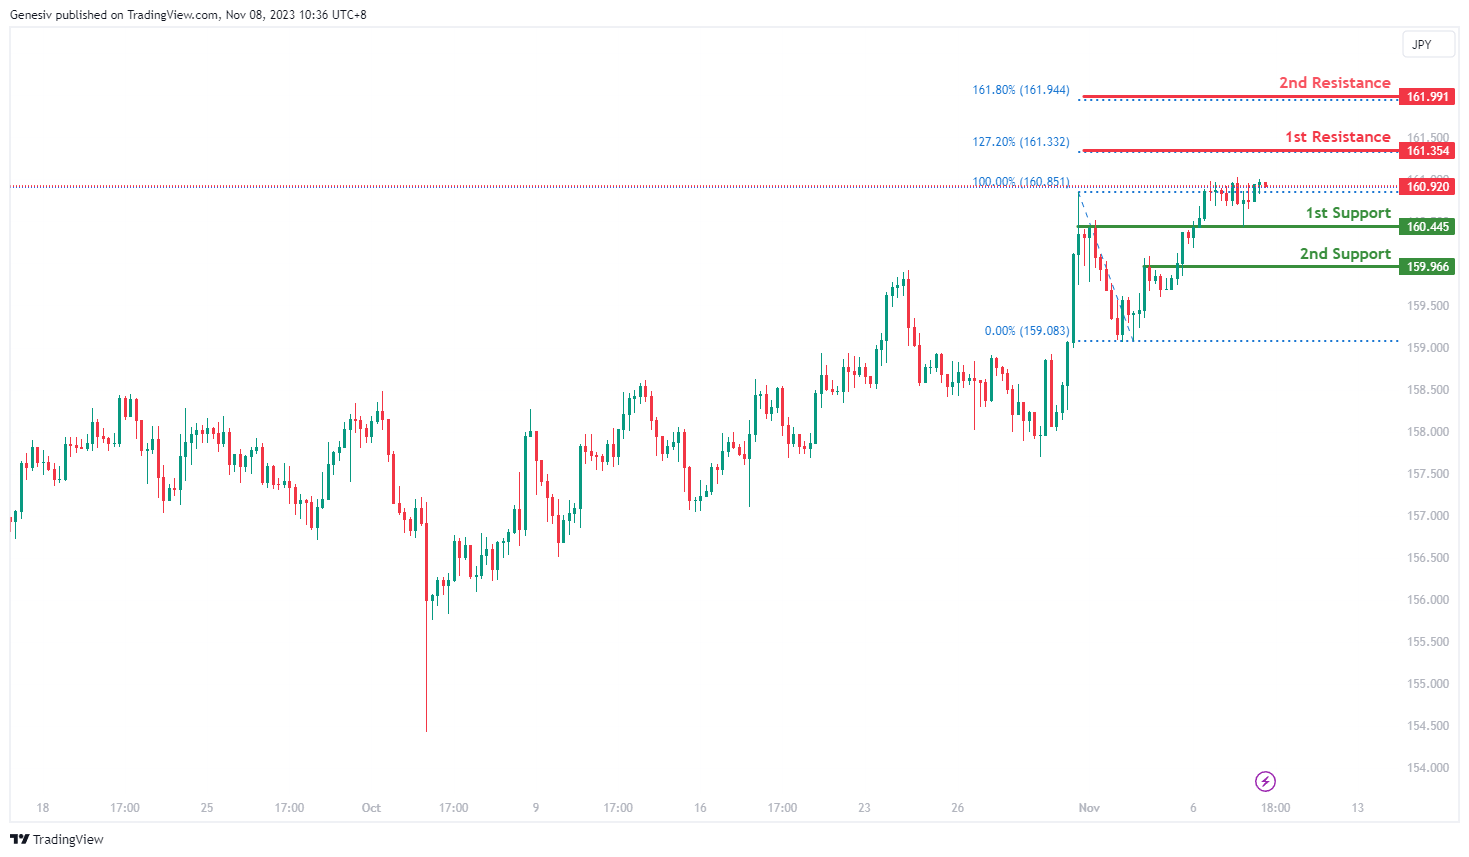
EUR/JPY:
For EUR/JPY, considering the current bearish momentum in the chart, there’s a potential scenario where the price could increase towards the first resistance in the short term before reversing from that level and dropping towards the first support.
The first support at 160.45 is identified as an overlap support, marking a significant level where the price might find substantial support during a potential decline in the bearish trend.
The second support at 159.96 is recognized as a level of pullback support, indicating an additional area that might offer crucial support in case of a price decline within the bearish trend.
On the resistance side, the first resistance at 161.35 is associated with the 127.20% Fibonacci Extension, presenting a level that may act as a significant barrier to the price’s upward movement in the short term within the prevailing bearish scenario.
Furthermore, the second resistance at 161.99 is identified as a level coinciding with the 161.80% Fibonacci Extension, suggesting it as an additional substantial obstacle to the price’s upward movement within the current bearish trend.
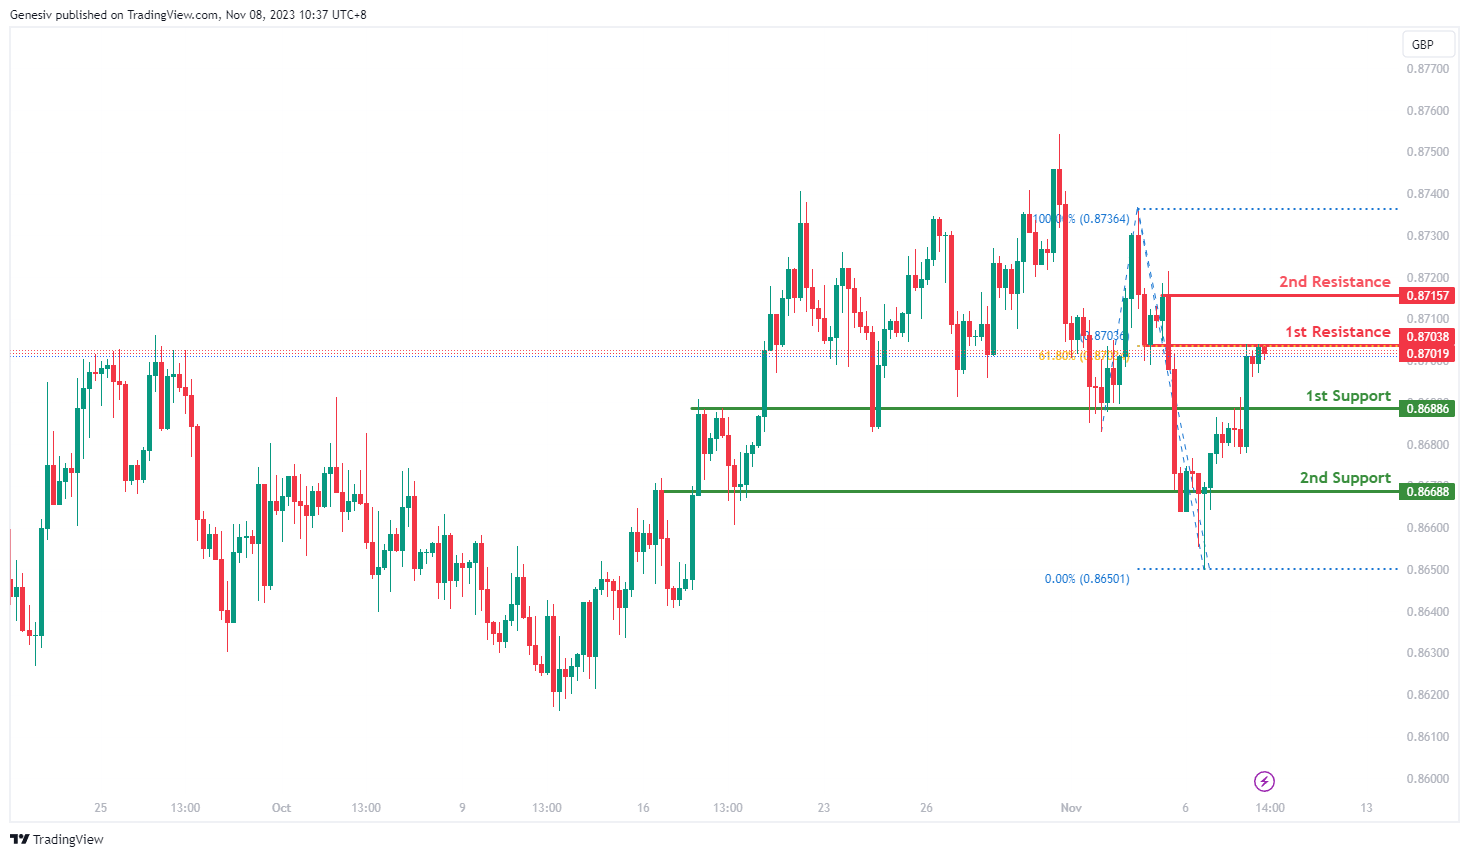
EUR/GBP:
For EUR/GBP, given the bearish momentum in the chart, there’s a potential scenario where the price might exhibit a bearish reaction off the first resistance and subsequently drop towards the first support.
The first support at 0.8688 is identified as a level of pullback support, suggesting it could serve as a significant area where the price might find substantial support during a potential decline in the bearish trend.
The second support at 0.8668 is also recognized as pullback support, indicating an additional area that could offer crucial support in case of a price drop within the bearish trend.
On the resistance side, the first resistance at 0.8703 is characterized as an overlap resistance, coinciding with the 61.80% Fibonacci Retracement and the 100% Fibonacci Projection. This convergence of Fibonacci levels suggests it as a key level where the price might face considerable resistance and potentially trigger a bearish move.
Additionally, the second resistance at 0.8715 is identified as a swing high resistance, indicating it as an additional substantial barrier to the price’s upward movement within the prevailing bearish trend.
.
GBP/USD:
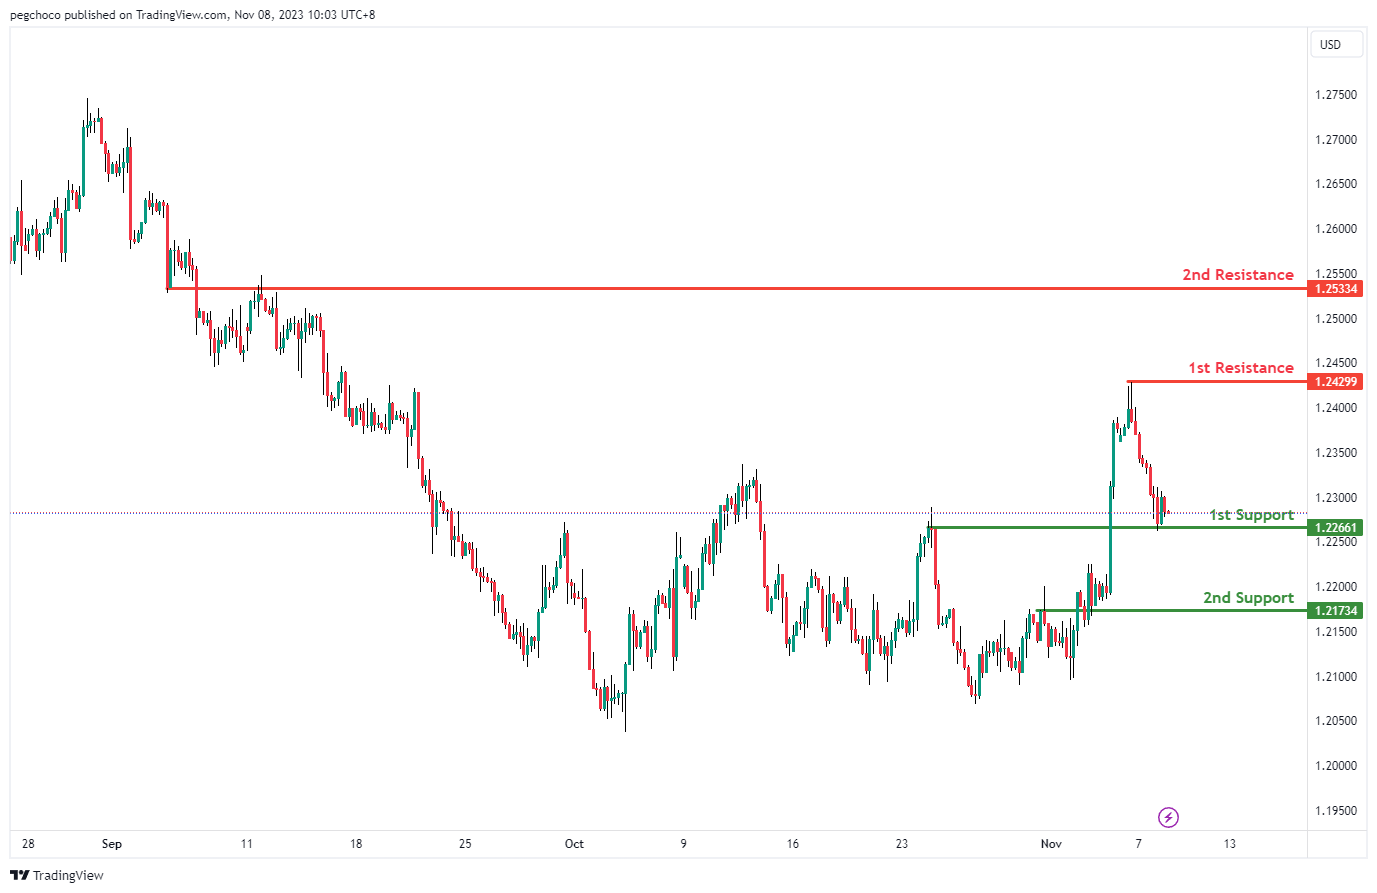
The GBP/USD chart currently exhibits a bullish overall momentum, suggesting the potential for a bullish bounce off the 1st support level and a move towards the 1st resistance.
The 1st support at 1.2266 is identified as an overlap support, indicating it could be a significant level where the price might find buying interest. Additionally, the 2nd support at 1.2173 is reinforced by the presence of an overlap support, further strengthening its potential as a support level.
On the resistance side, the 1st resistance at 1.2429 is categorized as a swing high resistance, suggesting it could act as a level where the price faces selling pressure and may encounter obstacles in its upward movement.
Furthermore, the 2nd resistance at 1.2533 is identified as an overlap resistance, indicating another potential level where the price may find resistance.
GBP/JPY:
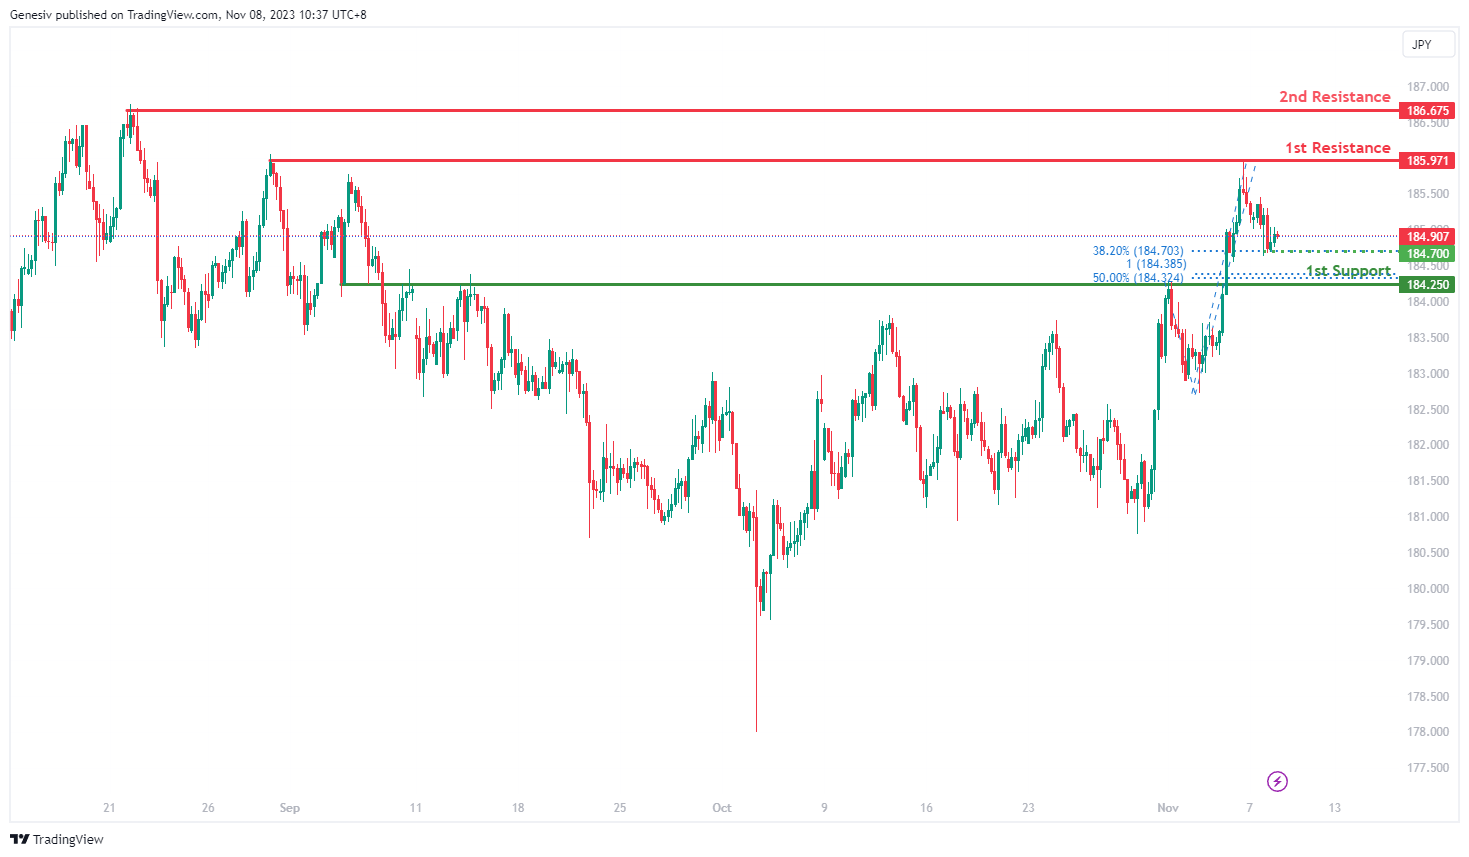
For GBP/JPY, considering the current bearish momentum in the chart, there’s a potential scenario where the price might continue in a bearish direction towards the first support level.
The first support at 184.25 is identified as a crucial level of pullback support, coinciding with both the 50% Fibonacci Retracement and the 100% Fibonacci Projection. This confluence of Fibonacci levels indicates a significant area where the price could potentially find strong support and initiate a rebound within the bearish trend.
The intermediate support at 184.70 is also considered a relevant level, marked as a swing low support and aligned with the 38.20% Fibonacci Retracement. It further reinforces this area as a potential support level within the bearish trajectory.
On the resistance side, the first resistance at 185.97 is identified as a multi-swing high resistance, indicating it as a significant barrier that the price may struggle to surpass during a bearish movement.
Additionally, the second resistance at 186.67 is recognized as a level of swing high resistance, suggesting it as an additional obstacle to the price’s upward movement within the prevailing bearish trend.
USD/CHF:
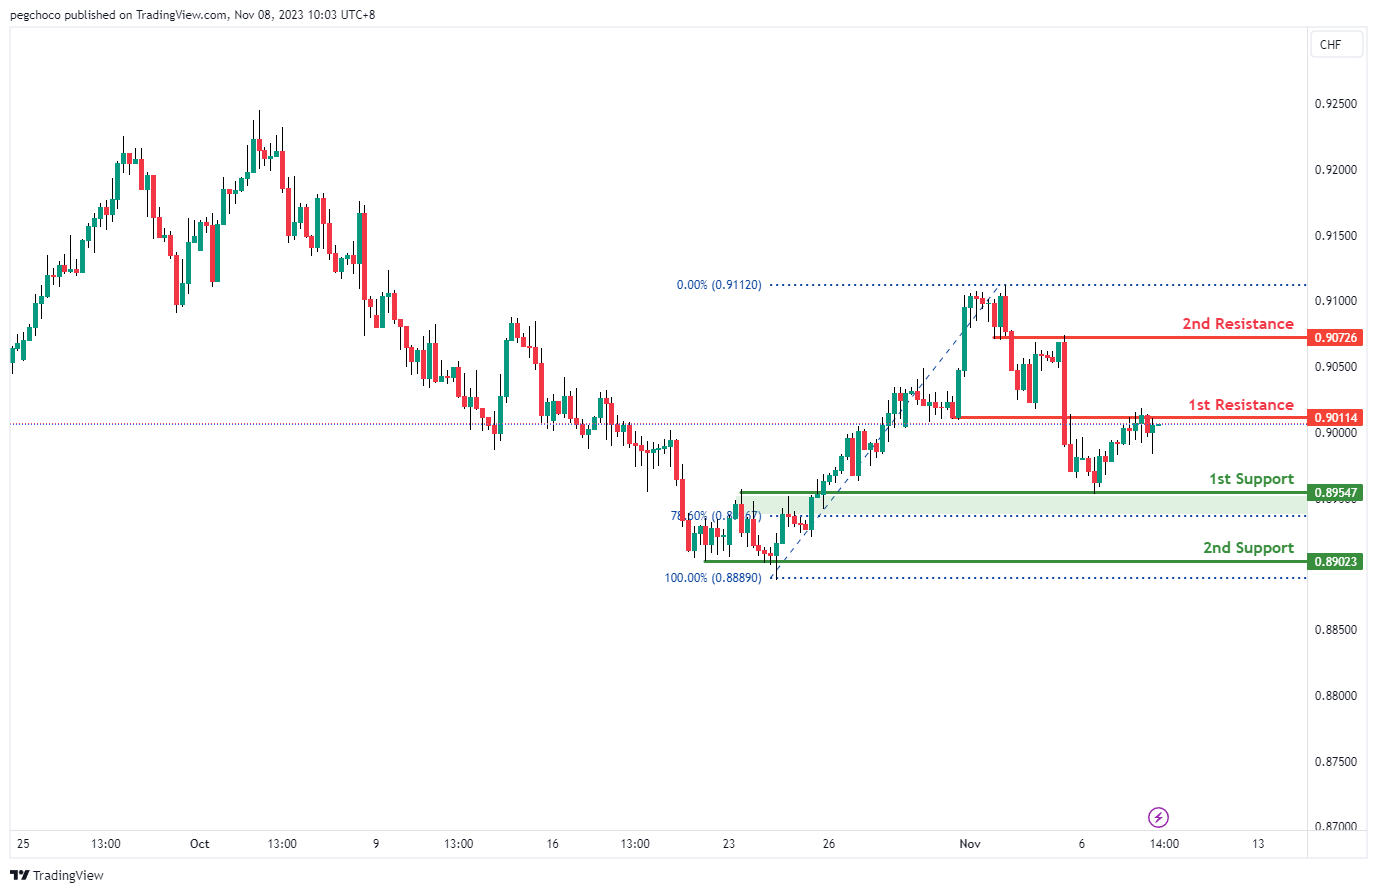
The USD/CHF chart currently has a bearish overall momentum, suggesting the potential for a bearish reaction off the 1st resistance level and a drop towards the 1st support.
The 1st support at 0.8954 is identified as an overlap support, and it also coincides with the 78.60% Fibonacci Retracement level. This makes it a significant level where the price might find buying interest.
Additionally, the 2nd support at 0.8902 is considered a multi-swing low support, further reinforcing its potential as a support level.
On the resistance side, the 1st resistance at 0.9011 is categorized as an overlap resistance, suggesting it could act as a level where the price may face selling pressure and potentially trigger a bearish reaction.
Furthermore, the 2nd resistance at 0.9072 is also identified as an overlap resistance, adding another layer of potential resistance for the price.
.
USD/JPY:
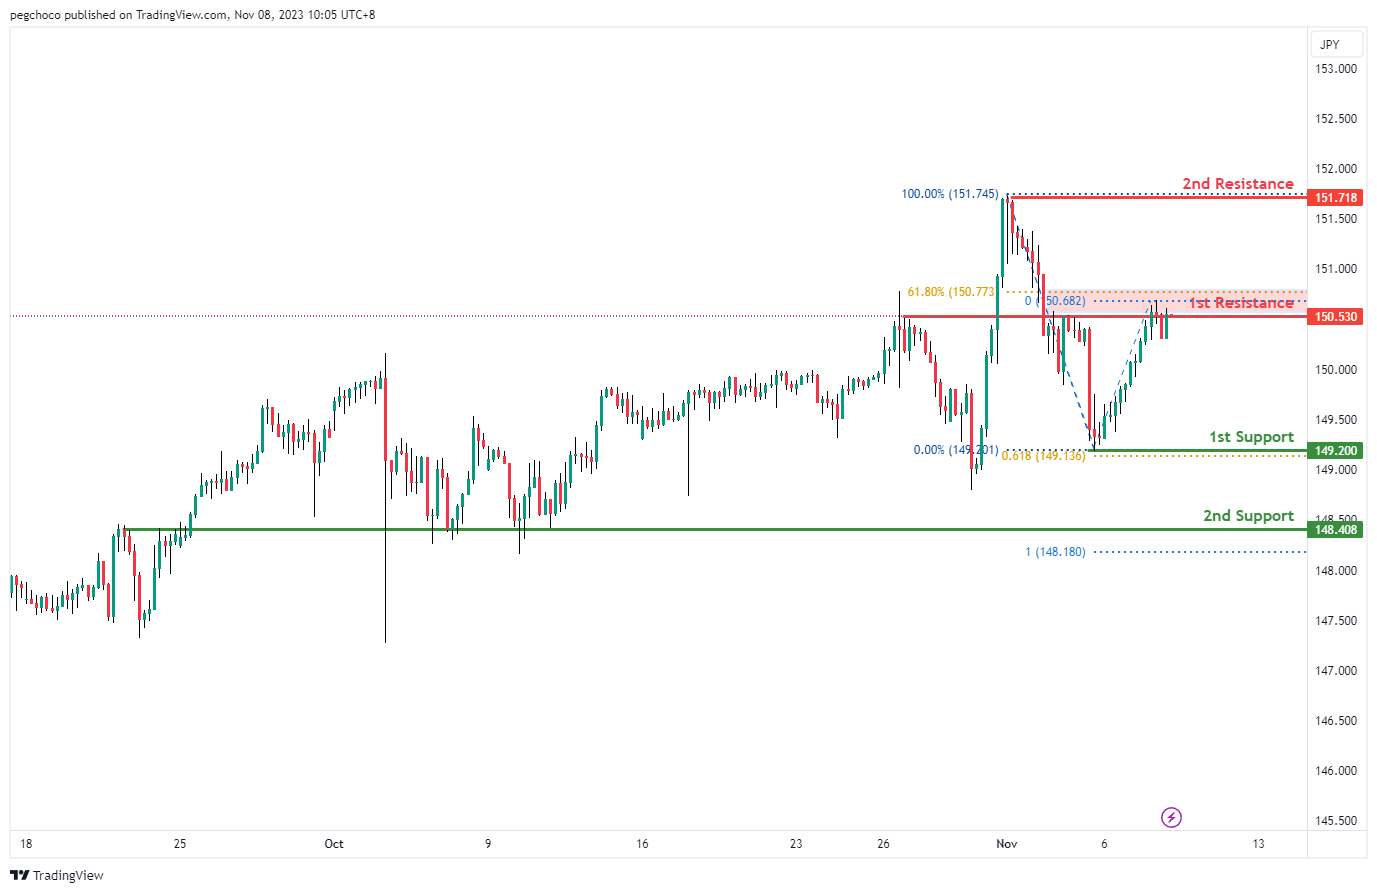
The USD/JPY chart currently exhibits a bearish overall momentum, suggesting the potential for a bearish reaction off the 1st resistance level and a subsequent drop towards the 1st support.
The 1st support at 149.20 is identified as a swing low support and also coincides with the 61.80% Fibonacci Projection level, making it a significant level where the price might find buying interest.
Additionally, the 2nd support at 148.40 is considered an overlap support, which further reinforces its potential as a support level.
On the resistance side, the 1st resistance at 150.53 is categorized as a pullback resistance, and it coincides with the 61.80% Fibonacci Retracement level, suggesting it could act as a level where the price may face selling pressure and potentially trigger a bearish reaction.
Furthermore, the 2nd resistance at 151.71 is identified as a swing high resistance, indicating another potential level where the price may encounter obstacles in its upward movement.
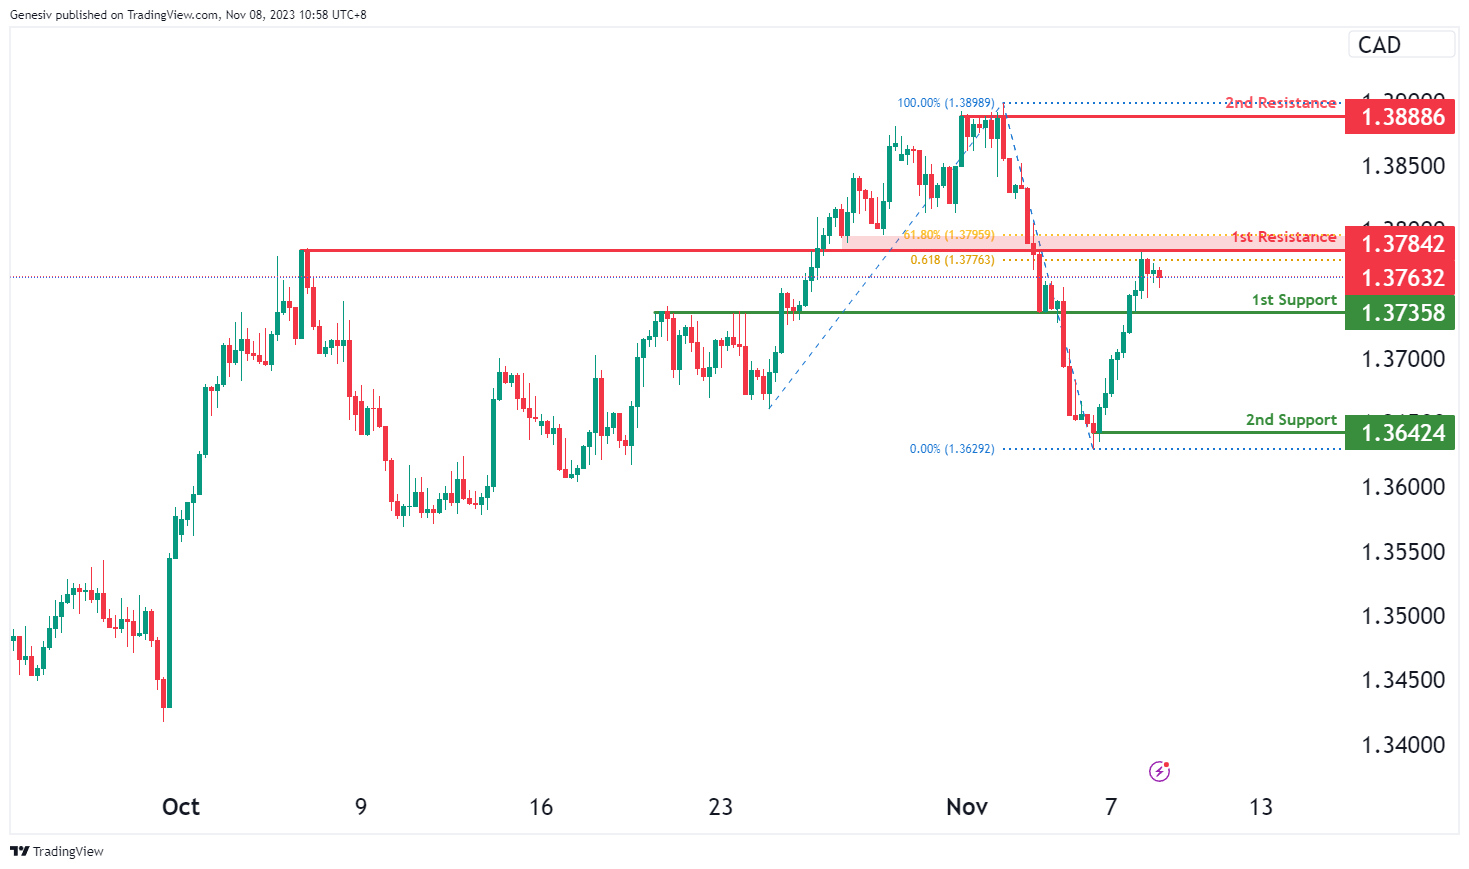
USD/CAD:
The USD/CAD chart is currently exhibiting an overall bullish momentum, indicating a potential for price to make a bullish continuation towards the 1st resistance.
The 1st resistance level at 1.3784 is identified as an overlap resistance that aligns with a confluence of Fibonacci levels i.e. the 61.80% retracement and the 61.80% projection levels. Higher up, the 2nd resistance level at 1.3889 is marked as a pullback resistance, suggesting that it may act as a strong resistance zone.
To the downside, the 1st support level at 1.3736 is identified as an overlap support. Further below, the 2nd support level at 1.3642 is noted as a swing-low support, adding to its potential as a level where price could find support.
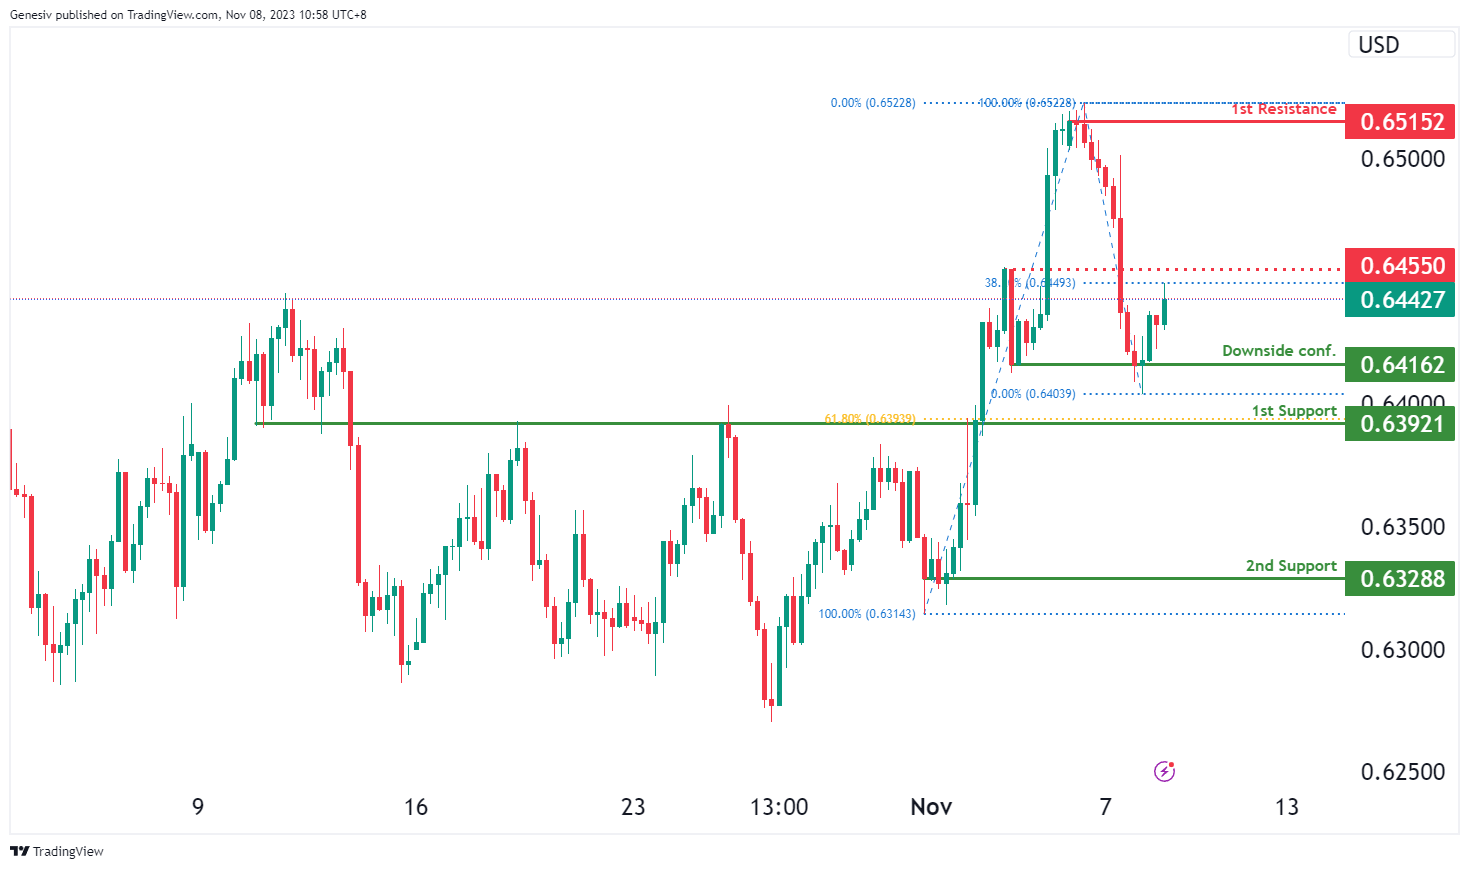
AUD/USD:
The AUD/USD chart is currently characterized by a weak bullish momentum. However, there is potential for a bearish continuation towards the 1st support level should price break below the downside confirmation level.
The downside confirmation level at 0.6416 is identified as a pullback support while the 1st support level at 0.6392 is marked as an overlap support that aligns with the 61.80% Fibonacci retracement level. Further below, the 2nd support level at 0.6329 is noted as a pullback support, reinforcing its potential as a level of support for the price.
On the resistance side, the intermediate resistance level at 0.6455 is identified as a pullback resistance that aligns close to the 38.20% Fibonacci retracement level. Additionally, the 1st resistance level at 0.6515 is marked as a swing-high resistance, indicating another potential obstacle for the price’s upward movement.
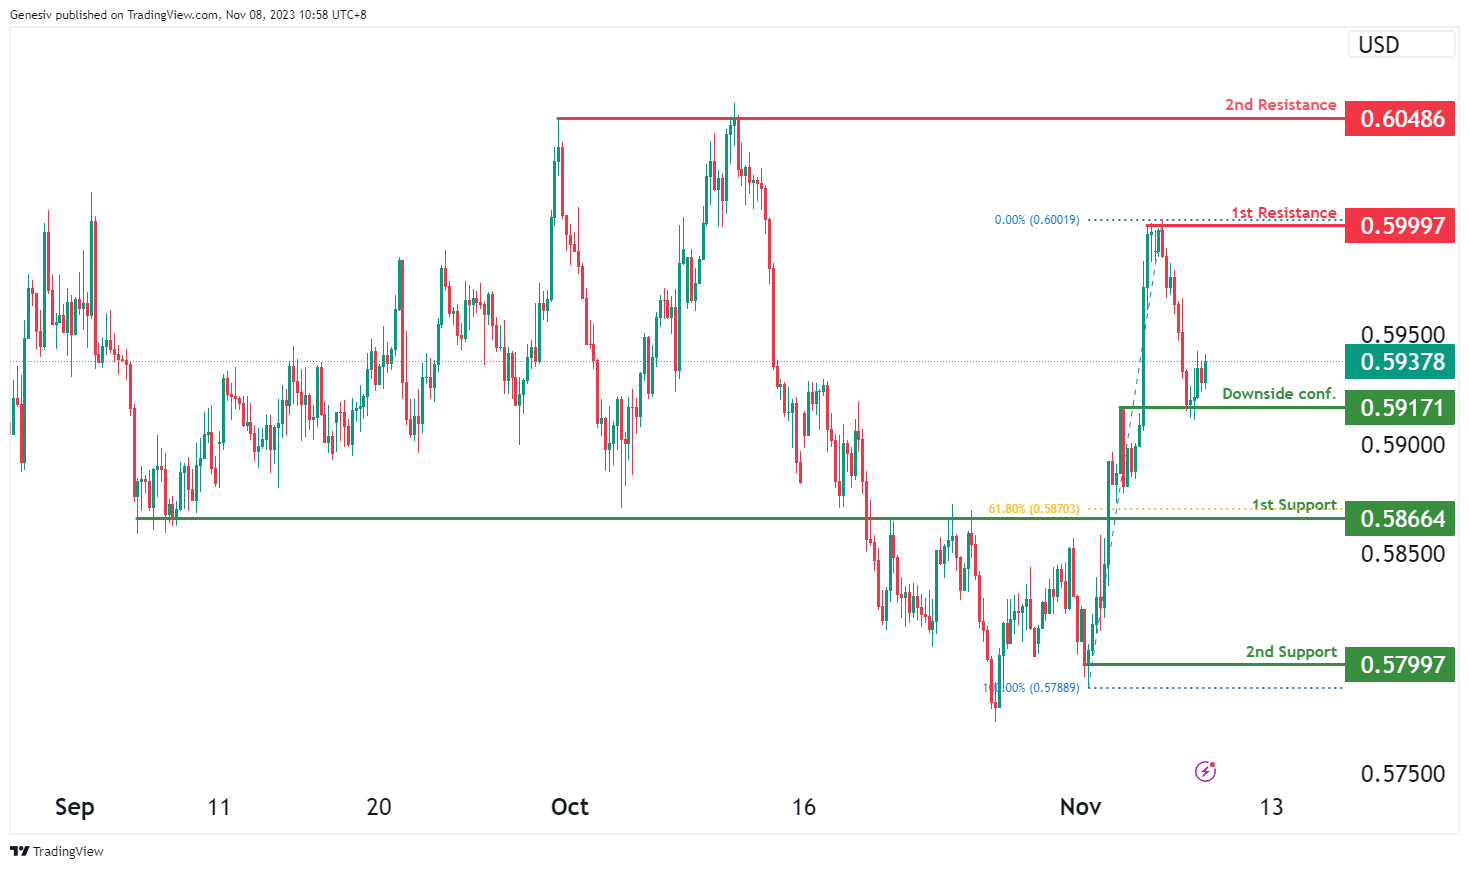
NZD/USD
The NZD/USD chart is currently characterized by a weak bullish momentum. However, there is potential for a bearish continuation towards the 1st support level should price break below the downside confirmation level.
The downside confirmation level at 0.5917 is identified as an overlap support while the 1st support level at 0.5866 is also noted as an overlap support that aligns with the 61.80% Fibonacci retracement level. Further below, the 2nd support level at 0.5799 is marked as a swing-low support, reinforcing its potential significance as a level of support.
On the resistance side, the 1st resistance level at 0.5999 is identified as a swing-high resistance. Higher up, the 2nd resistance level at 0.6049 is marked as a multi-swing-high resistance, indicating another potential level where the price may face obstacles in its upward movement.
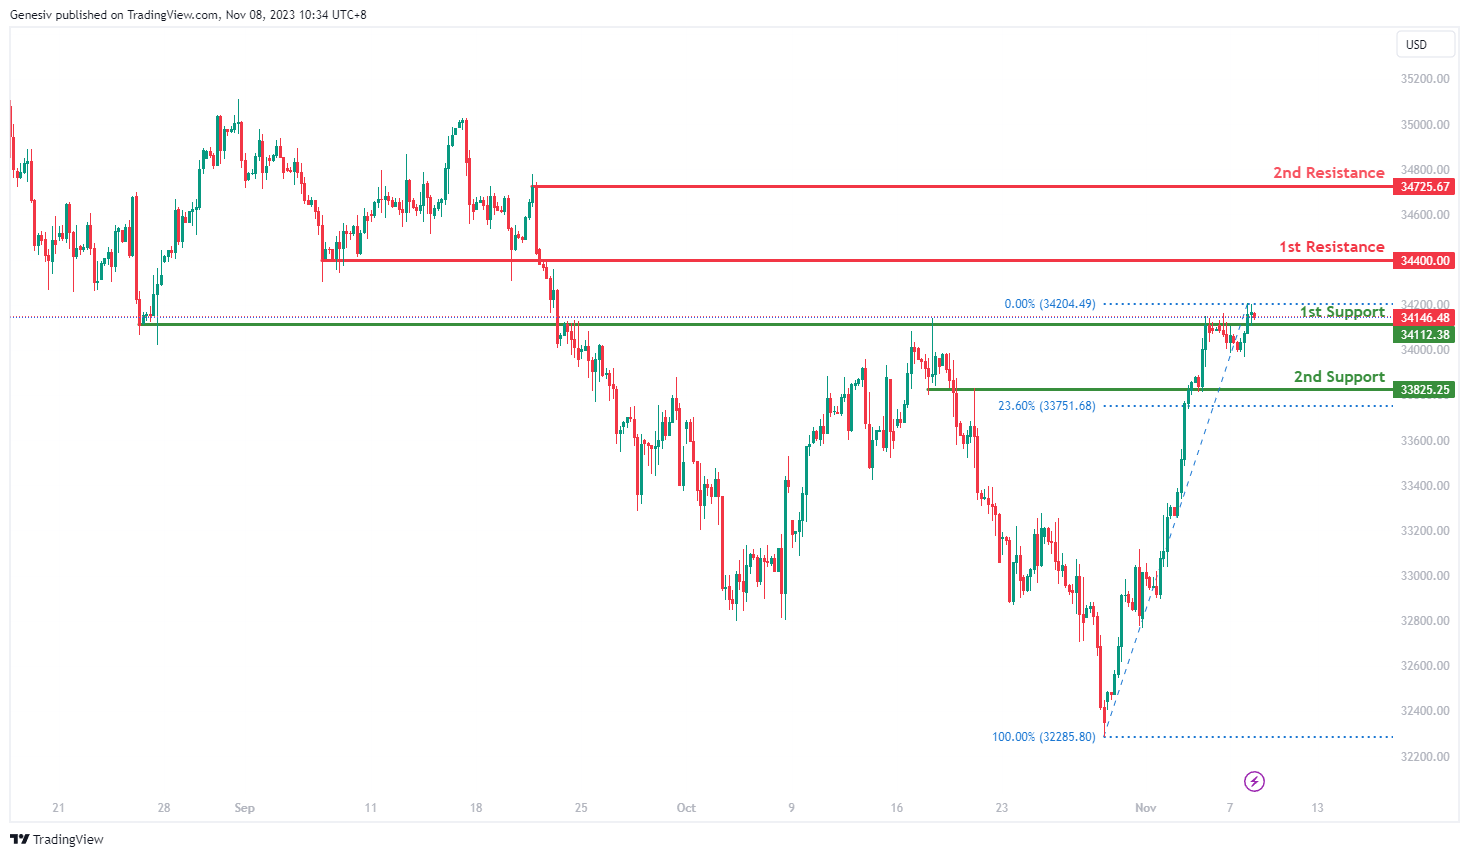
DJ30:
For DJ30, with the current bullish momentum on the chart, there’s a potential scenario where the price might experience a bullish bounce off the first support and move towards the first resistance.
The first support at 34112.38 is identified as an overlap support, indicating a significant level where the price might find substantial support during a potential retracement in the bullish trend.
The second support at 33825.25 is recognized as another overlap support and coincides with the 23.60% Fibonacci Retracement, marking an additional area that might offer crucial support in case of a price decline within the bullish trend.
On the resistance side, the first resistance at 34400.00 is characterized as a level of pullback resistance, representing a significant barrier to the price’s upward movement within the current bullish scenario.
Moreover, the second resistance at 34725.67 is identified as a level of swing high resistance, suggesting it as an additional significant obstacle to the price’s upward movement within the prevailing bullish trend.
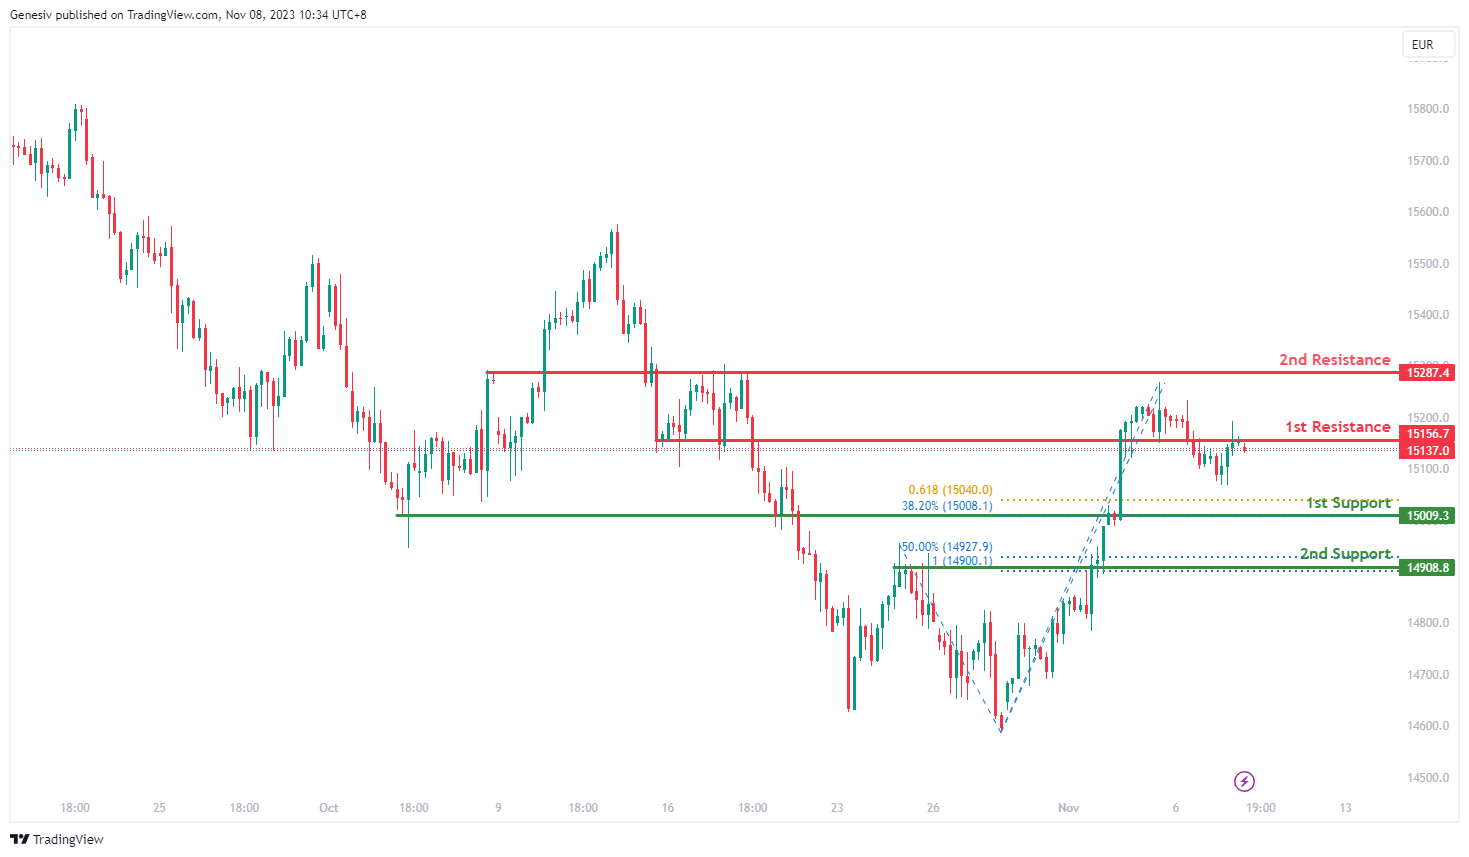
GER40:
For GER40, given the bearish momentum on the chart, there’s a potential scenario where the price might have a bearish reaction off the first resistance and decline towards the first support.
The first support at 15009.30 is identified as a level of pullback support, aligning with both the 38.20% Fibonacci Retracement and the 61.80% Fibonacci Projection, indicating a confluence of Fibonacci levels. This signifies a crucial area where the price might find substantial support during a potential decline within the bearish trend.
The second support at 14908.80 is also recognized as pullback support and coincides with the 50% Fibonacci Retracement and the 100% Fibonacci Projection, further indicating an area where the price might find strong support in case of a bearish move.
On the resistance side, the first resistance at 15156.70 is characterized as an overlap resistance, suggesting it as a significant barrier to the price’s upward movement within the current bearish scenario.
Additionally, the second resistance at 15287.40 is also identified as an overlap resistance, indicating it as an additional significant obstacle to the price’s upward movement in the prevailing bearish trend.
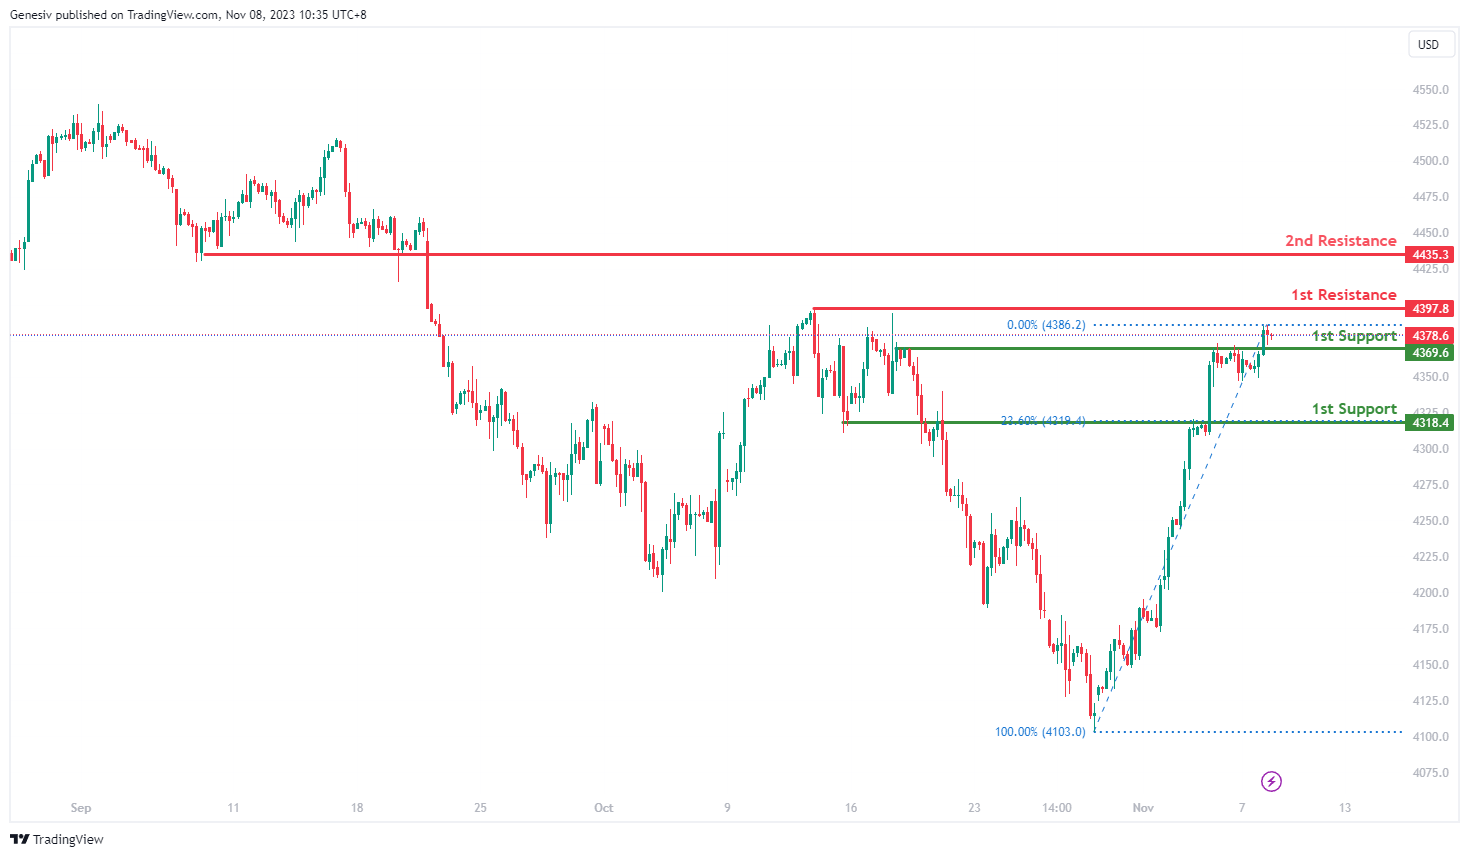
`US500
For US500, with the current bullish momentum in the chart, there’s a potential scenario where the price might experience a bullish bounce off the first support and move towards the first resistance.
The first support at 4369.6 is identified as a level of pullback support, suggesting it as a significant area where the price might find substantial support during a potential retracement in the bullish trend.
The second support at 4318.4 is recognized as another pullback support and aligns with the 23.60% Fibonacci Retracement, marking an additional area that might offer crucial support in case of a price decline within the bullish trend.
On the resistance side, the first resistance at 4397.8 is characterized as a level of swing high resistance, indicating a significant barrier to the price’s upward movement within the current bullish scenario.
Additionally, the second resistance at 4435.3 is identified as pullback resistance, suggesting it as an additional significant obstacle to the price’s upward movement within the prevailing bullish trend.
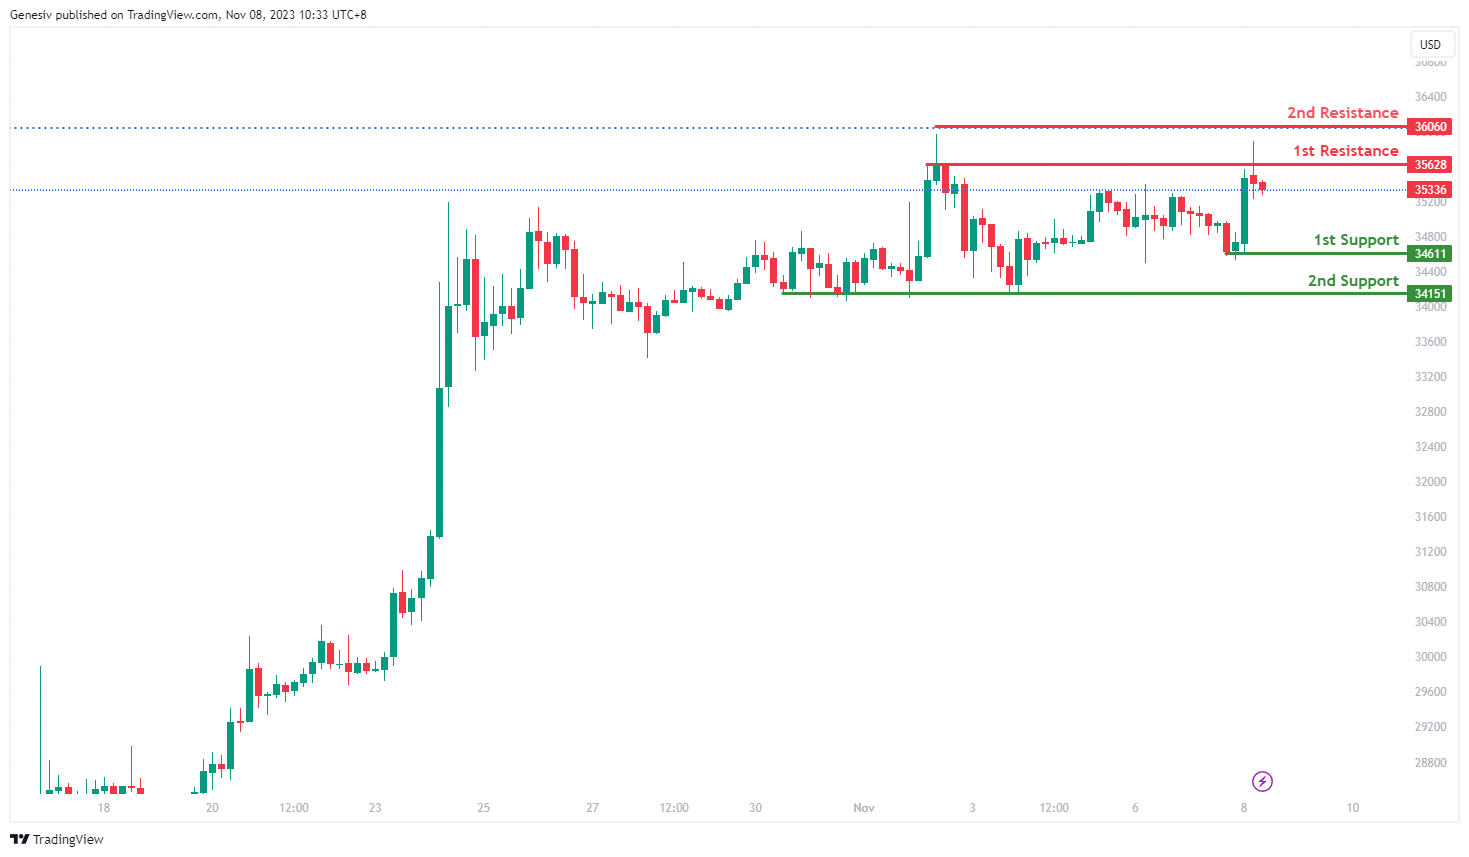
BTC/USD:
For BTC/USD, with the current neutral momentum in the chart, there’s a potential scenario where the price might fluctuate between the first resistance and the first support levels.
The first support at 34611 is identified as a level of swing low support, suggesting it as a significant area where the price might find support during a potential decline or retracement.
The second support at 34151 is recognized as multi-swing low support, providing an additional level that might offer substantial support in case of a price decline within the neutral trend.
On the resistance side, the first resistance at 35628 is characterized as multi-swing high resistance, representing a significant barrier to the price’s upward movement in the current neutral scenario.
Additionally, the second resistance at 36060 is identified as a level of swing high resistance and coincides with the 161.80% Fibonacci Extension, indicating it as an additional substantial barrier to the price’s upward movement within the prevailing neutral trend.
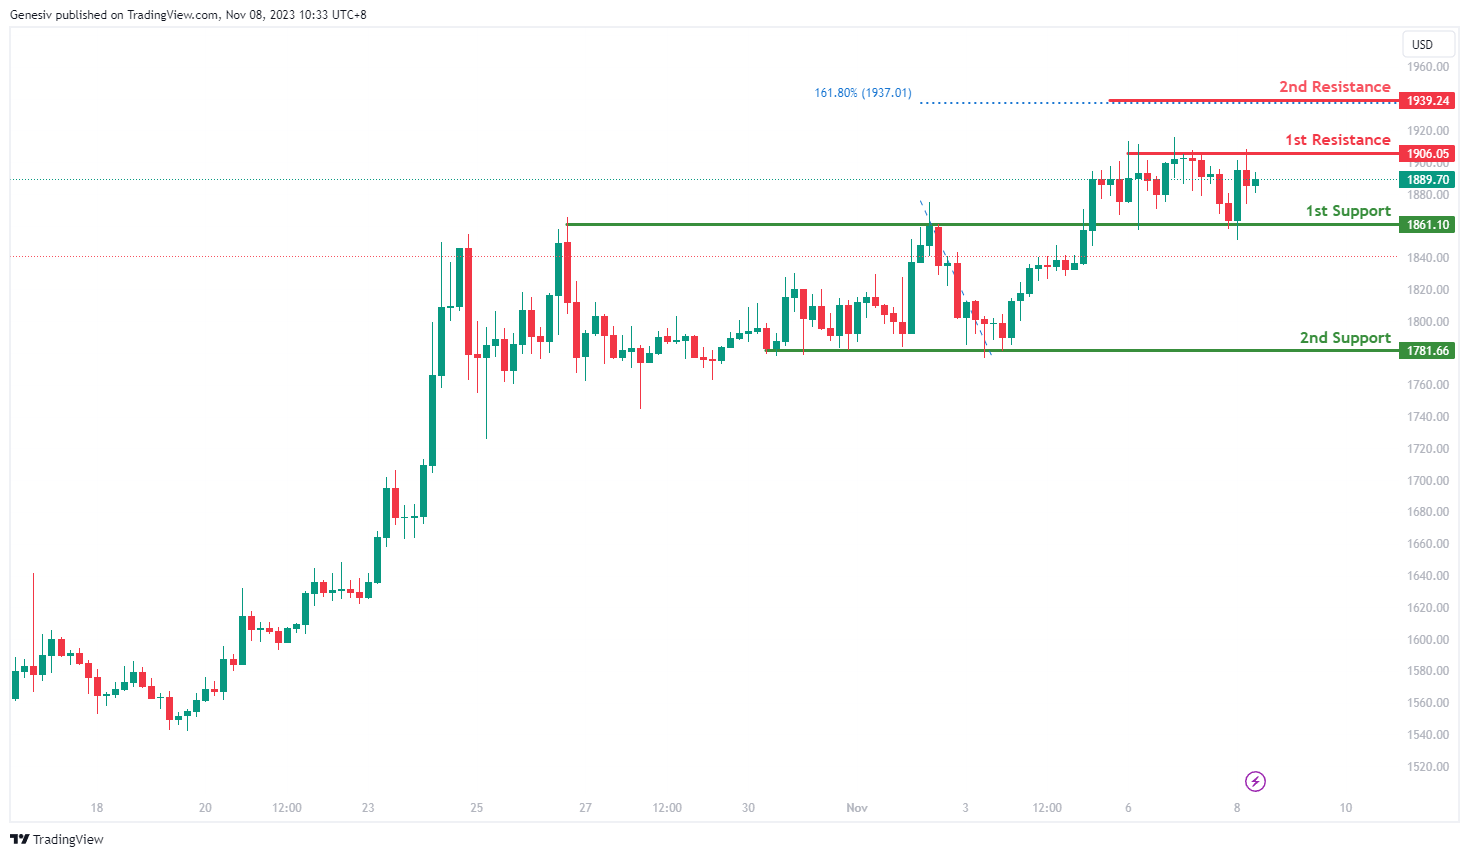
ETH/USD:
For ETH/USD, the current momentum of the chart indicates a neutral trend, suggesting a potential scenario where the price could fluctuate between the first resistance and the first support levels.
The first support at 1861.10 is identified as an overlap support, indicating a significant level where the price might find support during any potential decline or retracement in the neutral trend.
The second support at 1781.66 is recognized as multi-swing low support, providing an additional level that might offer substantial support in case of a price decline within the neutral trend.
On the resistance side, the first resistance at 1906.05 is characterized as multi-swing high resistance, representing a significant barrier to the price’s upward movement in the current neutral scenario.
Moreover, the second resistance at 1939.24 is identified as a level coinciding with the 161.80% Fibonacci Extension, suggesting it as an additional substantial barrier to the price’s upward movement within the prevailing neutral trend.
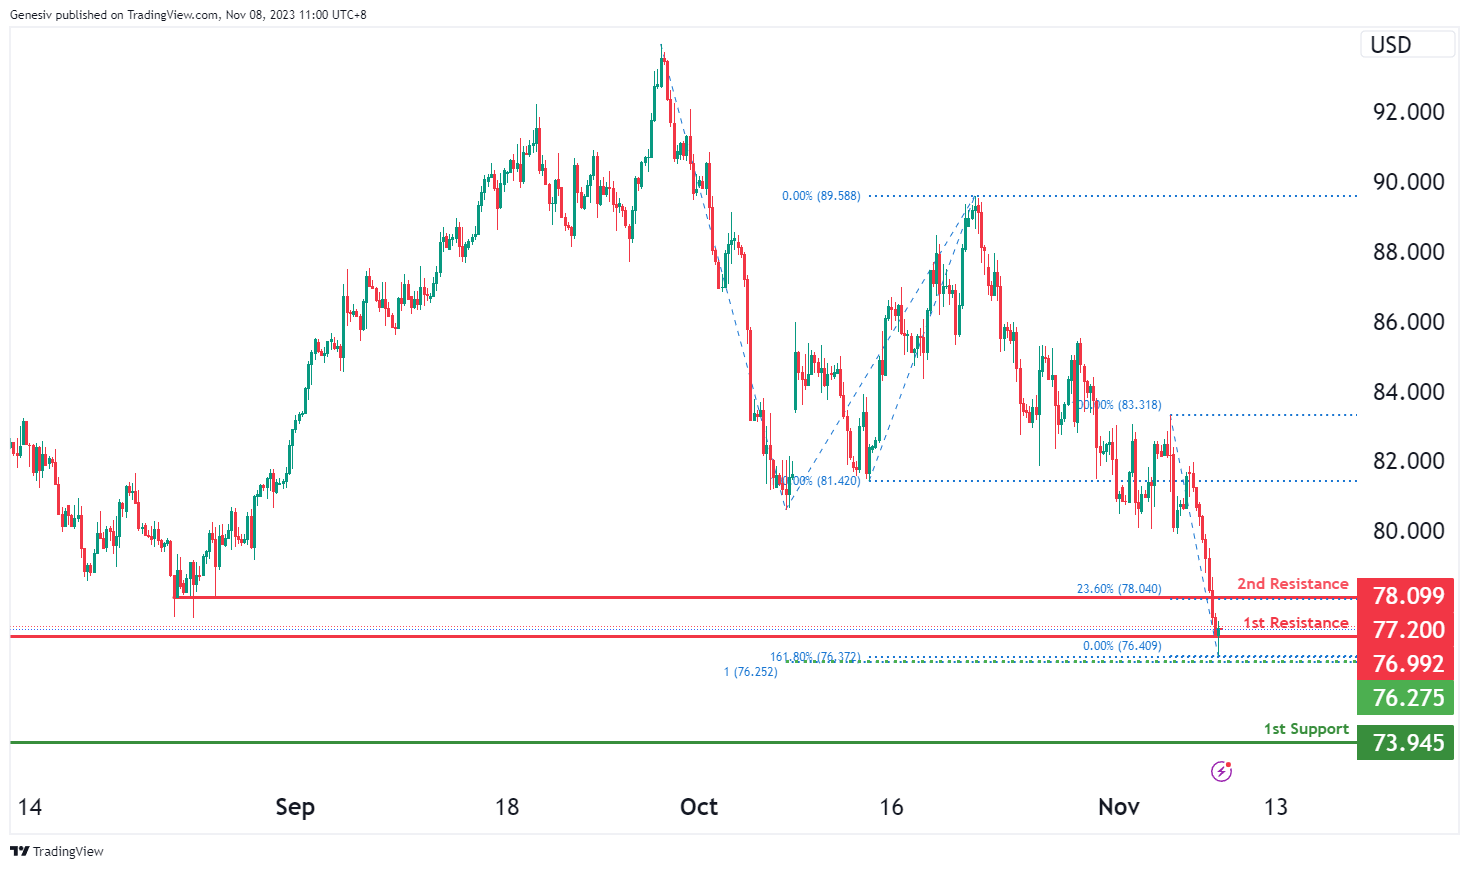
WTI/USD:
The WTI (West Texas Intermediate) chart currently demonstrates an overall bearish momentum. There is potential for price to break below the intermediate support and drop to the 1st support.
The intermediate support level at 76.28 is identified as a support level that aligns with a confluence of Fibonacci levels i.e. the 100.00% projection and the 161.80% extension levels. Further below, the 1st support level at 73.95 is marked as a swing-low support, potentially acting as a strong support zone.
On the resistance side, the 1st resistance level at 76.99 is identified as an overlap resistance. Higher up, the 2nd resistance level at 78.09 is noted a pullback resistance, indicating another potential area where price could face resistance.
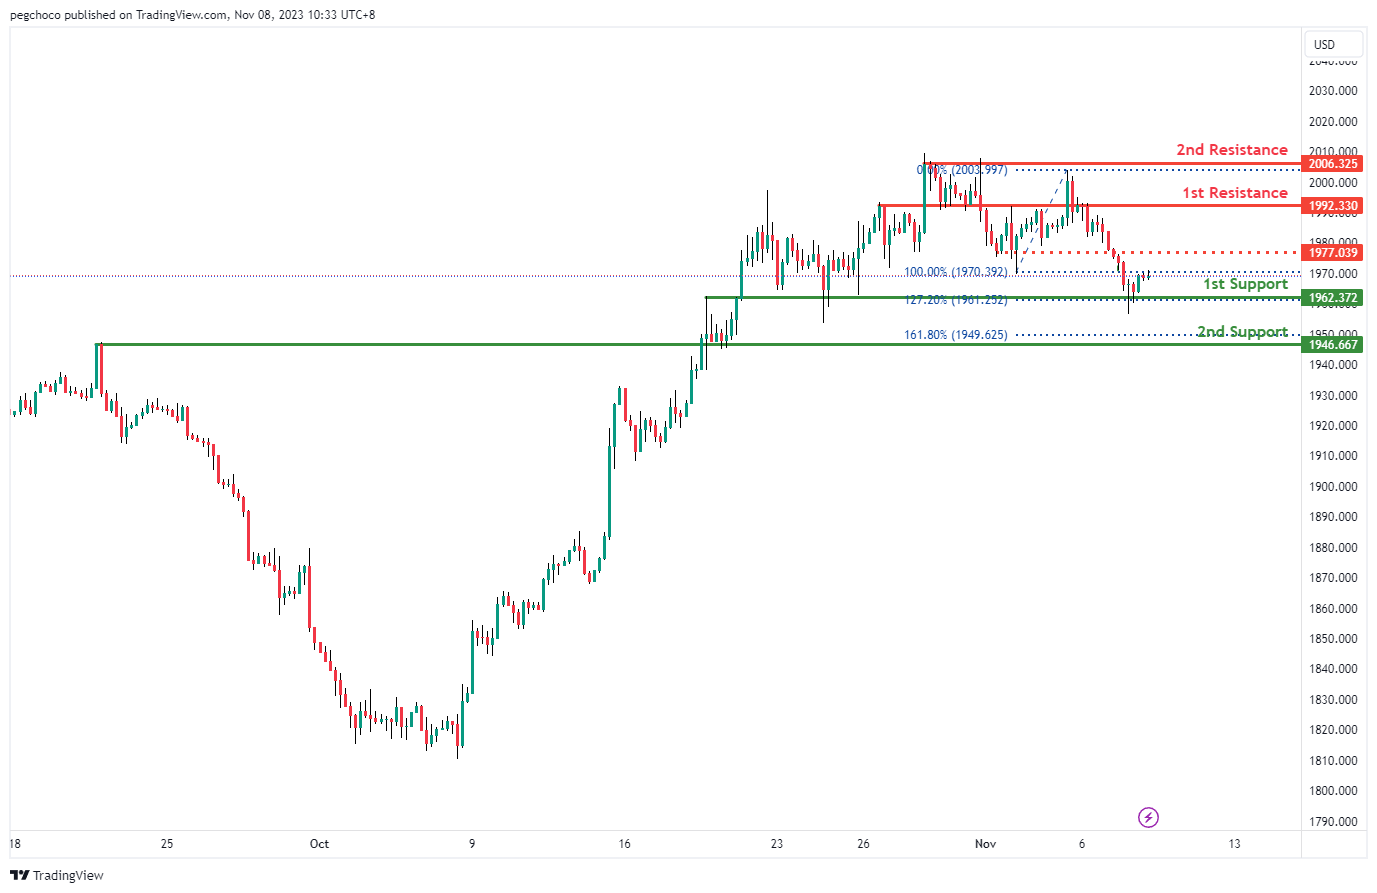
XAU/USD (GOLD):
The XAU/USD chart currently exhibits a bullish overall momentum, suggesting the potential for a bullish continuation towards the 1st resistance level.
The 1st support at 1962.37 is identified as an overlap support and coincides with the 127.20% Fibonacci Extension level, making it a significant level where the price might find buying interest.
Furthermore, the 2nd support at 1946.66 is considered a pullback support, and it aligns with the 161.80% Fibonacci Extension level, reinforcing its potential as a support level.
On the resistance side, the 1st resistance at 1992.33 is categorized as an overlap resistance, indicating a level where the price may encounter selling pressure.
Additionally, the 2nd resistance at 2006.32 is identified as a multi-swing high resistance, suggesting another potential level where the price may face obstacles in its upward movement.
Intermediate resistance at 1977.03 is noted as a pullback resistance, indicating another area where the price might find resistance on its way towards the 1st resistance.
The accuracy, completeness and timeliness of the information contained on this site cannot be guaranteed. IC Markets does not warranty, guarantee or make any representations, or assume any liability regarding financial results based on the use of the information in the site.
News, views, opinions, recommendations and other information obtained from sources outside of www.icmarkets.com, used in this site are believed to be reliable, but we cannot guarantee their accuracy or completeness. All such information is subject to change at any time without notice. IC Markets assumes no responsibility for the content of any linked site.
The fact that such links may exist does not indicate approval or endorsement of any material contained on any linked site. IC Markets is not liable for any harm caused by the transmission, through accessing the services or information on this site, of a computer virus, or other computer code or programming device that might be used to access, delete, damage, disable, disrupt or otherwise impede in any manner, the operation of the site or of any user’s software, hardware, data or property.


