
EUR/USD:
Outlook unchanged.
As uncertainty builds around US/Sino trade negotiations, along with upbeat JOLTS job openings, the US dollar index explored higher ground Tuesday, weighing on its European counterpart.
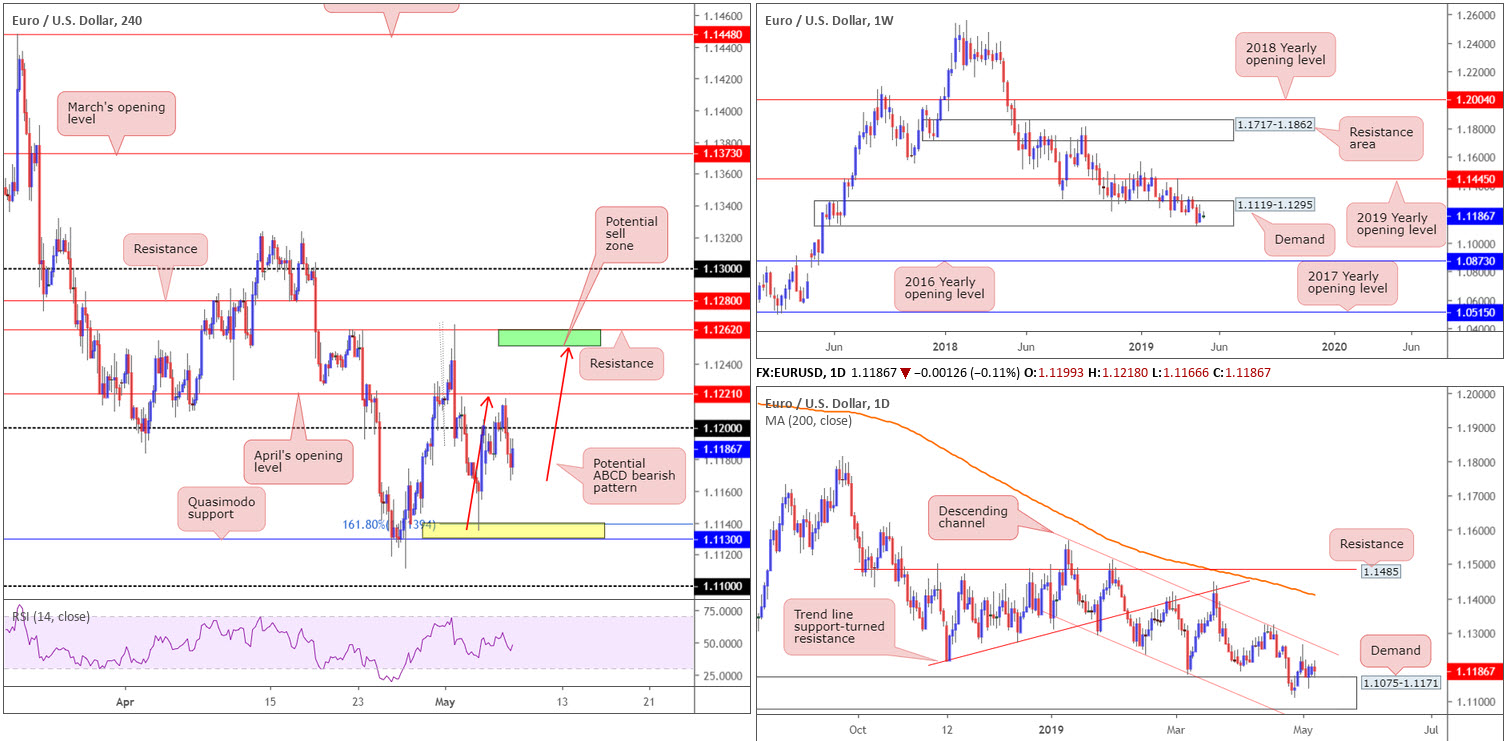
The EUR/USD concluded trade sub 1.12, with the possibility of a retest as resistance likely on the cards today. Above 1.12, as you can see, has April’s opening level at 1.1221 in sight, followed by a rather interesting area of resistance (green) at 1.1262/1.1251 (comprised of a resistance level at 1.1262 and a potential ABCD measured move [red arrows] at 1.1251). To the downside, nonetheless, traders’ crosshairs are likely fixed on the 161.8% Fibonacci ext. point at 1.1139, as well as Quasimodo support at 1.1130 (yellow).
On more of a broader perspective, unchanged from Tuesday’s report, our technical studies have buyers and sellers battling for position within the lower limits of a long-standing weekly demand zone coming in at 1.1119-1.1295. Continued buying may call for a test of weekly resistance plotted at 1.1445, the 2019 yearly opening level, whereas a break lower has the 2016 yearly opening level at 1.0873 in view.
Daily activity continues to dip its toes into demand priced at 1.1075-1.1171 (glued to the underside of the current weekly demand area). The next upside target from this region can be seen around the nearby channel resistance taken from the high 1.1569.
Areas of consideration:
Although the market may struggle to reach the H4 green sell zone at 1.1262/1.1251 today, it remains an area worthy of note for future use. In addition to its H4 confluence, the zone merges closely with the daily channel resistance highlighted above.
Should 1.1262/1.1251 enter the mix, traders are urged to wait and see if H4 price is able to chalk up a bearish candlestick formation before pulling the trigger. That way, you have not only identified seller intent, you also have entry and risk levels to work with (according to the pattern’s structure).
Today’s data points: ECB Monetary Policy Meeting Accounts; FOMC Member Brainard Speaks.
GBP/USD:
UK PM May faced renewed calls to step-down Tuesday as she attempted to secure a deal with Labour to break the Brexit deadlock. This, alongside a modest USD advance, weighed on sterling and dragged the H4 candles sub 1.31 to a session low of 1.3039.
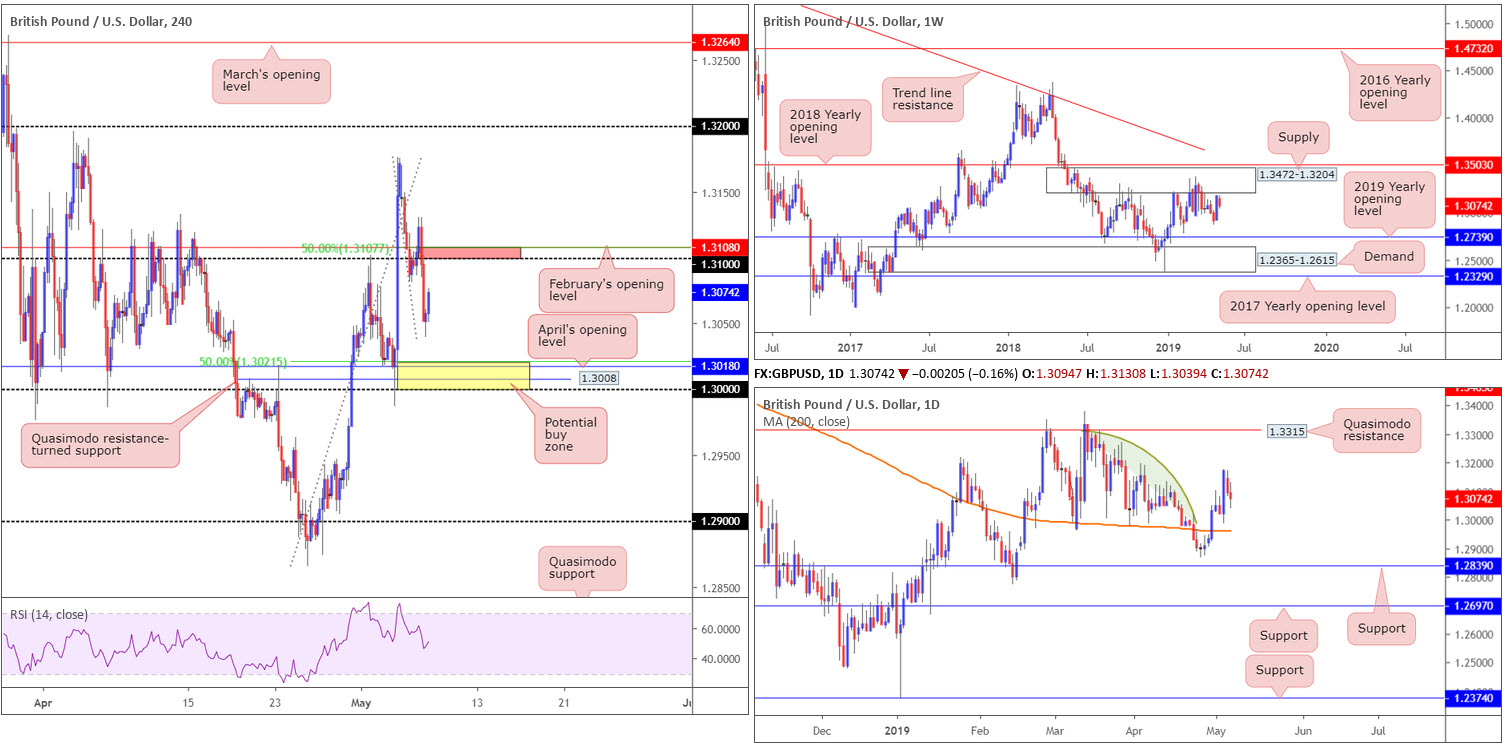
Two areas of interest are in view on the H4 timeframe, according to our technical studies. The first, a resistance zone in red, formed by way of a 50.0% resistance value at 1.3107 and the round number 1.31. The second, a support zone in yellow at 1.30/1.3021, boasts a number of merging supports: the key figure 1.30, support coming in at 1.3008, April’s opening level at 1.3018 and a 50.0% support value at 1.3021.
Higher-timeframe structure, similar to Tuesday’s outlook, has weekly price displaying signs of weakness ahead of a notable supply zone at 1.3472-1.3204, situated a few points south of the 2018 yearly opening level at 1.3503. Having observed this area hold price action lower on a number of occasions in the past, history has a good chance of repeating itself here should the area eventually be tested.
Daily movement, on the other hand, appears to be trading in no man’s land between Quasimodo resistance at 1.3315 and the 200-day SMA (orange), with the latter looking as though it will enter the fold shortly. Traders may also want to acknowledge to the left of current price limited supply is visible (the green arc pattern is there to mark consumed supply – notice price action filled each supply before turning lower).
Areas of consideration:
As highlighted above, two areas of interest on the H4 timeframe are visible: a support zone in yellow at 1.30/1.3021 and a resistance area at 1.3107/1.31. Both areas offer confluence, though the former is the more attractive of the two.
Irrespective of which zone is selected, if any, traders are urged to consider waiting for additional confirmation to form before pulling the trigger. This could be anything from a candlestick signal, an MA crossover or even drilling down to the lower timeframes (remember the market is fractal) and searching for a local setup to trade (entry and risk parameters can be determined according to the confirming pattern’s rules).
Today’s data points: MPC Member Ramsden Speaks; FOMC Member Brainard Speaks.
AUD/USD:
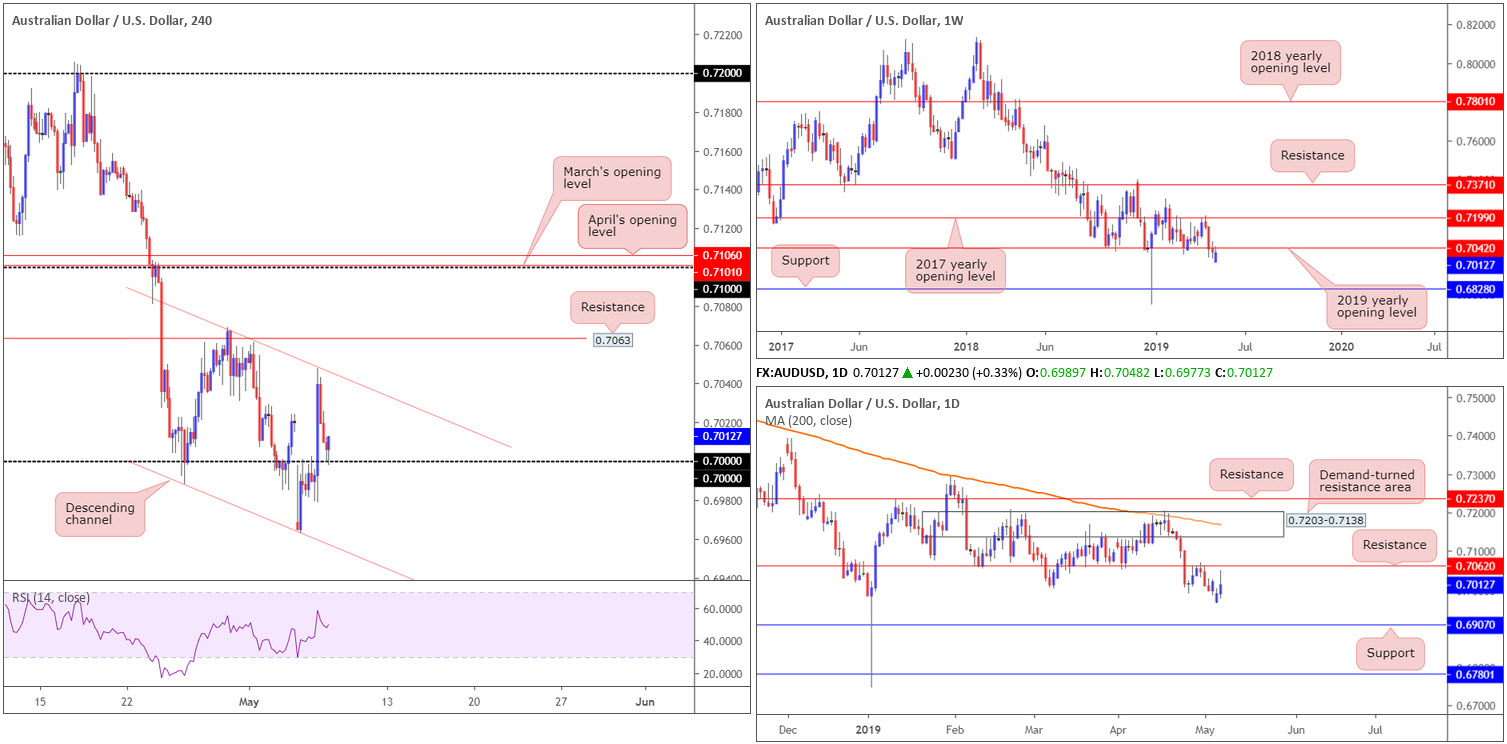
After the Reserve Bank of Australia decided to leave the cash rate unchanged at 1.50%, market consensus called for a rate cut, AUD/USD bulls received fresh impetus and established firm ground above key figure 0.70 on the H4 timeframe. Despite a robust start to Tuesday, the pair encountered fresh supply by way of a H4 channel resistance etched from the high 0.7069, consequently directing the candles lower and reconnecting with 0.70, which held into the close.
The response from 0.70 thus far has been promising, though buying from here is potentially problematic. Not only is the market entrenched within a relatively strong downtrend, we have H4 sellers in the mix from the said channel resistance, and also weekly sellers from the underside of the 2019 yearly opening level at 0.7042. Couple this with daily resistance also resting nearby at 0.7062, and we have ourselves some pretty overwhelming resistance visible in this market.
Areas of consideration:
On account of the above, traders who are keen on buying 0.70 are, according to our technical reading, potentially entering long into strong resistance.
Should our reading prove accurate and the H4 candles make their way below 0.70 today, traders are urged to keep their eyes open for a rejection off the underside of 0.70 today for shorts (preferably by way of a H4 bearish candlestick formation [entry/risk parameters can be defined according to this structure]), targeting channel support extended from the low 0.6988, followed by daily support at 0.6907 (the next downside target on the daily scale).
Today’s data points: China Trade Balance; FOMC Member Brainard Speaks.
USD/JPY:
The Japanese yen outperformed vs. its US counterpart Tuesday, as declines witnessed in European and US equity markets spurred flows into safe-haven assets.
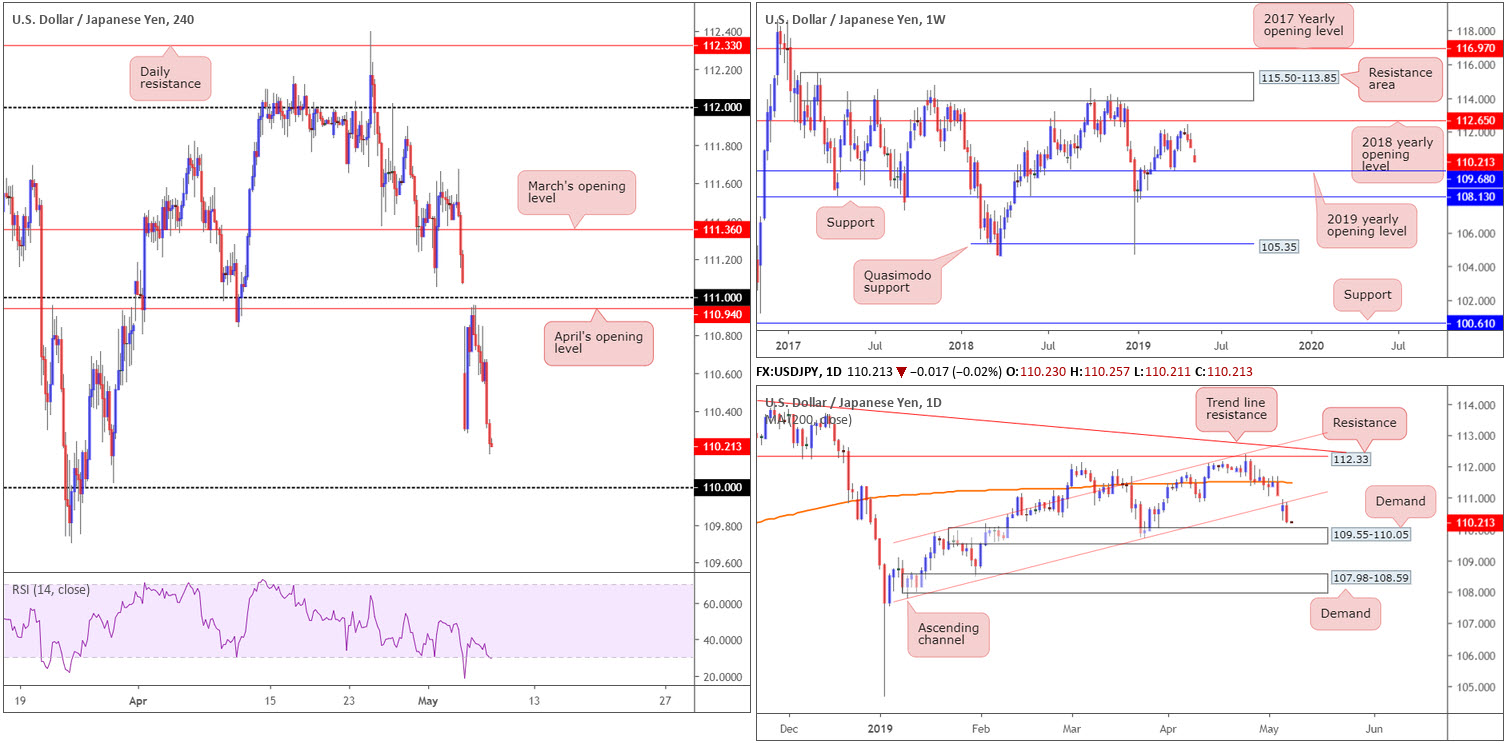
The USD/JPY’s H4 candles, as you can see, have been under pressure since shaking hands with the underside of April’s opening level at 110.94. As we head into Asia Pac hours, the unit faces possible support by way of the 110 psychological level. Also of interest is the RSI indicator chalking up an oversold reading.
The selloff, according to our technical reading, held weight as daily flows retested a channel support-turned resistance (107.77). Note the next downside target on the daily scale is demand plotted at 109.55-110.05, which happens to envelope the 110 handle applied to the H4 timeframe. Another key thing worth highlighting is weekly price showing room to press beyond 110 to the 2019 yearly opening level at 109.68, which is also seen housed within the walls of the aforesaid daily demand zone.
Areas of consideration:
Having seen 110’s connection with daily demand mentioned above at 109.55-110.05, a bounce from this neighbourhood could materialise today. Owing to the threat of further selling being suggested on the weekly timeframe to 109.68, though, waiting for a H4 bullish candlestick to develop off 110 before pressing the buy button is recommended. A hammer pattern, for example, identifies buyer interest and also provides strict entry/risk levels to work with.
Today’s data points: FOMC Member Brainard Speaks.
USD/CAD:
Outlook unchanged.
USD/CAD bulls went on the offensive Tuesday, strengthened by fragile oil prices and increasing demand for the US dollar. The US dollar index picked up the pace in early US trading, though found weekly resistance at 97.72 too much to handle.
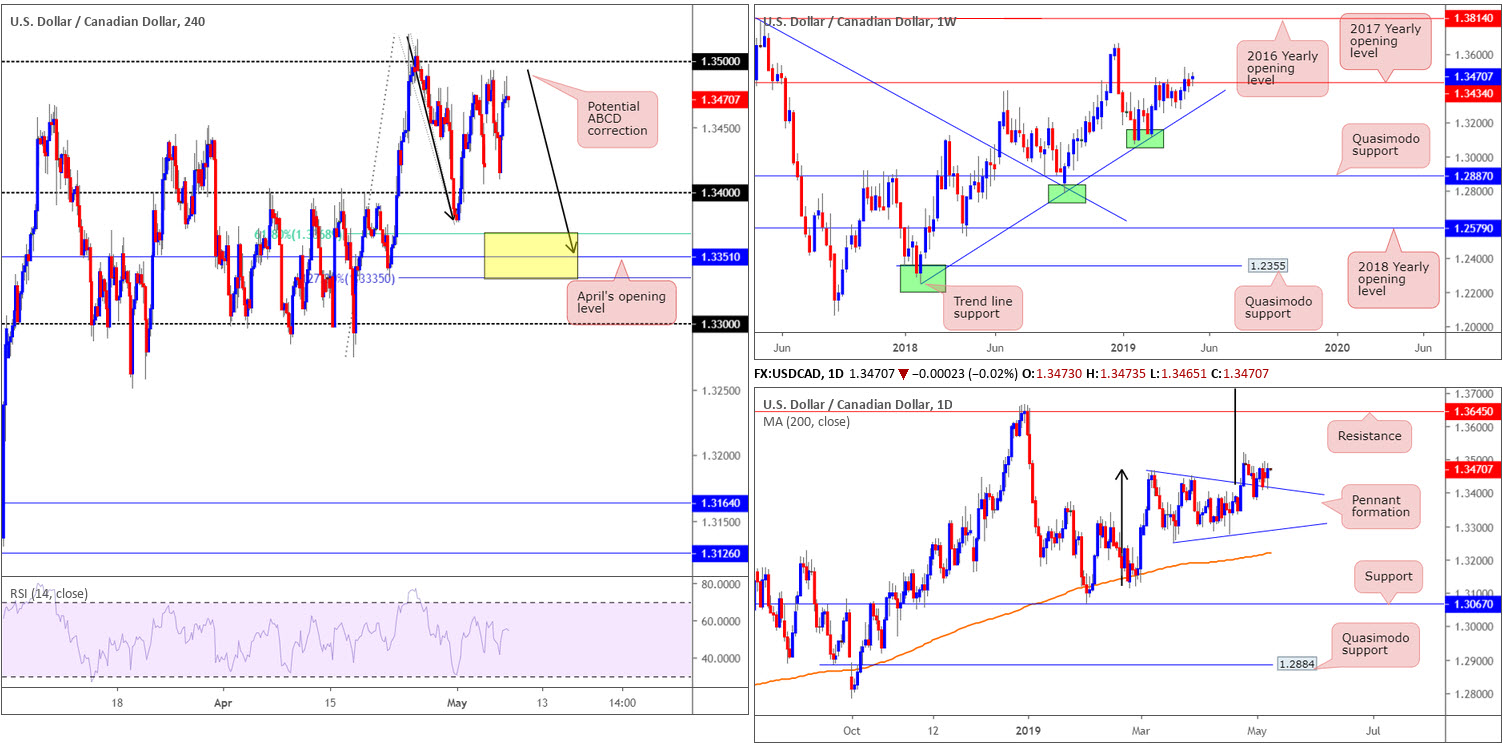
The H4 candles on the USD/CAD concluded the day consolidating a few points south of the 1.35 handle. As emphasised in previous reports, 1.34 could hold price action higher should a test be realised, though the more appealing area of support (in terms of H4 confluence) resides lower down on the chart between (yellow) at 1.3335/1.3368. Comprised of April’s opening level at 1.3351 as the centre line, a 61.8% Fibonacci support value at 1.3368 and a potential ABCD (black arrows) 127.2% Fibonacci ext. point at 1.3335, this zone offers reasonably robust local confluence.
On a wider perspective, longer-term flows remain circulating above the 2017 yearly opening level at 1.3434. Beneath this base, traders’ crosshairs are fixed on trend line support taken from the low 1.2247, whereas continued buying could eventually lead to a move materialising in the direction of the 2018 yearly high of 1.3664.
A closer reading of price action shows the daily candles continue to feed off support drawn from the top edge of a pennant pattern (1.3467). Although the traditional price target (calculated by taking the distance from the beginning of the preceding move and adding it to the breakout price) will remain on the chart (black arrows), the next upside target from a structural standpoint falls in around resistance at 1.3645.
Areas of consideration:
On account of our technical studies, 1.34 is a level of support to watch today given its close connection with the top edge of the daily pennant pattern.
The yellow H4 zone highlighted above at 1.3335/1.3368 is also likely to offer a bounce this week, in view of its H4 confluence.
Irrespective of which movement takes shape, traders may want to consider waiting and seeing if the H4 candles chalk up a bullish candlestick signal (entry and risk can then be determined according to the pattern’s rules) before pulling the trigger.
In the event further buying develops before connecting with either of the above said barriers, the market may observe a H4 close form above 1.35. Should this occur, traders have the choice of either buying the breakout candle and placing stop-loss orders beneath its tail, or waiting and seeing if a retest scenario takes shape and entering on the back of the rejection candle’s structure.
Today’s data points: FOMC Member Brainard Speaks.
USD/CHF:
Outlook unchanged.
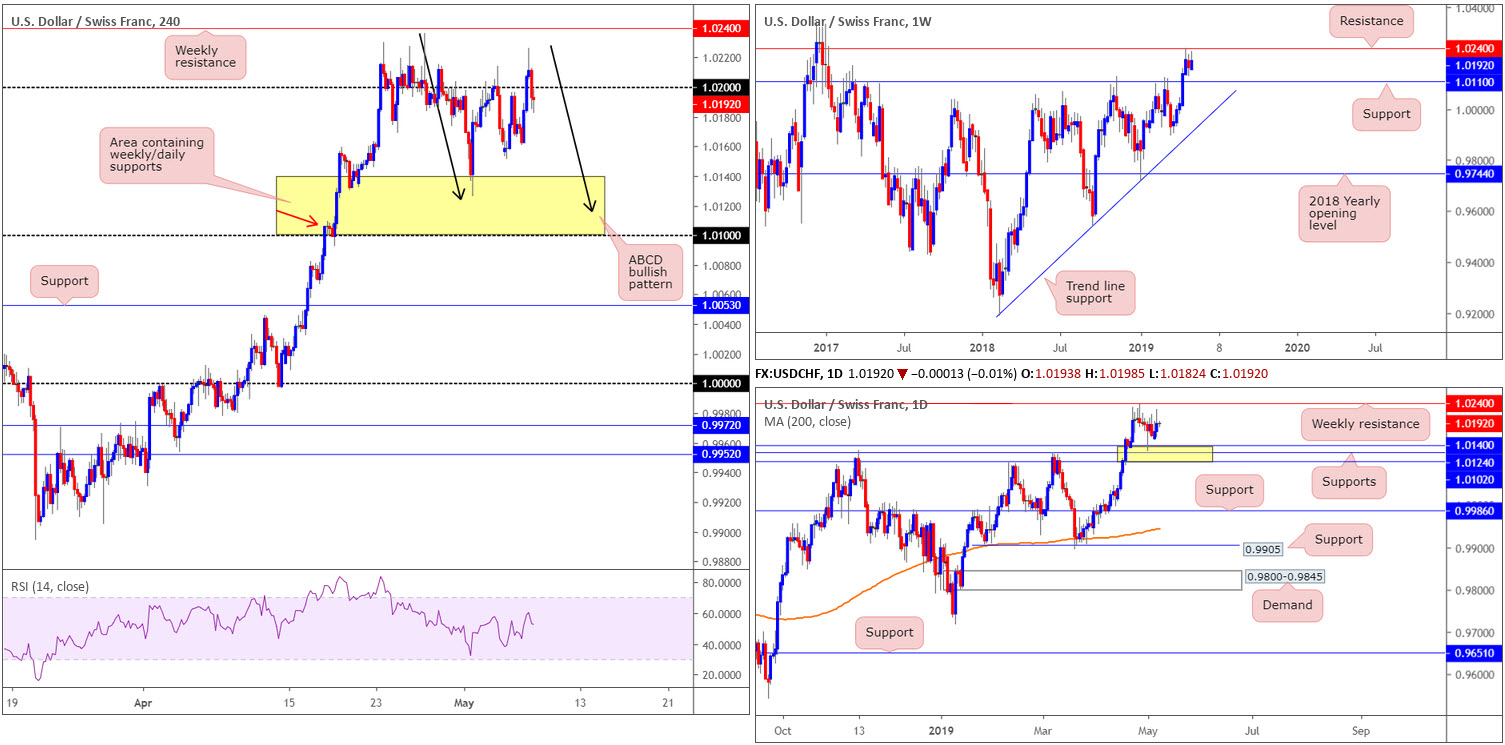
Momentum continued to favour the bulls Tuesday, as the USD/CHF reached highs at 1.0226. Although broad-based USD strength appeared to be the primary driver behind the pair’s recent upsurge, price action turned lower in US hours and reclaimed 1.02 to the downside.
With 1.02 potentially offering the market a resistance level to work with today, there’s a possibility the H4 candles may eventually complete an ABCD bullish pattern (black arrows), terminating around the 1.0116 region.
Looking at weekly structure, the research team notes resistance present around 1.0240 and support coming in at 1.0110. In terms of daily flow, weekly resistance is also the next visible upside target on this scale. What’s interesting on the daily timeframe, though, is the weekly support at 1.0110 is encapsulated within the walls of daily support between 1.0102/1.0140. On account of this, the pair’s ABCD measured correction on the H4 timeframe (black arrows) terminates within the area of daily supports between 1.0102/1.0140.
Areas of consideration:
Keeping it as simple as possible, the research team has eyes on the yellow area of daily supports, in particular the lower boundary of the zone: the H4 ABCD termination point around 1.0116. Without waiting for additional confirmation, traders are likely looking to enter at 1.0116 and position stops just south of nearby H4 demand (red arrow) at 1.0093-1.0108.
Today’s data points: FOMC Member Brainard Speaks.
Dow Jones Industrial Average:
US equities declined sharply Tuesday, as financial markets contended with the risk of an all-out trade war between China and the United States. The S&P 500 ended the session down 1.65%; the tech-heavy Nasdaq 100 concluded trade in the red by 1.98% and the Dow Jones Industrial Average also wrapped up the day lower at 1.79%.
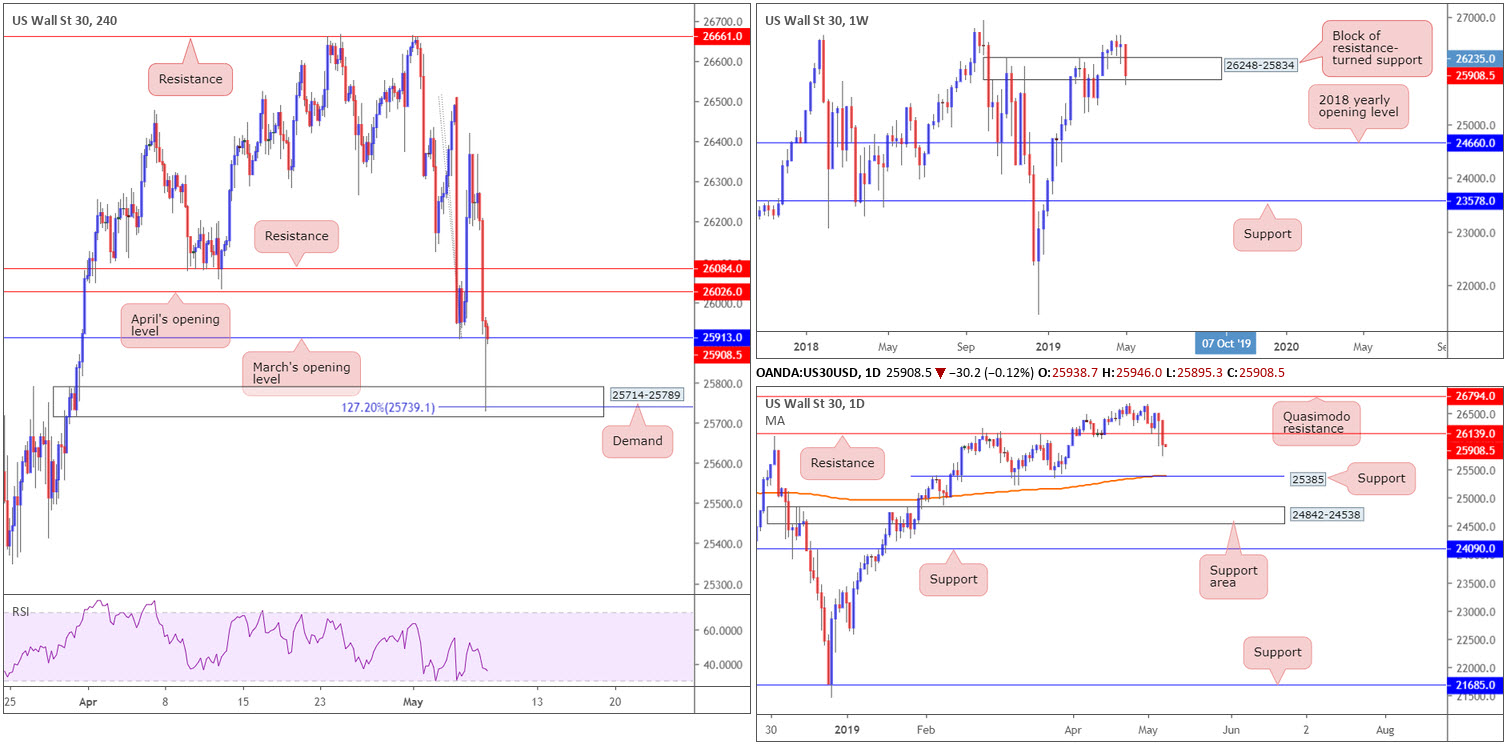
Technically speaking, weekly movement, thanks to yesterday’s bout of selling, trades around the lower edge of a resistance-turned support area at 26248-25834. A decisive break of this zone may call for a long-term target of 24660: the 2018 yearly opening level. Recent action on the daily timeframe has seen the unit cross beneath support registered at 26139 (now acting resistance), and potentially unlocked downside towards a clear-cut base of support at 25385.
A closer reading of price action on the H4 timeframe shows the candles crossed swords with a 127.2% Fibonacci extension at 25739 (housed within the limits of fresh demand at 25714-25789) and rebounded higher. As of current price, activity is seen trading above March’s opening level at 25913. The next upside targets on this scale fall in around April’s opening level at 26026 and resistance parked at 26084.
Areas of consideration:
Having seen daily action cross below support, and H4 price unveiling resistance close by, buying this market on the back of the current weekly support area, at least right now, may not be the path to explore.
Selling is equally problematic, according to our reading. Yes, we do have a clear run lower on the daily timeframe, but with weekly buyers still potentially in the fight and H4 action trading around support (25913), this market may be best left on the back burner today as neither a long nor short seems attractive.
Today’s data points: FOMC Member Brainard Speaks.
XAU/USD (GOLD):
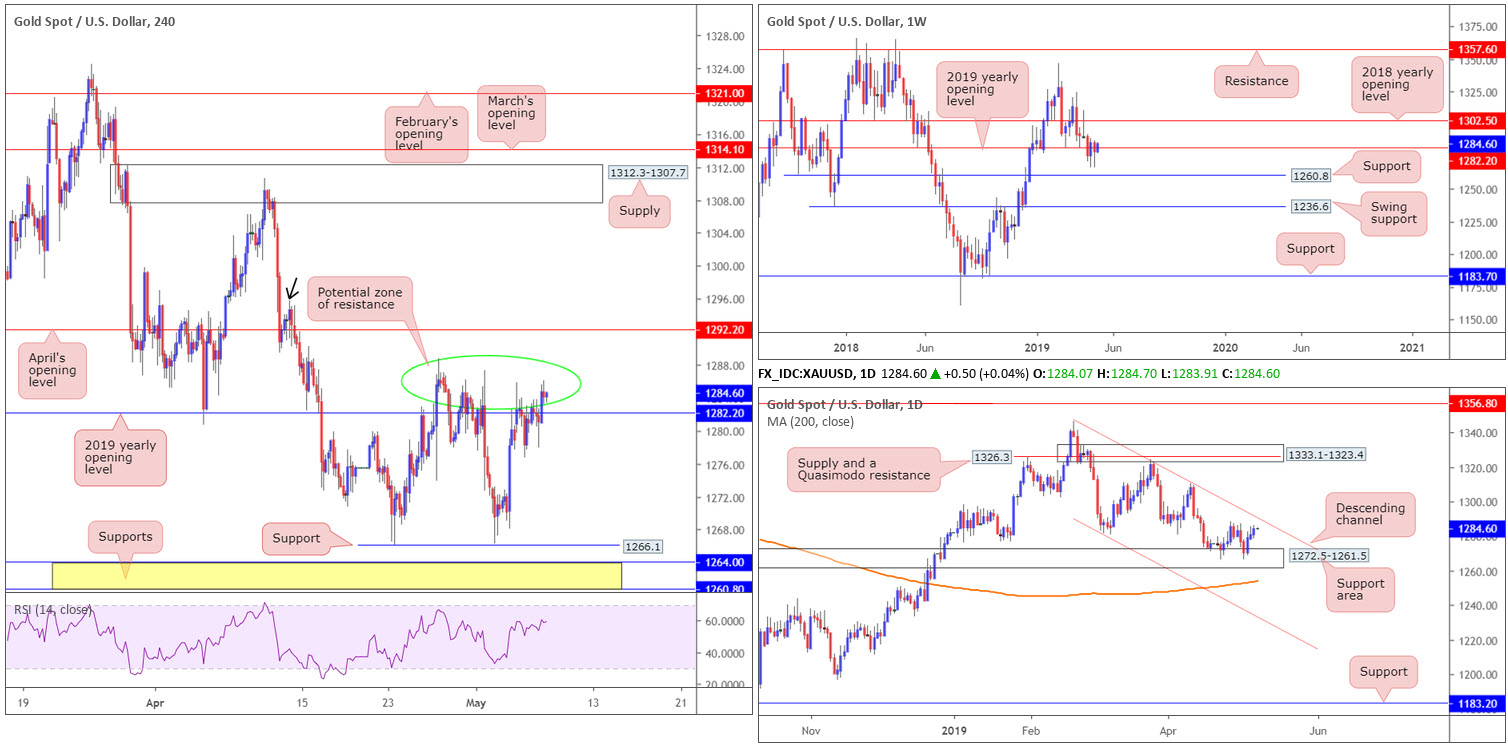
Bullion explored higher ground for a third consecutive session Tuesday, registering a high of 1286.1. The move, as is evident from the H4 timeframe, crossed above the 2019 yearly opening level at 1282.2, though still has some wood to chop through around the 1284.0ish region (green circle), followed closely by April’s opening level at 1292.2.
Over on the daily timeframe, price continues to extend gains, initially set by a rebound off a support area at 1272.5-1261.5, targeting a test of channel resistance etched from the high 1346.7. Note this daily channel resistance also unites closely with April’s opening level on the H4 timeframe at 1292.2.
In terms of weekly price action, however, bullion is seen flipping between gains/losses around its 2019 yearly opening level at 1282.2 (also positioned on the H4 timeframe). Further selling from this point has support coming in at 1260.8, whereas a decisive move above 1282.2 may call for an approach in the direction of the 2018 yearly opening level at 1302.5.
Areas of consideration:
Entering long above the 2019 yearly opening level at 1282.2 faces a number of competing themes on the H4 timeframe, as well as on the higher timeframes, too.
Selling April’s opening level mentioned above at 1292.2 on the H4 timeframe, on the other hand, is a move worth watching for today. Knowing it has connections with the current daily channel resistance, it is likely to produce a bounce at the very least. Stop-loss placement, according to our reading, is best positioned beyond the supply top at 1295.8 (black arrow).
The accuracy, completeness and timeliness of the information contained on this site cannot be guaranteed. IC Markets does not warranty, guarantee or make any representations, or assume any liability with regard to financial results based on the use of the information in the site.
News, views, opinions, recommendations and other information obtained from sources outside of www.icmarkets.com.au, used in this site are believed to be reliable, but we cannot guarantee their accuracy or completeness. All such information is subject to change at any time without notice. IC Markets assumes no responsibility for the content of any linked site. The fact that such links may exist does not indicate approval or endorsement of any material contained on any linked site.
IC Markets is not liable for any harm caused by the transmission, through accessing the services or information on this site, of a computer virus, or other computer code or programming device that might be used to access, delete, damage, disable, disrupt or otherwise impede in any manner, the operation of the site or of any user’s software, hardware, data or property.


