
A note on lower timeframe confirming price action…
Waiting for lower timeframe confirmation is our main tool to confirm strength within higher timeframe zones, and has really been the key to our trading success. It takes a little time to understand the subtle nuances, however, as each trade is never the same, but once you master the rhythm so to speak, you will be saved from countless unnecessary losing trades. The following is a list of what we look for:
- A break/retest of supply or demand dependent on which way you’re trading.
- A trendline break/retest.
- Buying/selling tails/wicks – essentially we look for a cluster of very obvious spikes off of lower timeframe support and resistance levels within the higher timeframe zone.
- Candlestick patterns. We tend to only stick with pin bars and engulfing bars as these have proven to be the most effective.
We search for lower timeframe confirmation between the M15 the H1 timeframes, since most of our higher-timeframe areas begin with the H4. Stops are usually placed 5-10 pips beyond confirming structures.
EUR/USD:
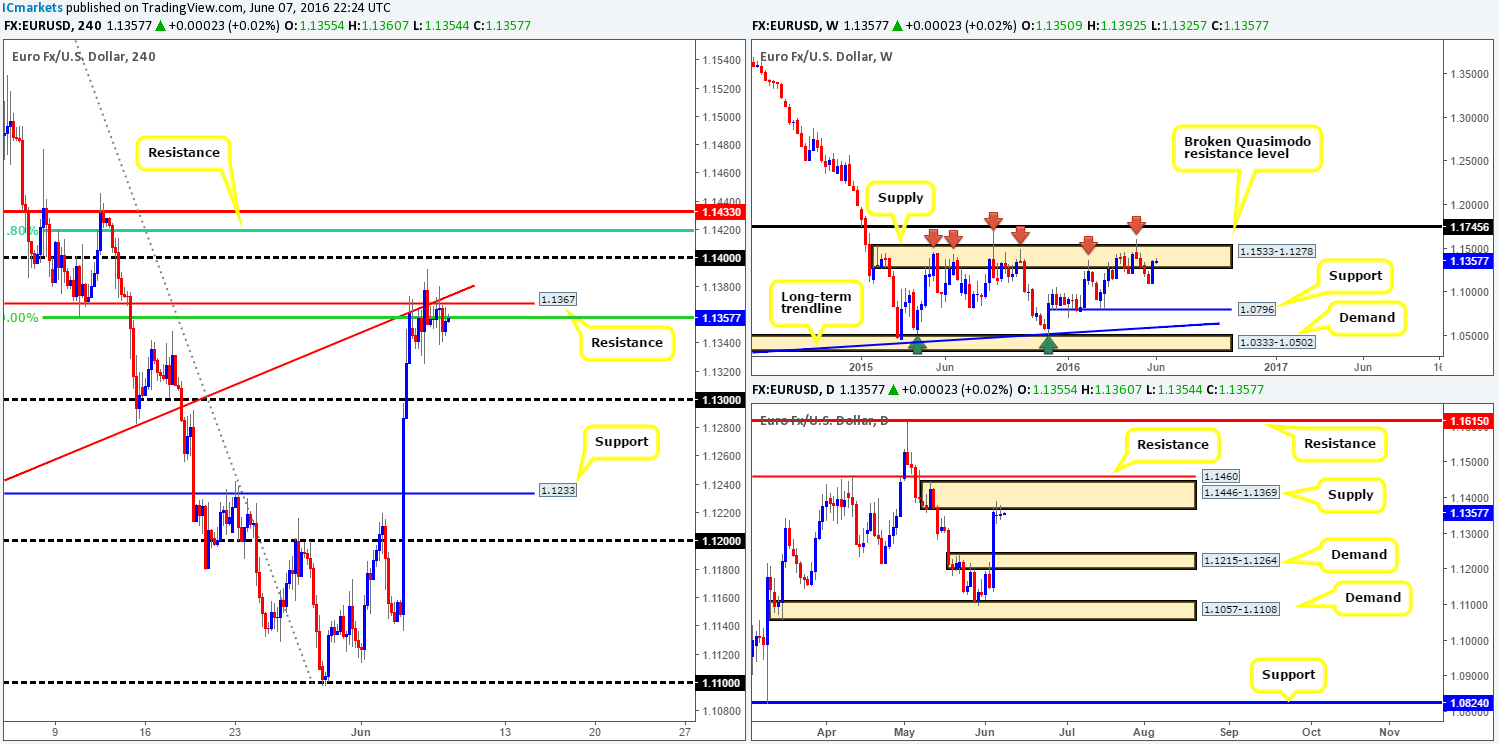
With little high-impacting news on the docket yesterday, the EUR/USD continued to consolidate below H4 resistance coming in at 1.1367 (backed by a H4 50% Fib resistance at 1.1358 and a H4 trendline support-turned resistance taken from the low 1.1057). Consequent to this lackluster performance, much of the following analysis will echo similar thoughts put forward in our previous report…
This H4 resistance is, as we mentioned in Monday’s report, reinforced by both a weekly supply zone at 1.1533-1.1278 (managed to hold price lower since May 2015), and a daily supply area seen at 1.1446-1.1369. In addition to this, the U.S. dollar index is finding support from a H4 demand at 93.68-93.85, which is an inversely correlated market with the EUR/USD pair. Therefore, our team remains in the sellers’ camp for the time being.
Our suggestions: The current H4 resistance at 1.1367, and also the H4 resistance seen above at 1.1433 (bolstered by the H4 61.8% Fib level at 1.1419) are, in our opinion, beautiful areas to be looking for sell opportunities today.
We would, however, only recommend trading the above lines if and only if lower timeframe confirming price action is seen. This could be in the form of an engulf of demand followed by a retest, a trendline break/retest or simply a collection of selling wicks around a lower timeframe resistance (see the top of this report). Should one manage to spot a short opportunity today from the 1.1367 region, we’d be looking to take partial profits around the 1.13 band and reducing risk to breakeven.
Levels to watch/live orders:
- Buys: Flat (Stop loss: N/A).
- Sells: 1.1367 region [Tentative – confirmation required] (Stop loss: dependent on where one confirms this area). 1.1433 region [Tentative – confirmation required] (Stop loss: dependent on where one confirms this area).
GBP/USD:
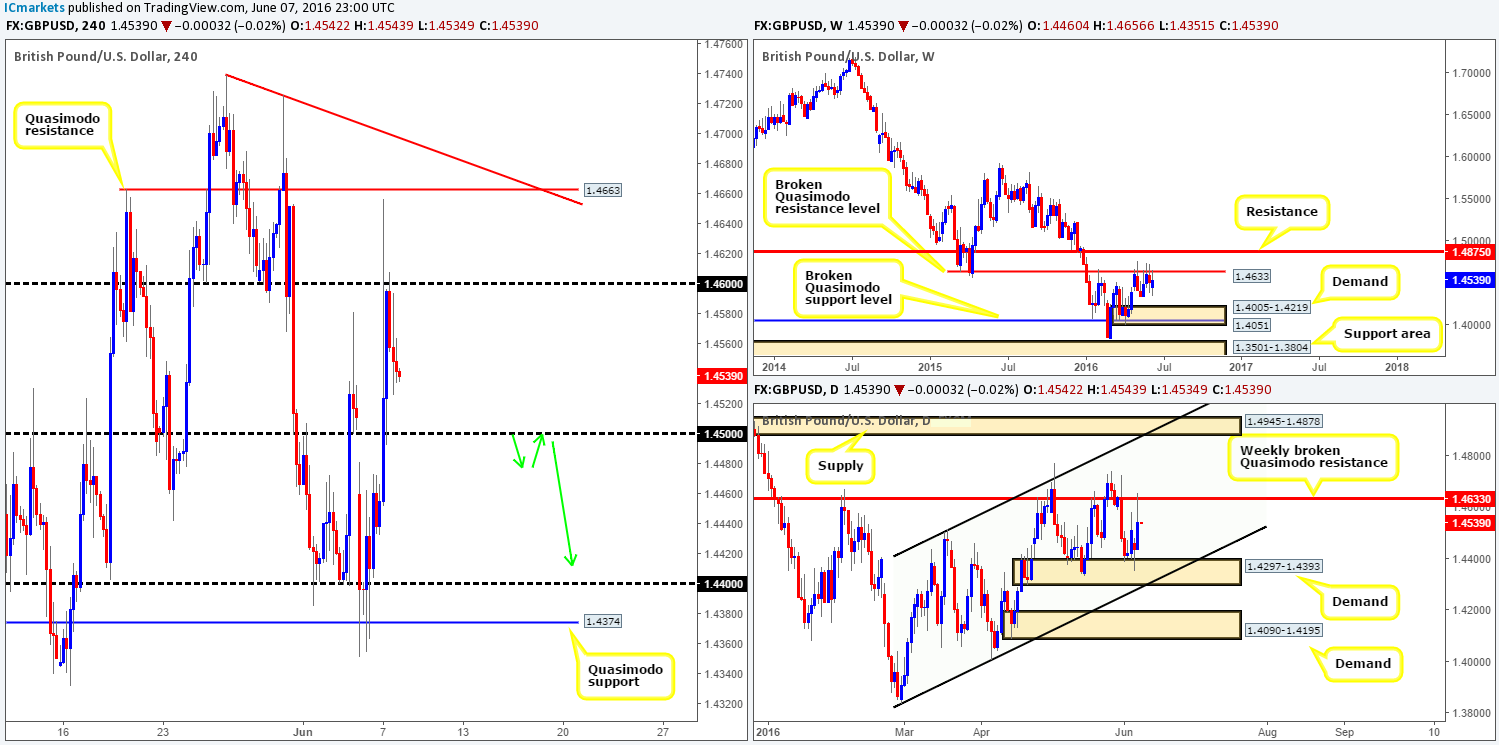
Amid yesterday’s trading we saw cable aggressively spike to highs of 1.4656 early on in Asia. This is quite extraordinary considering there was little high-impacting news for the GBP that day! However, with the latest polls regarding the ‘Brexit’ situation swaying to the side of the ‘leave’ camp, volatility is likely going to be erratic leading up to the event so remain vigilant if trading this pair!
The technical picture over on the weekly chart shows price remains offered around the weekly broken Quasimodo resistance line (BQM) at 1.4633. With this line managing to cap upside since early February and the pair clearly still entrenched within a downtrend, we feel the bears may continue to claw down to weekly demand chalked up at 1.4005-1.4219 (fuses with a weekly broken Quasimodo support level at 1.4051). Down on the daily chart, the unit is now seen trading in no-man’s-land between the above said weekly BQM resistance and a daily demand penciled in at 1.4297-1.4393.
Our suggestions: Watch for price to close below and retest 1.45 today (as per the green arrows). This would likely open the gates for price to challenge the 1.44 band, which sits just above the aforementioned daily demand zone. The reason for choosing this setup over a long from 1.45 is simply due to the weekly picture trading from resistance, and room being seen on the daily chart for price to move lower (see above).
Of course, it is down to the individual trader how levels are confirmed; some are aggressive, while some are conservative. In the case above, our team requires lower timeframe confirmation to be seen following the retest (see the top of this report for details). This is not only because of the expected volatility, but also since psychological numbers are prone to whipsaws!
Levels to watch/live orders:
- Buys: Flat (Stop loss: N/A).
- Sells: Watch for price to consume 1.45 and look to trade any retest seen thereafter (lower timeframe confirmation required).
AUD/USD:
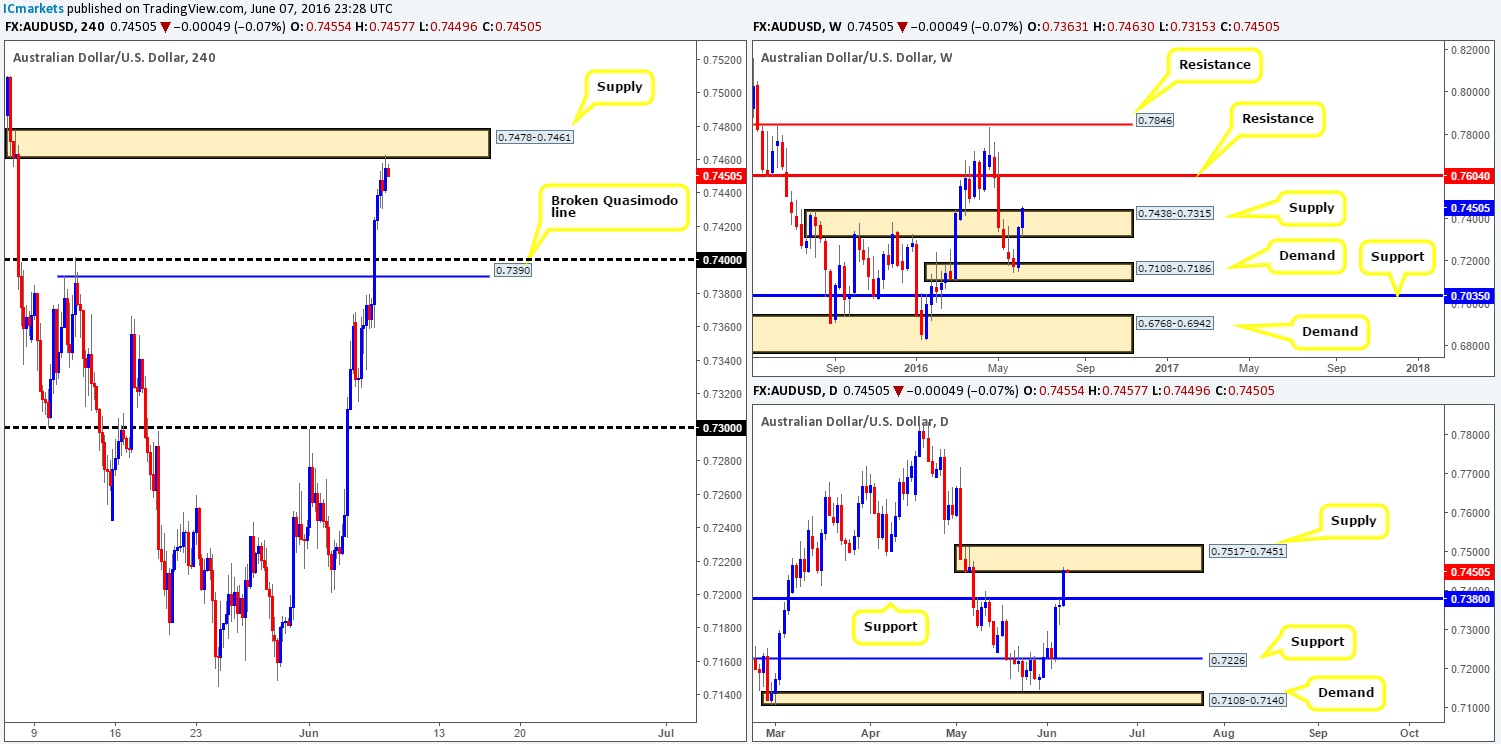
(Trade update: Stopped out at 0.7407)
Boosted by the RBA’s decision to leave interest rates unchanged, the commodity currency advanced to fresh highs during yesterday’s trading. This, as can be seen from the H4 chart, eventually brought price into the jaws of a H4 supply zone seen at 0.7478-0.7461 by the day’s close.
What this recent surge in buying also did was drive the unit slightly above a weekly supply base drawn from 0.7438-0.7315. However, with the daily supply area at 0.7517-0.7451 still firmly intact, the breach above the weekly supply could simply be a fakeout to collect stops to drive lower. The next downside target from the current daily supply can be seen at 0.7380 – a long-term support line.
Our suggestions: Given the points made above, today’s spotlight will firmly be focused on looking for shorting opportunities around the H4 supply zone at 0.7478-0.7461 (for ideas on how to confirm higher timeframe zones using lower timeframe price action, see the top of this report). The reason for requiring confirmation from this barrier is due to the recent break above weekly supply (see above).
Levels to watch/live orders:
- Buys: Flat (Stop loss: N/A).
- Sells: 0.7478-0.7461 [Tentative – confirmation required] (Stop loss: dependent on where one confirms this area).
USD/JPY:
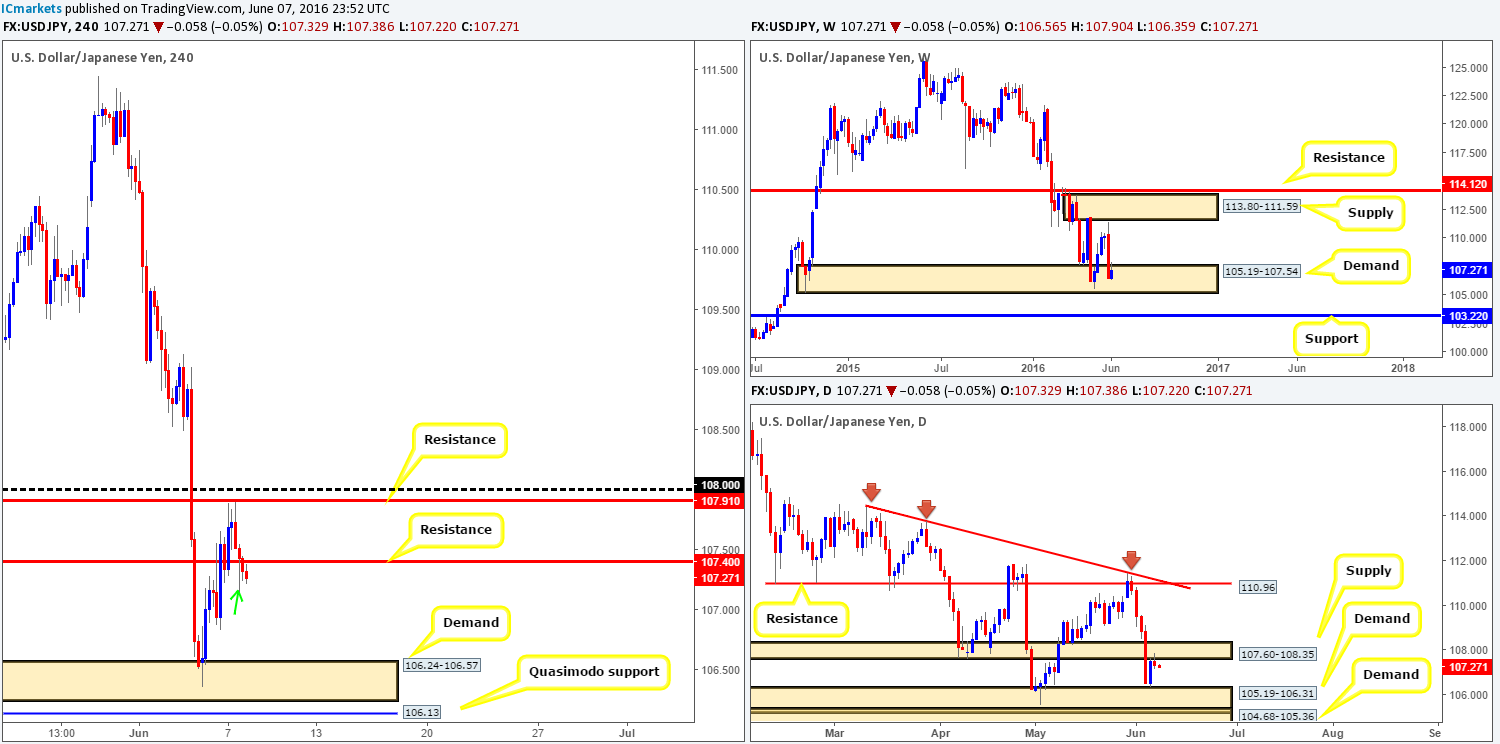
From the top this morning, we can see that the buyers and sellers remain battling for position within the confines of a weekly demand base seen at 105.19-107.54. In the event that price is bid higher from here, the next upside target can be seen at weekly supply coming in at 113.80-111.59. On the other side of the ledger, daily movement recently checked in with a daily supply area seen at 107.60-108.35, and is at the time of writing, holding ground.
Jumping over to the H4 chart, the pair came within a pip of connecting with H4 resistance at 107.91 going into yesterday’s London morning session, before collapsing lower. H4 support at 107.40 was recently taken out, and now looks as though it’s close to being retested as resistance. Shorting from this line today is a possibility in our opinion. Not only is price trading from a daily supply, but it appears near-term H4 demand at 106.83-107.16 has been partially consumed by the H4 low marked with a green arrow at 107.15. For us personally, a short from this H4 resistance is only valid alongside lower timeframe confirmation (see the top of this report for confirming techniques), since let’s not forget that by selling from here we’re effectively selling into weekly demand (see above)!
Should we manage to pin down a setup from the H4 line today, we’ll look to reduce risk once price hits the lower edge of the above said H4 demand, then look to trail price down to the final target – the H4 demand base at 106.24-106.57 (located within daily demand seen at 105.19-106.31).
Levels to watch/live orders:
- Buys: Flat (Stop loss: N/A).
- Sells: 107.40 region [Tentative – confirmation required] (Stop loss: dependent on where one confirms this area).
USD/CAD:
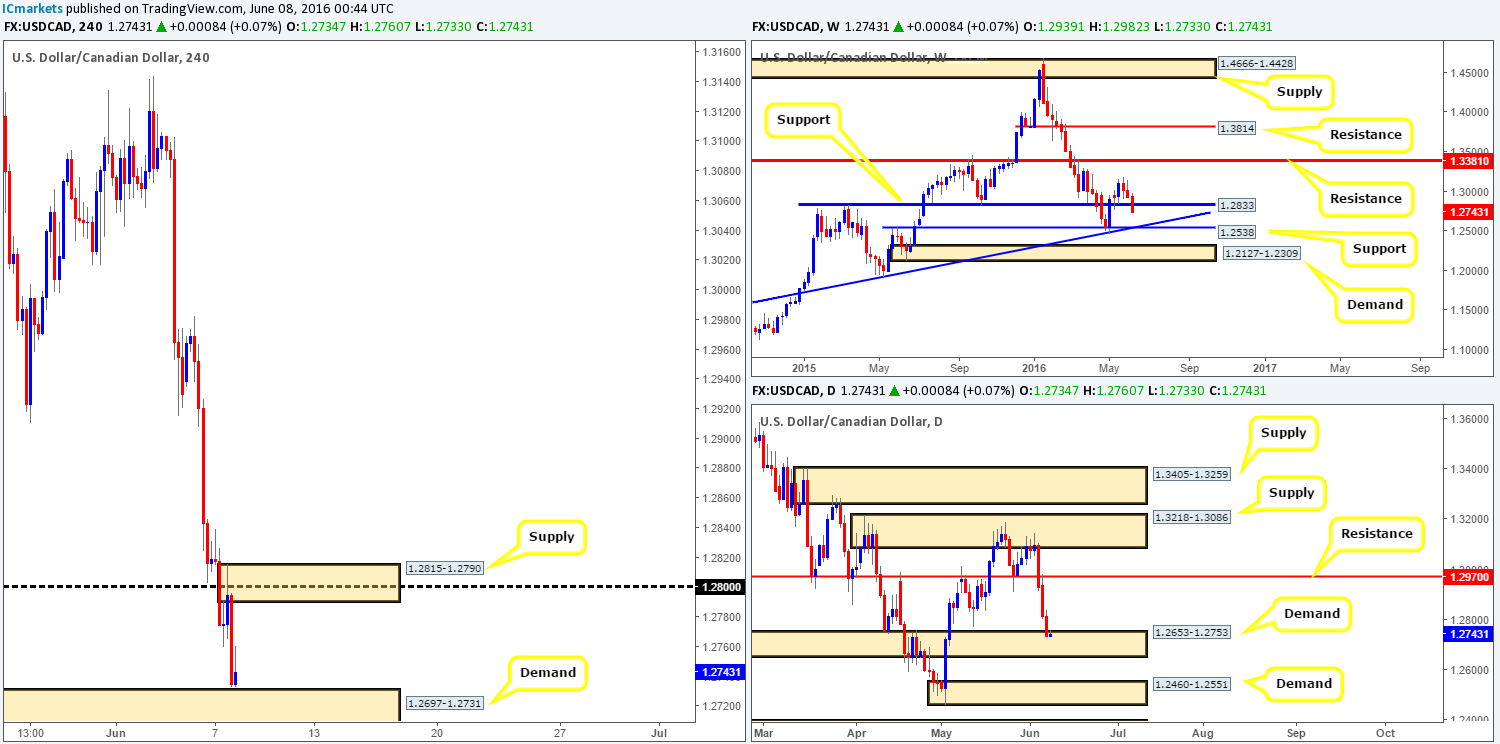
In view of oil finding support above 45.94 on the H4 chart, the USD/CAD once again edged lower yesterday following a retest of the 1.28 handle. This pushed prices down to within touching distance of H4 demand at 1.2697-1.2731. What this sell-off also allowed for was this market to connect with daily demand coming in at 1.2653-1.2753. Despite both the H4 and daily charts showing demand in play, weekly support at 1.2833 appears to be in rather a lot of trouble. Should the daily demand area hold ground this week, there is a chance that we may see the buyers bid prices back above the aforementioned weekly support by the week’s close.
Our suggestions: From our perspective, this pair is not ready to be bought until a close is seen above the H4 supply area at 1.2815-1.2790. Also, selling would not be a good move in our book, since you’d be shorting into daily demand at 1.2653-1.2753. With that in mind, we’ll remain on the sidelines and wait for further developments.
Levels to watch/live orders:
- Buys: Flat (Stop loss: N/A).
- Sells: Flat (Stop loss: N/A).
USD/CHF:
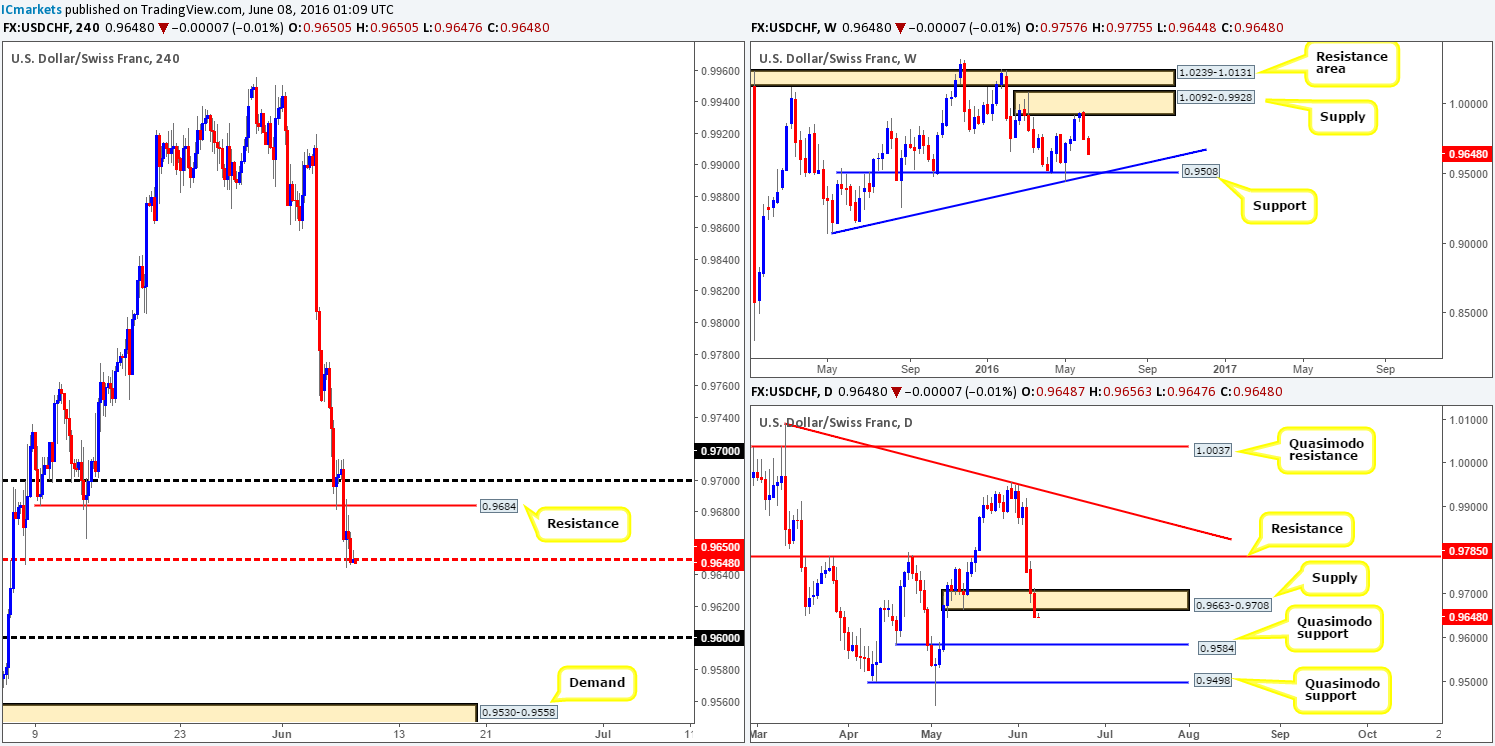
Reporting from the weekly chart this morning, it’s clear that the bears have been in control of this market since price connected with the underside of weekly supply carved from 1.0092-0.9928. With the next target not in view until weekly support seen at 0.9508, this pair, as far as we can see, has the potential to continue selling-off. In-line with what we’re seeing on the weekly chart, the daily chart shows demand at 0.9663-0.9708 was recently taken out (now acting supply), and has possibly opened the trapdoor for a move lower to touch ground with a daily Quasimodo support at 0.9584.
Thanks to yesterday’s selling, H4 action is now seen crossing swords with the H4 mid-way support line at 0.9650. The candles are showing that the bulls are struggling to hold here, suggesting we may see a further decline in value today down to the 0.96 handle, which sits only a few pips above the daily Quasimodo support at 0.9584.
Our suggestions: In light of the weekly picture and the recent break below daily demand (see above) our team is bearish for now. With that being said, we’re going to be watching the lower timeframe price action closely around 0.9650 today for a possible shorting opportunity, targeting 0.96, followed closely by 0.9584 (the daily Quasimodo mentioned above). To see what techniques our team uses to enter the market, please see the top of this report.
Levels to watch/live orders:
- Buys: Flat (Stop loss: N/A).
- Sells: 0.9650 region [Tentative – confirmation required] (Stop loss: dependent on where one confirms this area).
DOW 30:
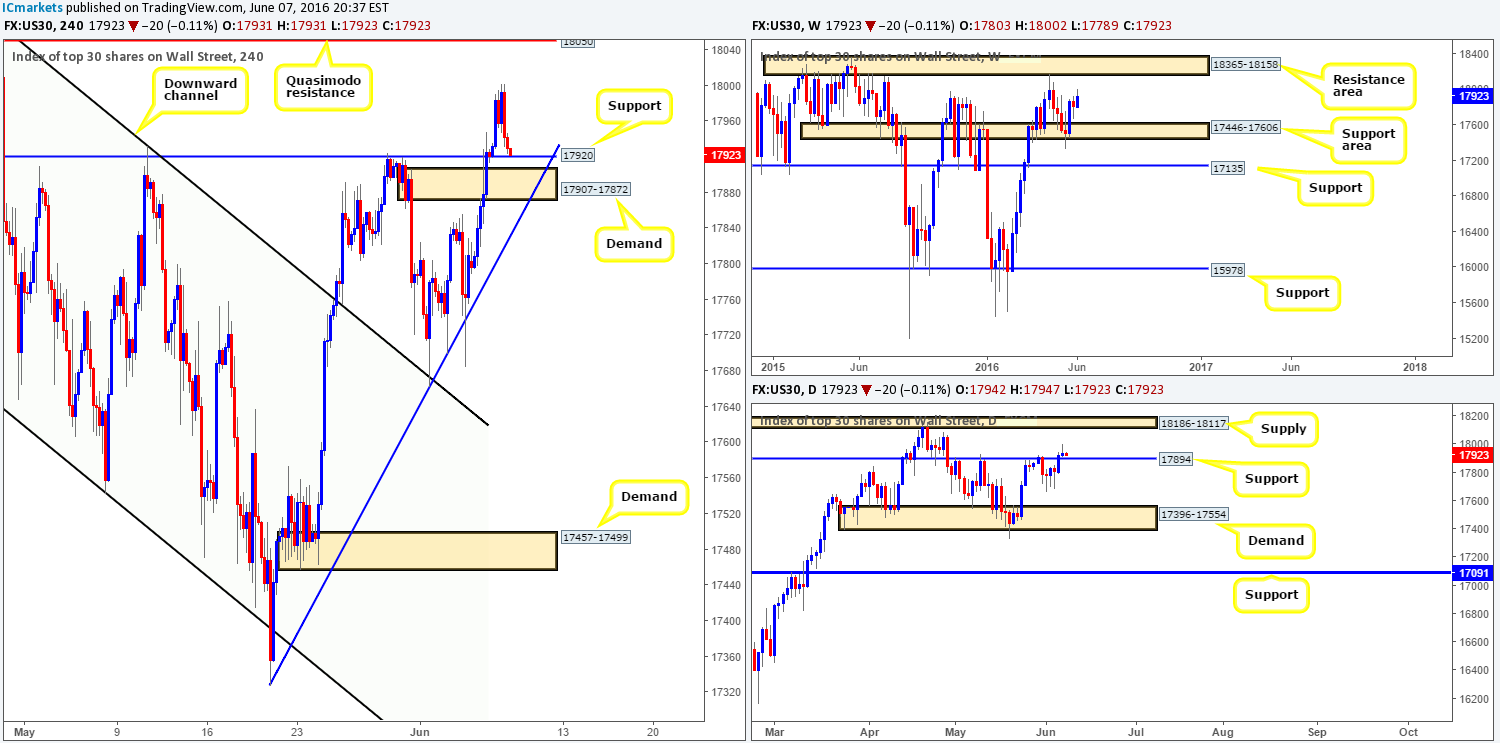
During the course of yesterday’s sessions, the DOW found support around the H4 hurdle at 17920 and gravitated to highs of 18002, before collapsing back down to the aforementioned support by the close. Given that this H4 support is backed by a H4 demand area just below at 17907-17872, which boasts not only H4 trendline confluence from the low 17327, but also a daily support at 17894, longs are certainly a possibility today! In addition to this, we can see that the weekly chart remains in a relatively positive position with room for this index seen to stretch up to a weekly resistance area at 18365-18158 (encapsulates the top-side of the daily supply zone at 18186-18117 – the next upside target on that timeframe).
Our suggestions: Watch the lower timeframes for an entry long off of the H4 support at 17920 (for lower timeframe entry techniques, see the top of this report), targeting the H4 Quasimodo resistance barrier at 18050 (positioned just below the daily supply area mentioned above at 18186-18117).
Levels to watch/live orders:
- Buys: 17920 region [Tentative – confirmation required] (Stop loss: dependent on where one confirms this area).
- Sells: Flat (Stop loss: N/A).
GOLD:
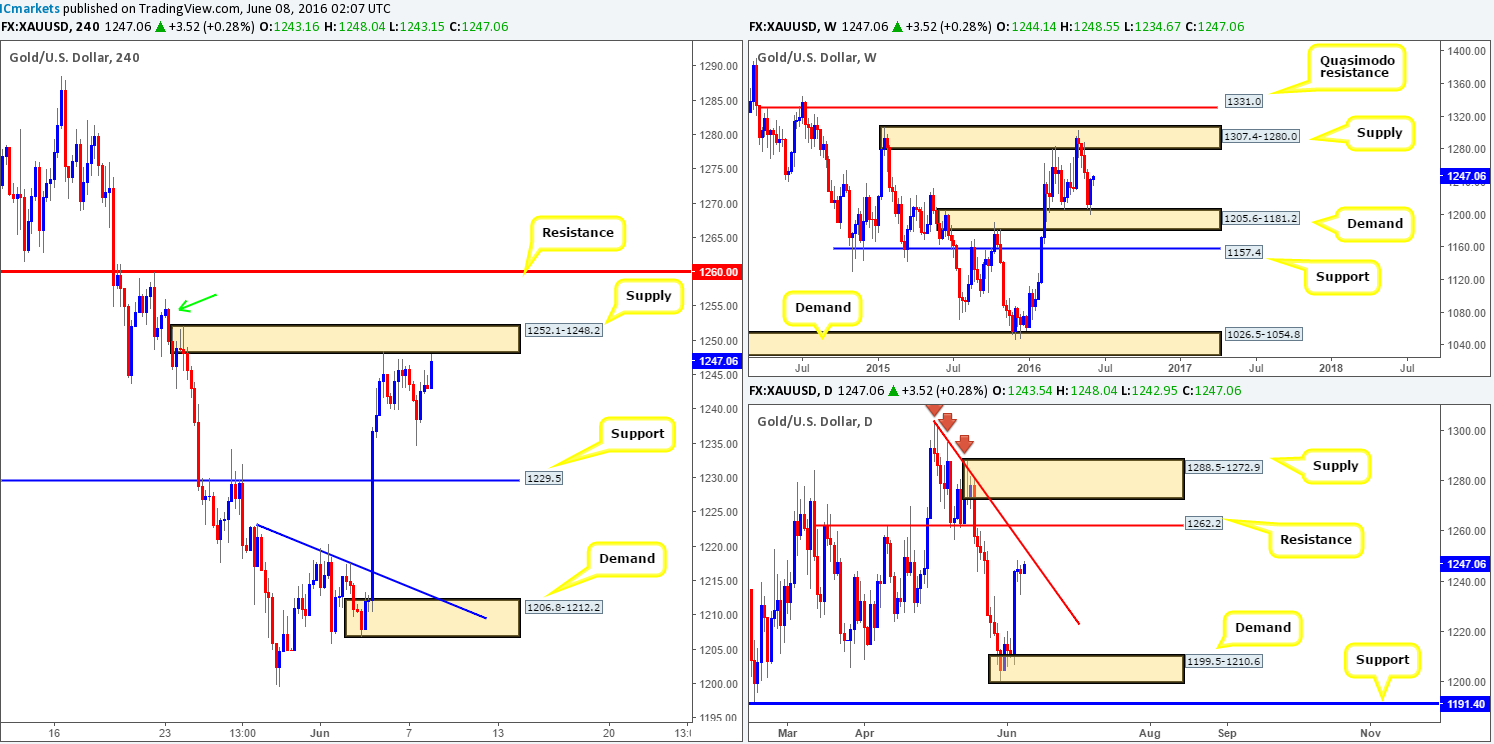
Given the display of strength currently being seen from weekly demand at 1205.6-1181.2, further buying is certainly plausible. The next upside target from this angle can be seen at weekly supply coming in at 1307.4-1280.0. Although weekly bulls appear in good shape at the moment, daily bears could potentially make an appearance at the steep daily trendline extended from the high 1303.6.
Scanning the H4 chart, we can see that the yellow metal is once again trading within shouting distance of H4 supply drawn from 1252.1-1248.2. Since we know there is room for this market to advance on the higher timeframes, it is likely that this H4 supply will eventually give way. However, the small H4 supply seen marked with a green arrow at 1256.0-1253.8 may see a reaction as it ties in beautifully with the aforementioned daily trendline. The bounce from this area could be short-lived, nevertheless, as do not forget where price is trading from on the weekly chart (see above).
Our suggestions: Keep a close eye on the small H4 demand marked with a green arrow at 1256.0-1253.8 for a bounce lower. We would highly recommend waiting for lower timeframe confirmation (see the top of this report for confirming techniques) before risking capital here, since getting caught on the wrong side of the weekly buyers would not likely be a pleasant experience!
Levels to watch/live orders:
- Buys: Flat (Stop loss: N/A).
- Sells: 1256.0-1253.8 [Tentative – confirmation required] (Stop loss: dependent on where one confirms this area).


