
Key risk events today:
EU Economic Forecasts; Crude Oil Inventories.
(Previous analysis as well as outside sources – italics).
EUR/USD:
Tuesday had the US dollar index attempt to regain a bullish footing on a downturn in risk sentiment, but remains prone to further weakness after failing to sustain gains through the 97.00 handle.
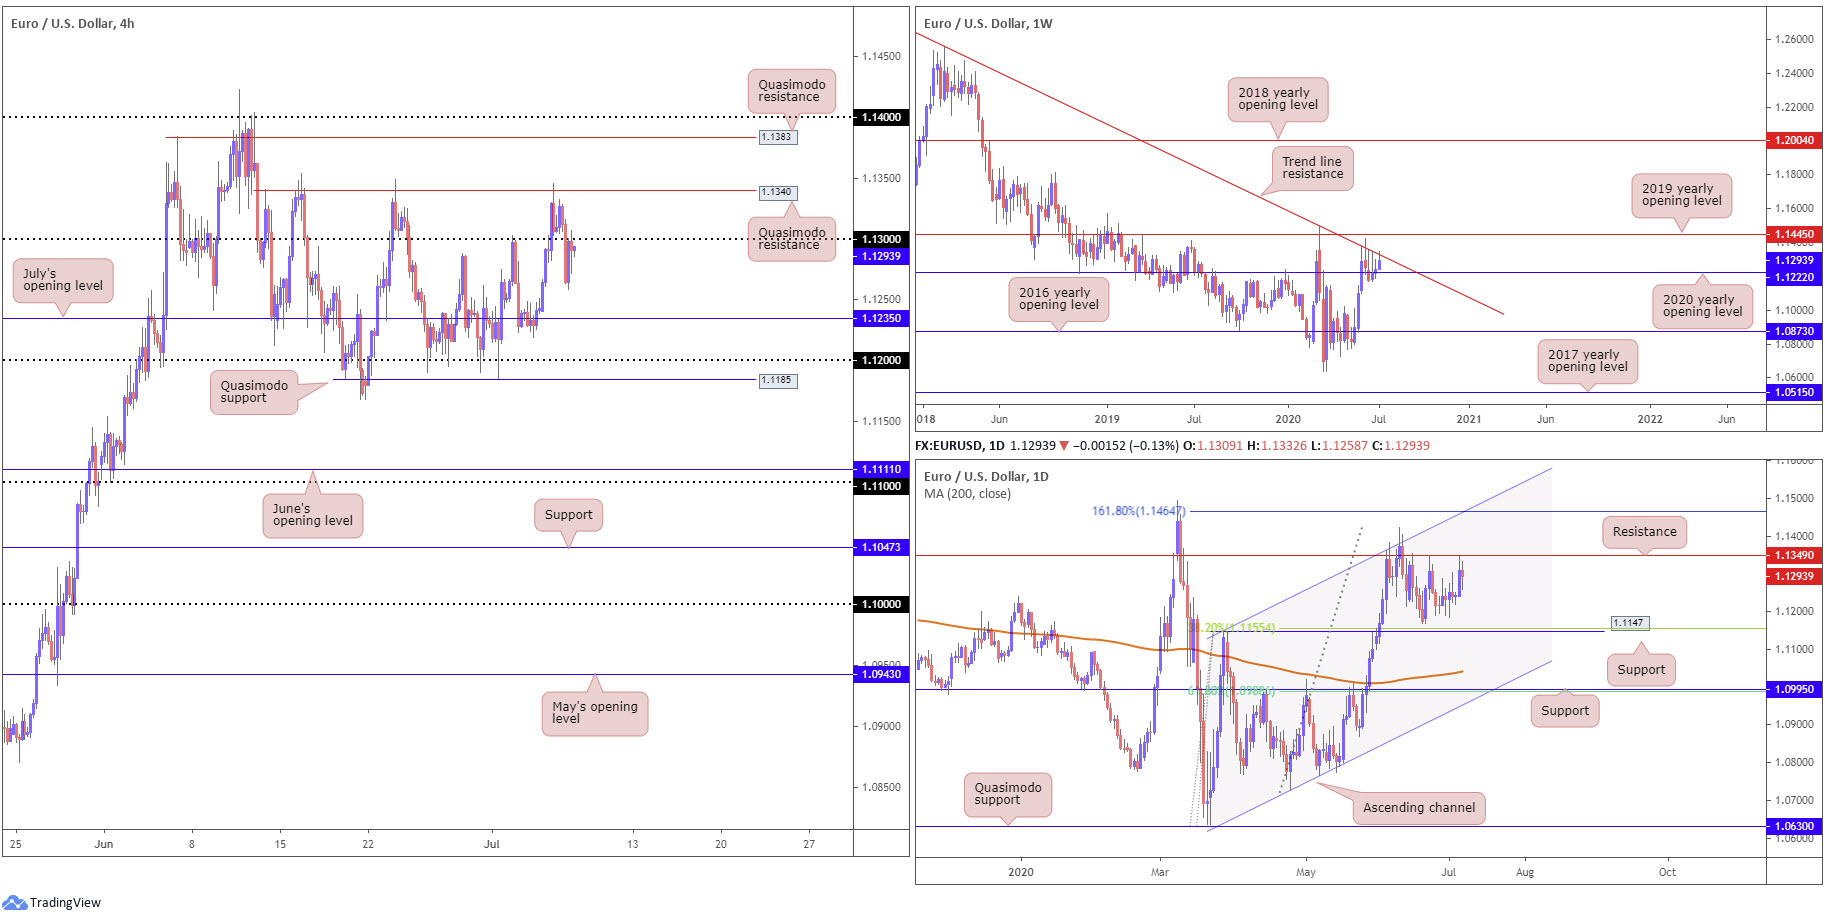
EUR/USD, based on the H4, swung beneath 1.13 to lows at 1.1258, though corrected back to 1.13 and held into the European close. South of 1.13, traders’ crosshairs will likely be fixed on July’s opening level at 1.1235, with a break likely to see price hone in on 1.12. Above 1.13, assuming we overtake H4 Quasimodo resistance at 1.1340, we could be looking at Quasimodo resistance at 1.1383 as the next upside target.
Trade on the weekly timeframe remains sandwiched between the 2020 yearly opening level at 1.1222 and long-standing trend line resistance, taken from the high 1.2555. Further buying here shifts focus to the possibility of reaching the 2019 yearly opening level at 1.1445, while a dip to lower levels highlights the 2016 yearly opening level at 1.0873.
Since the beginning of June on the daily timeframe, resistance at 1.1349 has capped upside. Monday’s lift brought price action to within striking distance of the aforementioned resistance and Tuesday finished unchanged within the prior day’s range. Breaking 1.1349 points to a 161.8% Fibonacci extension point at 1.1464, while a decisive rejection, assuming we overrun the 1.1168 June 22 low, has support from the 1.1147 27 March high in view, a level that merges closely with a 38.2% Fibonacci retracement ratio at 1.1155.
Areas of consideration:
H4 knocking on the underside of 1.13 as resistance has clearly drew attention from sellers. Coupled with weekly trend line resistance in play and daily resistance at 1.1349 hovering nearby, traders may find use in the 1.13 base today and take aim at July’s opening level from 1.1235. Conservative traders, given round numbers are often prone to whipsaws, may seek additional confirmation before pulling the trigger, such as a H4 bearish candlestick formation.
GBP/USD:
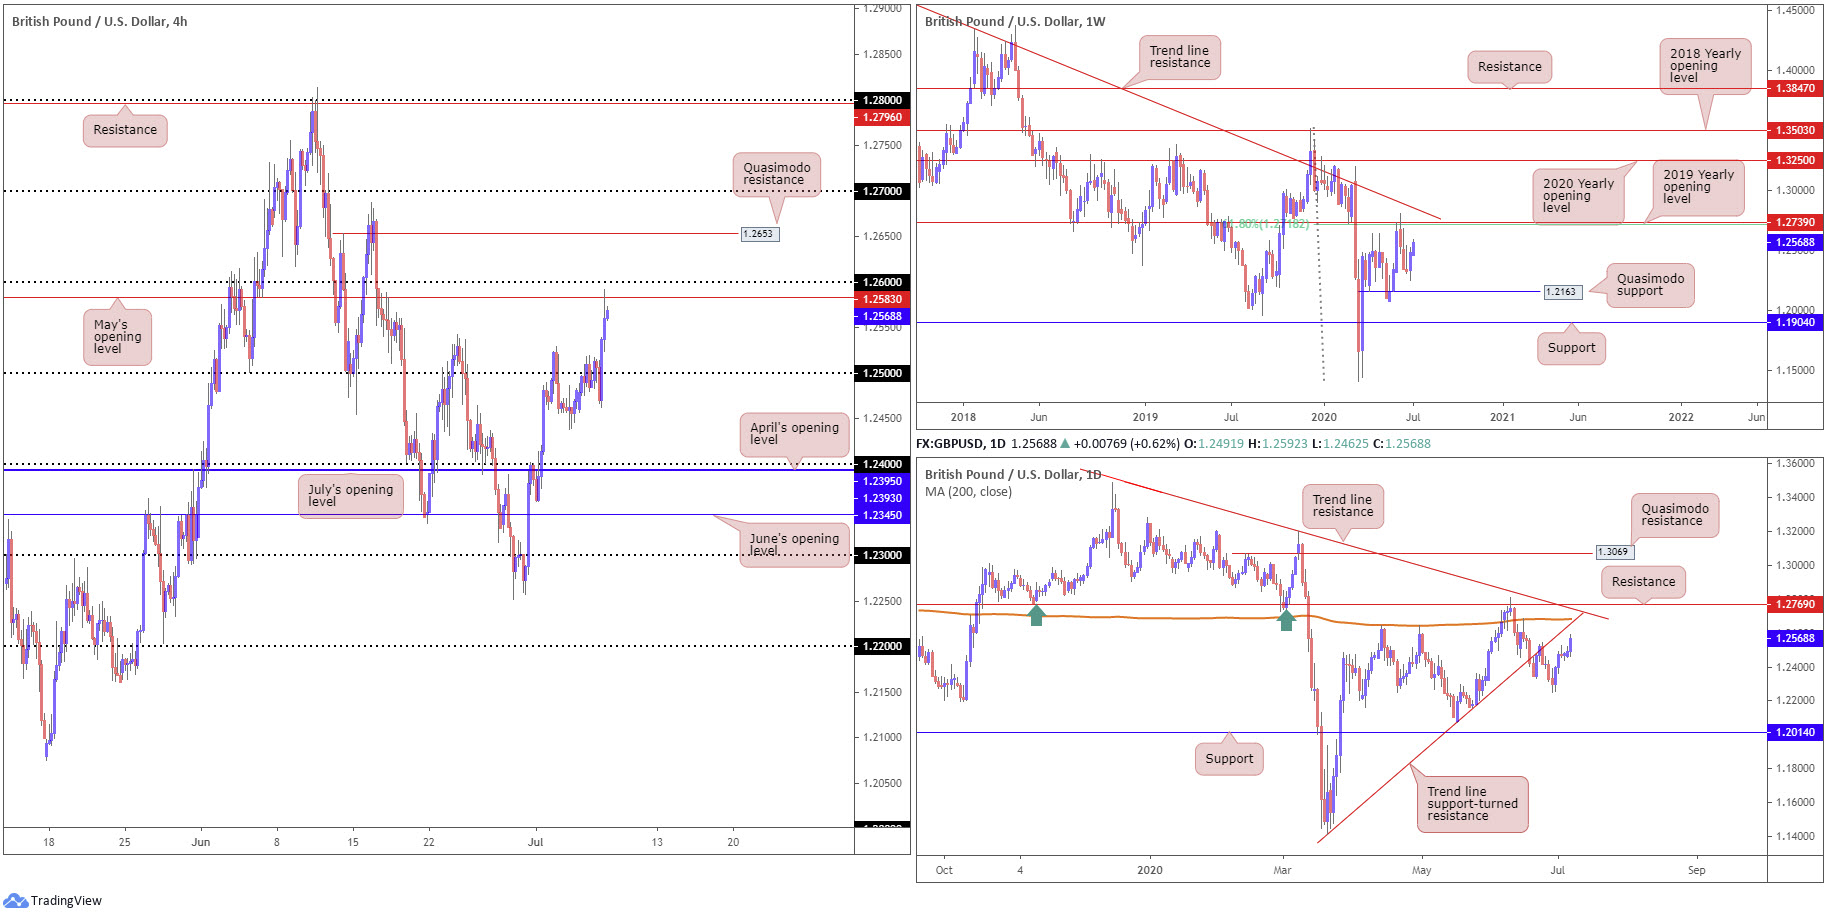
After a phase of indecision around 1.25, sterling gained traction against the buck mid-way through London on Tuesday. This eventually saw price action shake hands with May’s opening level at 1.2583 on the H4, a base sited just south of the 1.26 handle. Space above the two aforementioned structures shows room to approach Quasimodo resistance at 1.2653.
With respect to structure on the weekly timeframe, support resides at 1.2163, a Quasimodo formation. Follow-through buying, nevertheless, may eventually see price meet with a 61.8% Fibonacci retracement ratio at 1.2718 and 2019 yearly opening level at 1.2739.
Price movement on the daily timeframe, meanwhile, is poised to run into trend line support-turned resistance, taken from the low 1.1409, converging closely with the 200-day SMA (orange – 1.2684). This is closely followed by resistance at 1.2769 and trend line resistance, taken from the high 1.3514.
Areas of consideration:
For those who read Tuesday’s technical briefing you may recall the following (italics):
Fracturing 1.25 to the upside would likely appeal to breakout buyers, in pursuit of May’s opening level at 1.2583 and 1.26. Both the weekly and daily timeframes also display scope to climb.
Going forward, it appears we still have room to climb on the bigger picture until reaching the 1.27 neighbourhood, which is a point of strong higher-timeframe resistance. For that reason, although a response may be seen from 1.26 as resistance today, chart studies suggests further buying is in store. Therefore, a break above 1.26 will may draw in buyers, targeting H4 Quasimodo resistance at 1.2653 and then 1.27.
AUD/USD:
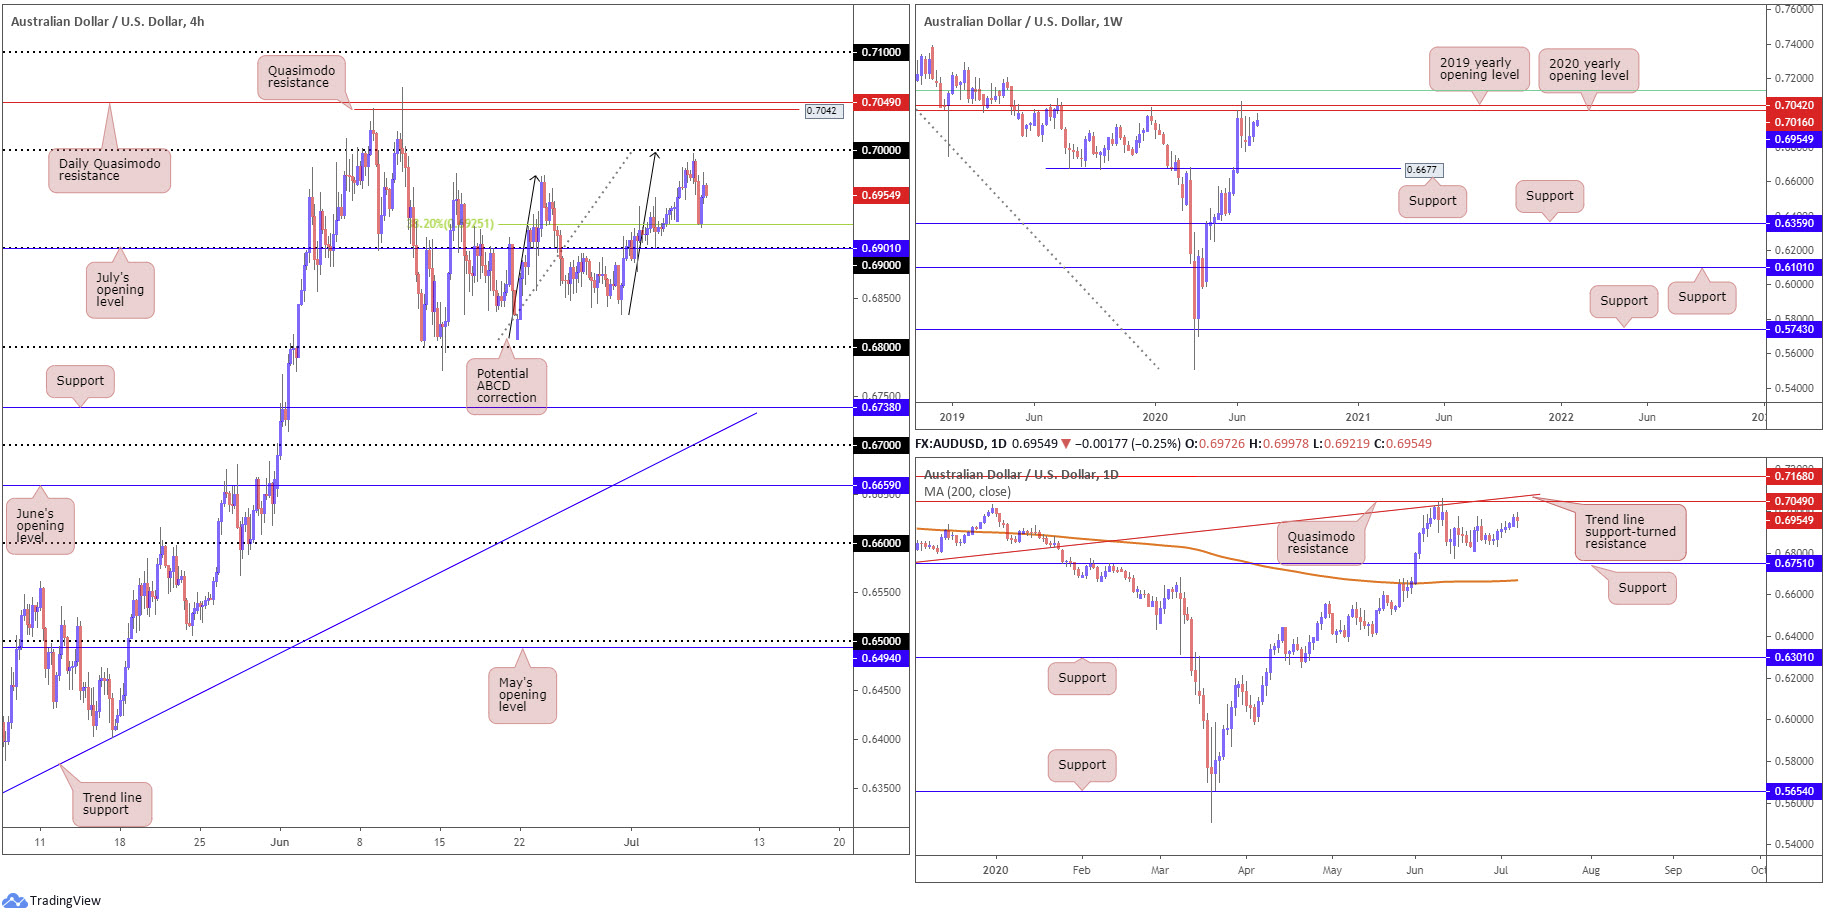
Amid a downturn in risk sentiment and the US dollar index attempting to take control of 97.00, AUD/USD faded levels just south of the key figure 0.70 Tuesday, specifically the H4 ABCD correction (black arrows) at 0.6997. As evident from the H4 chart, the dip lower tested the 38.2% Fibonacci retracement ratio at 0.6925, generally looked upon as the initial take-profit target out of ABCD patterns, derived from legs A-D. 0.6925 is a point that likely had sellers bank partial profits and reduce risk to breakeven.
A break of 0.70 today would expose Quasimodo resistance at 0.7042 and daily Quasimodo resistance at 0.7049. Note on the daily timeframe we also see the Quasimodo merging with trend line support-turned resistance, taken from the low 0.6670. Attention on the daily timeframe also remains at support coming in from 0.6751.
Resistance, forged in the shape of a 2020 yearly opening level and a 2019 yearly opening level, at 0.7016 and 0.7042, respectively, continues to offer a central presence nearby on the weekly timeframe. It might also interest traders to note just above the said resistances we have a 61.8% Fibonacci retracement ratio at 0.7128 (green). In terms of support, crosshairs remain fixed on 0.6677.
Areas of consideration:
Well done to any readers who managed to jump aboard short positions yesterday. The combination of 0.70 and H4 ABCD approach was a noted setup to watch for in Tuesday’s technical briefing.
Should we hold above the 38.2% Fibonacci retracement ratio at 0.6925 on the H4, with the round number 0.70 sharing space with weekly resistance at 0.7016, the 2020 yearly opening level, this remains a key point of resistance going into Wednesday.
USD/JPY:
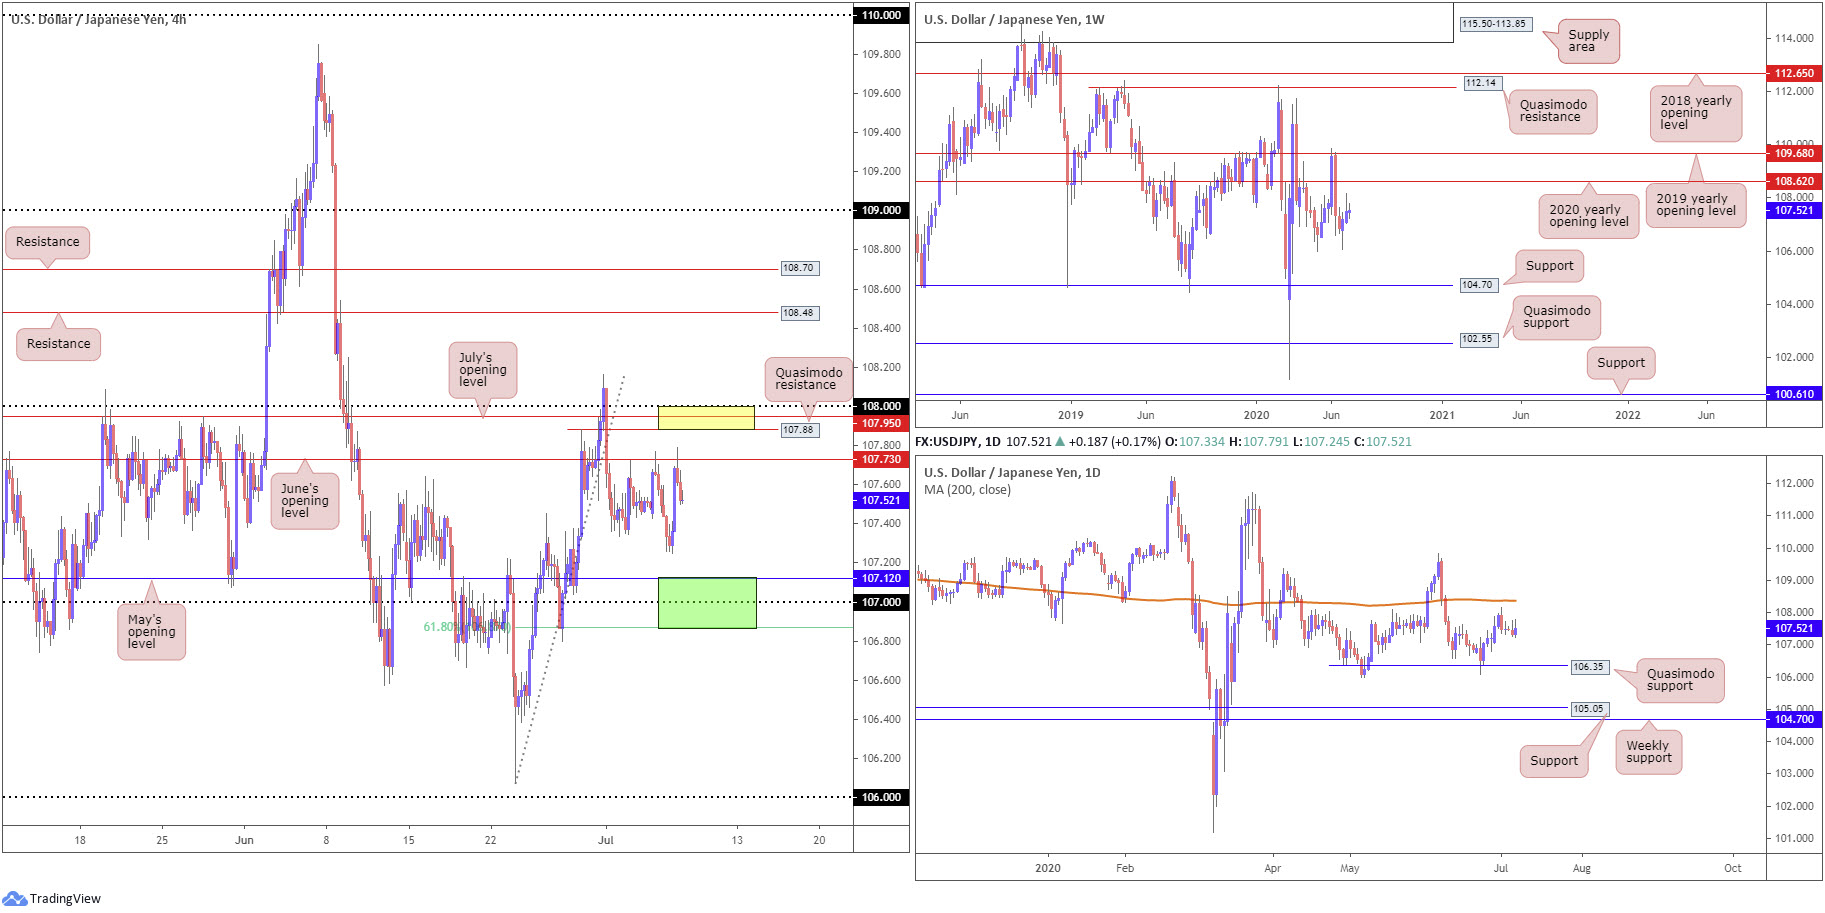
Bottoming at lows from 107.24 in the early hours of trade Tuesday prompted a healthy wave of buying during Europe, enough for USD/JPY to cross swords with June’s opening level at 107.73 on the H4. Buyers took a step back into US trade, generating a mild pullback. Above 107.73, traders will be watching Quasimodo resistance at 107.88, followed by July’s opening level at 107.95 and the 108 handle. South of yesterday’s low, we can see support formed in the shape of May’s opening level at 107.12, followed by 107 and the 61.8% Fibonacci retracement ratio at 106.87.
Resistance rests reasonably close by on the weekly timeframe by way of the 2020 yearly opening level at 108.62, followed by the 2019 yearly opening level at 109.68. Support remains fixed around the 105.98 6th May low, with a break uncovering long-term support at 104.70.
Last week on the daily timeframe, price action pencilled in a top a few pips shy of the 200-day SMA (orange – 108.37), shaped by way of a bearish outside day. The recent top (and candle formation), given the indecisive movement witnessed since, draws attention back to Quasimodo support at 106.35, the origin of the recent leg higher.
Areas of consideration:
The area between 108, July’s opening level at 107.95 and Quasimodo resistance at 107.88 on the H4 (yellow) echoes a reasonably dominant resistance zone to watch going forward. However, traders are urged to pencil in the possibility of a fakeout through the area to the 200-day SMA at 108.37.
Another area of interest on the H4 is a support base seen between May’s opening level at 107.12, 107 and the 61.8% Fibonacci retracement ratio at 106.87 (green).
Both areas lack higher-timeframe convergence, therefore traders may seek additional confirmation before engaging.
USD/CAD:
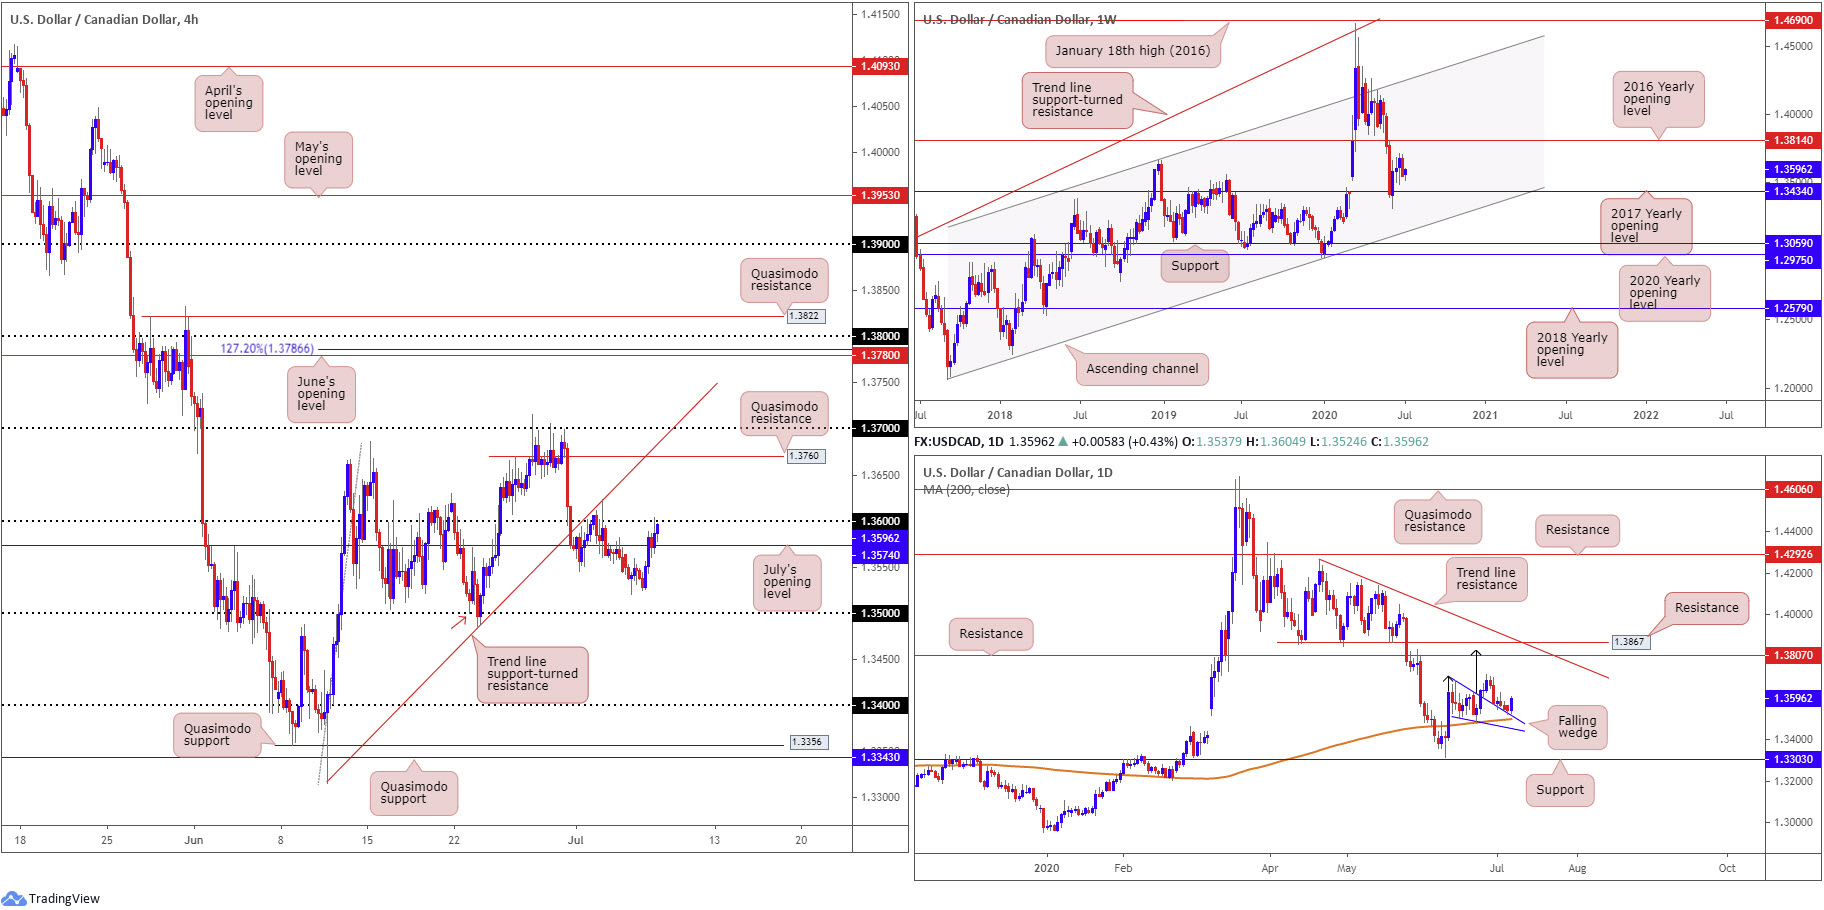
Leaving the 1.35 handle unchallenged, the US dollar marched higher vs. its Canadian counterpart Tuesday. Momentum overthrew July’s opening level at 1.3574 on the H4 timeframe, a change that led to a revisit of 1.36.
Sellers are unlikely to commit under 1.36 today due to where we’re coming from on the daily timeframe. Price movement is seen retesting the top edge of a breached falling wedge pattern as support (1.3686/1.3504), sited just ahead of the 200-day SMA (1.3498). Take-profit targets out of a falling wedge pattern can be measured by taking the base value and adding this figure to the breakout point (black arrows), which as you can see in this case, converges closely with the next daily resistance at 1.3807, followed closely by another layer of resistance at 1.3867.
On the weekly timeframe, last week’s action positioned the 2017 yearly opening level at 1.3434 in the firing range. Beyond 1.3434, channel support, taken from the low 1.2061, can be seen as the next potential floor. A USD/CAD bid, on the other hand, throws the 2016 yearly opening level at 1.3814 in the pot as feasible resistance, with follow-through buying likely to try and tackle a dense block of supply between 1.4190/1.3912.
Areas of consideration:
Usually the higher timeframes (daily structure) take precedence over lower-timeframe levels (H4 structure). For that reason, traders are likely honing in on a H4 close above 1.36 today for bullish scenarios, targeting H4 Quasimodo resistance at 1.3760, followed by 1.37 and H4 trend line support-turned resistance, extended from the low 1.3315. Conservative traders may opt to wait and see if a retest at 1.36 materialises before committing, in order to help avoid a fakeout.
USD/CHF:
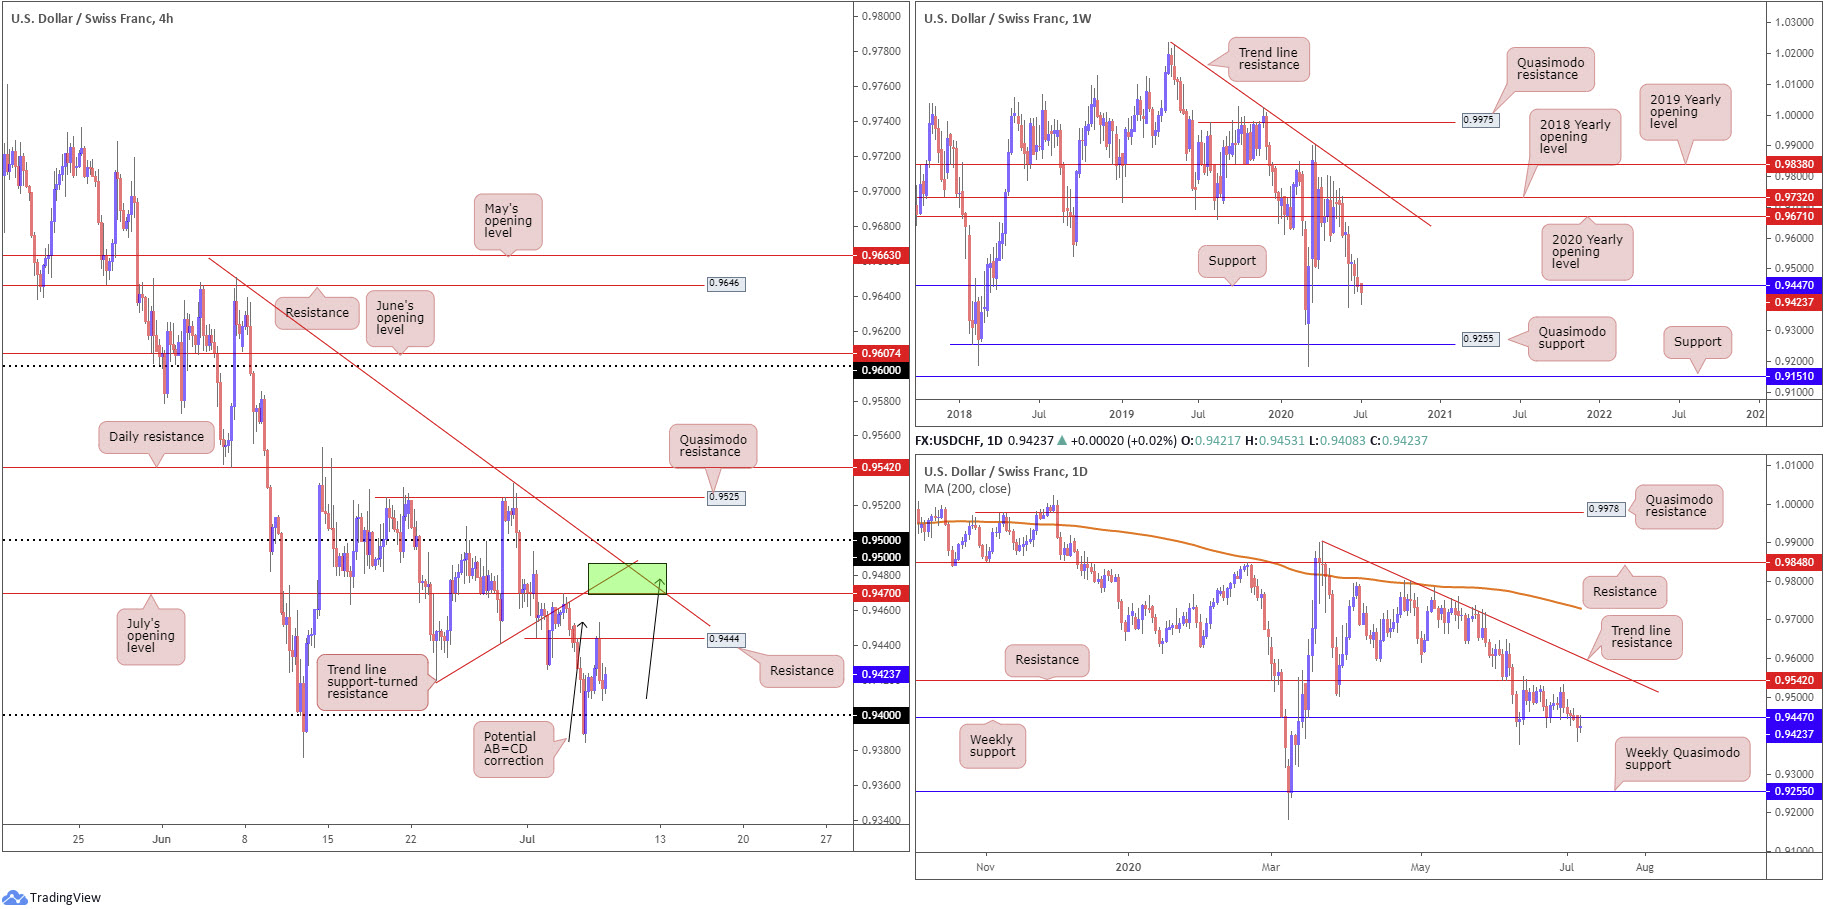
For those who read Tuesday’s technical briefing you may recall the research team underlined H4 resistance at 0.9444 as potentially problematic for buyers. In line with the weekly level at 0.9447, 0.9444 established itself in recent trading, putting across the possibility of another retest at 0.94 today.
A healthy bout of buying today, moves that engulf 0.9444, however, could land H4 at July’s opening level from 0.9470, a level accompanied close by a trend line support-turned resistance, taken from the low 0.9420, another trend line resistance, extended from the high 0.9650, and a potential AB=CD correction (black arrows) at 0.9478 (green). Should we continue to navigate deeper waters today and tunnel through 0.94, a H4 Quasimodo formation at 0.9324 is next on the hit list as visible support.
Areas of consideration:
The green zone, based on the H4 timeframe, between 0.9486/0.9470 is marked as a reasonably dominant resistance to be aware of today.
Traders will also be watching for H4 to establish ground under 0.94 to attack bearish themes, targeting Quasimodo support at 0.9324.
Dow Jones Industrial Average:
US equities dipped across the board Tuesday as investors sought safer assets. The Dow Jones Industrial Average dropped 396.85 points, or 1.51%; the S&P 500 dipped 34.40 points, or 1.08%, and the tech-heavy Nasdaq 100 concluded lower by 80.05 points, or 0.75%.
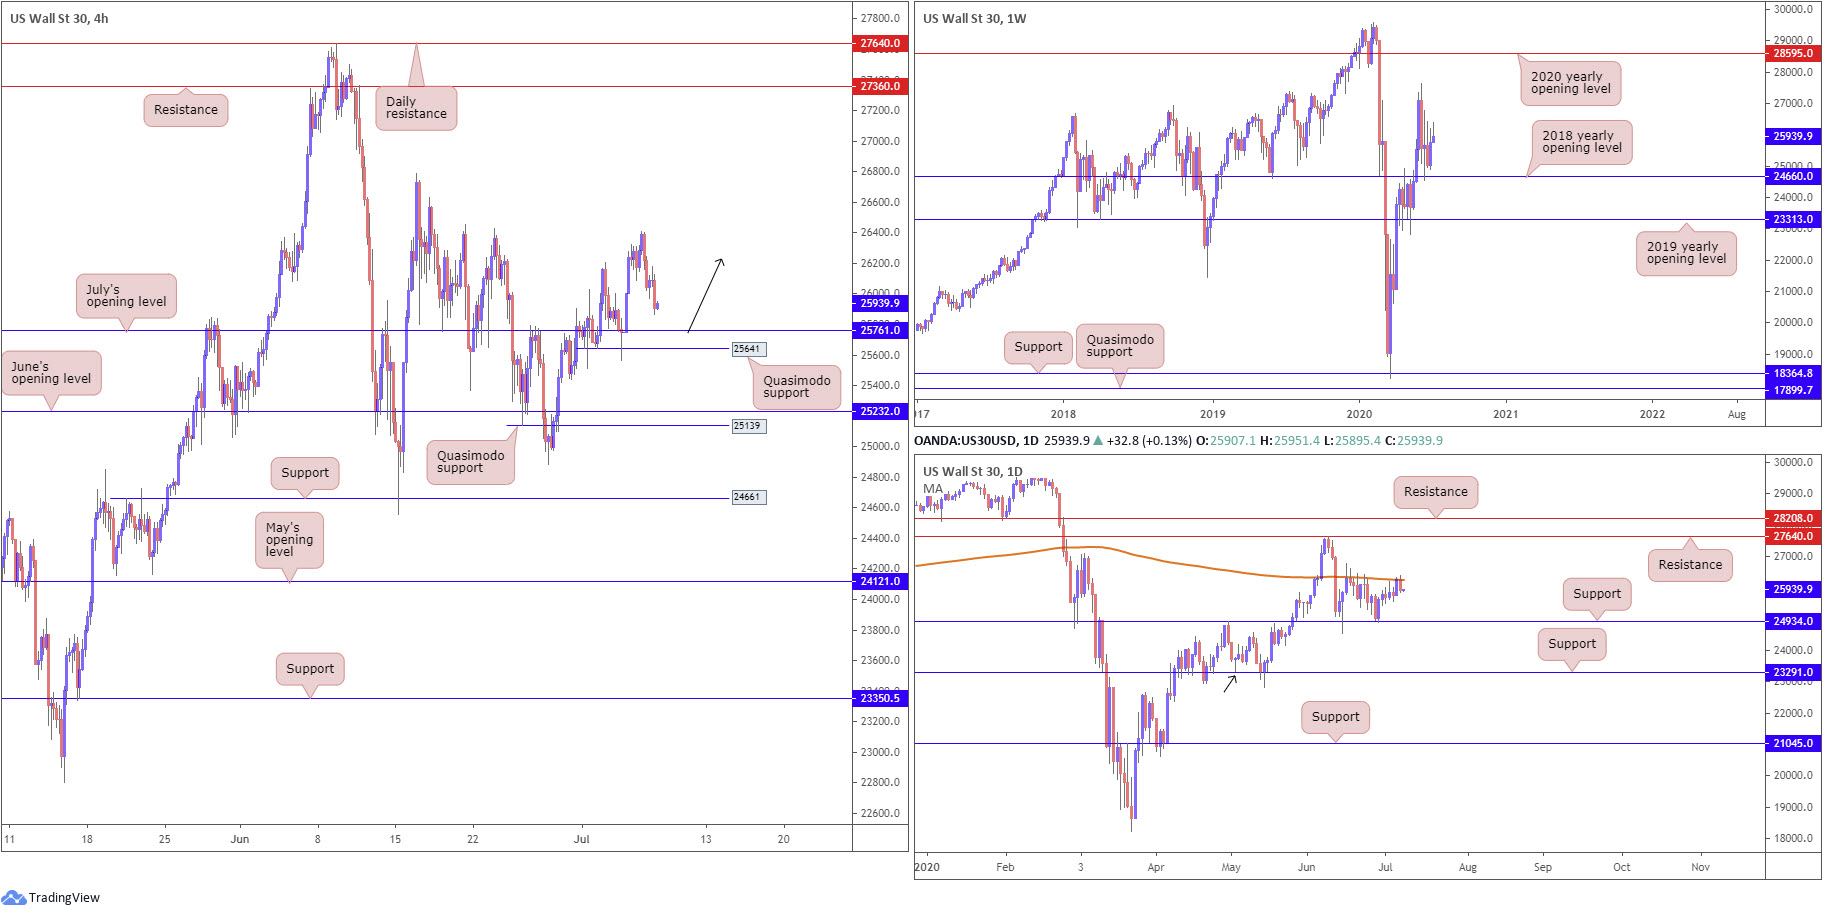
Technically speaking, yesterday’s decline positioned H4 candles within striking distance of July’s opening level at 25761, closely shadowed by Quasimodo support at 25641. This is an area traders will likely have on the watchlist today.
The 2018 yearly opening level at 24660 remains an important base of support on the weekly timeframe, as price action continues to make progress north of the level. In the event buyers manage to keep their head above water here, we might pull in the 27638 high, followed by the 2020 yearly opening level at 28595.
Since June 15, price action on the daily timeframe has been ranging between the 200-day SMA (orange – 26250) and support from 24934. As evident from the chart, the aforementioned SMA held firm yesterday as resistance. Yet, a break of this barrier not only confirms upside strength on the weekly timeframe, it shines the spotlight on daily resistance from 27640.
Areas of consideration:
July’s opening level at 25761 on the H4 timeframe and Quasimodo support at 25641 are likely of interest today among intraday traders. Buyers out of this region, however, are urged to consider waiting for additional confirmation to form before pulling the trigger as the 200-day SMA resistance is also in play.
XAU/USD (GOLD):
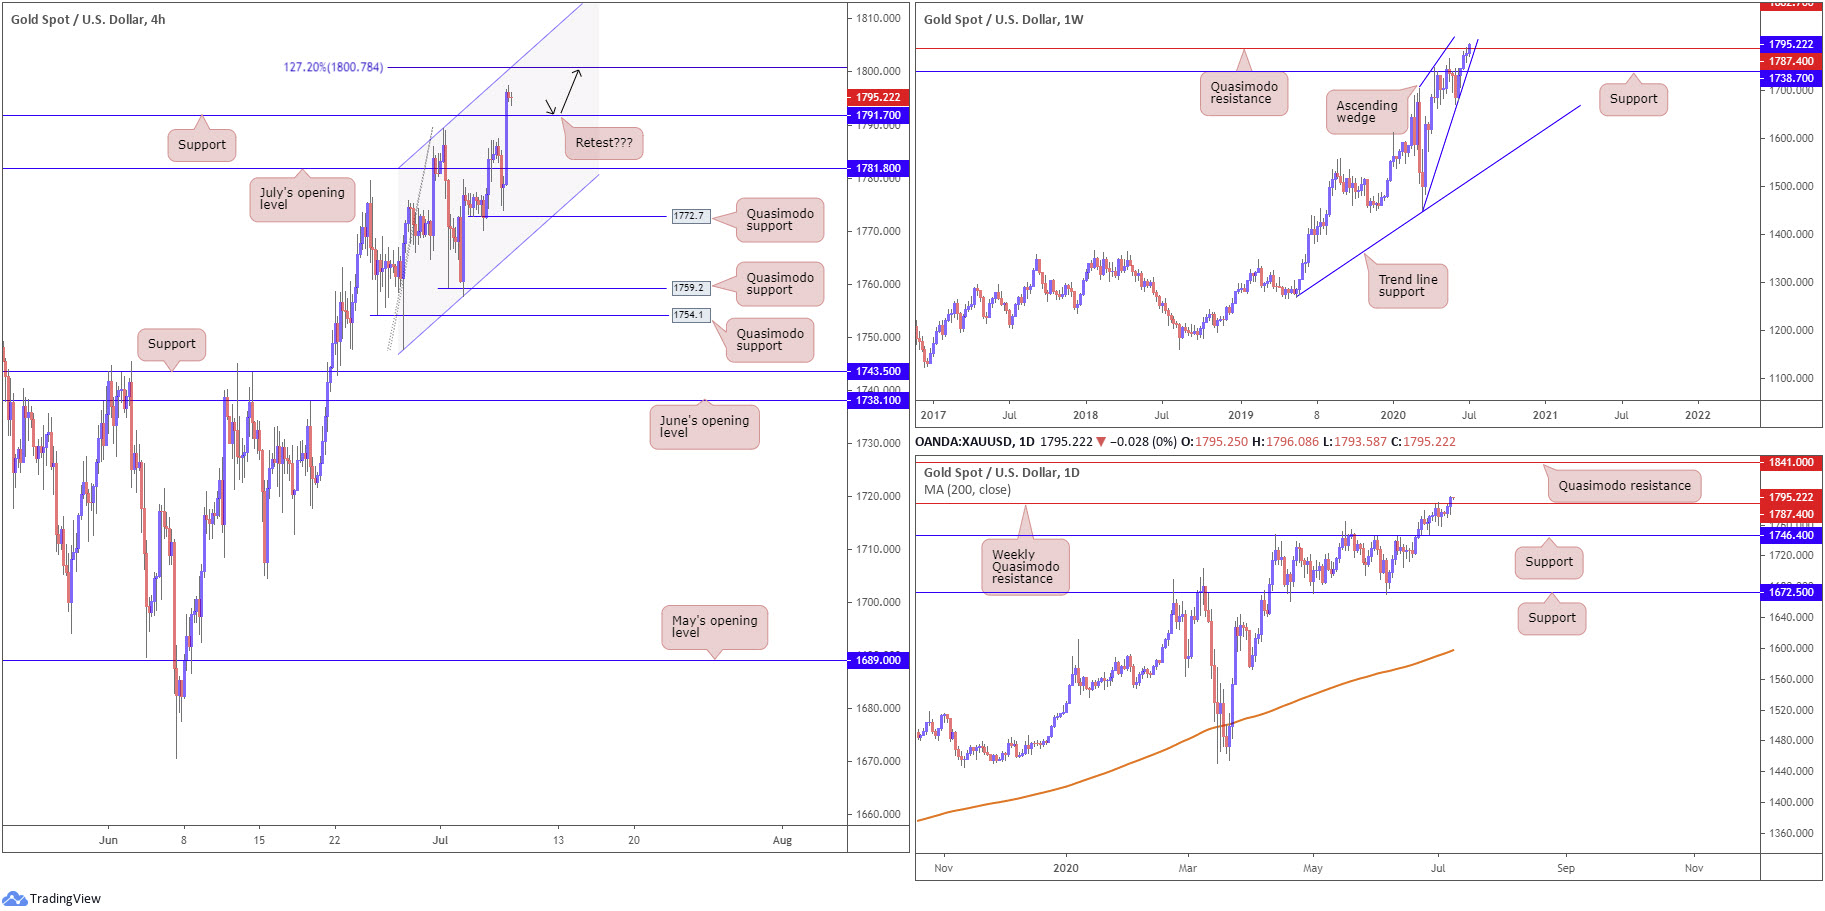
Kicking things off from the weekly timeframe this morning, we can see price action nudged above Quasimodo resistance at 1787.4. Breaking 1787.4, as the underlying trend suggested (trending higher since 2016), may lay the foundation for continuation buying to resistance stationed at 1882.7. Also of interest on the weekly timeframe is a potential ascending wedge pattern forming between 1451.4/1703.6.
Weekly Quasimodo resistance at 1787.4 also remained a central resistance on the daily timeframe. After crossing this barrier, the pendulum appears to be swinging in favour of a run to a daily Quasimodo formation at 1841.0.
Tuesday scored fresh multi-year highs a touch under the 1800.0 level as global equities explored lower levels. With respect to technical structure here, support resides close by at 1791.7, a prior Quasimodo resistance level, whereas resistance, aside from 1800.0, can be found at a 127.2% Fibonacci extension point at 1800.7, coupled with channel resistance, extended from the high 1789.2.
Areas of consideration:
Consuming (closing above) weekly Quasimodo resistance at 1787.4 will help confirm the underlying uptrend.
Today, meanwhile, traders may seek a retest at H4 support from 1791.7, targeting the 1800.0 region (127.2% Fibonacci extension point at 1800.7) as an initial take-profit zone.
The accuracy, completeness and timeliness of the information contained on this site cannot be guaranteed. IC Markets does not warranty, guarantee or make any representations, or assume any liability regarding financial results based on the use of the information in the site.
News, views, opinions, recommendations and other information obtained from sources outside of www.icmarkets.com.au, used in this site are believed to be reliable, but we cannot guarantee their accuracy or completeness. All such information is subject to change at any time without notice. IC Markets assumes no responsibility for the content of any linked site.
The fact that such links may exist does not indicate approval or endorsement of any material contained on any linked site. IC Markets is not liable for any harm caused by the transmission, through accessing the services or information on this site, of a computer virus, or other computer code or programming device that might be used to access, delete, damage, disable, disrupt or otherwise impede in any manner, the operation of the site or of any user’s software, hardware, data or property.


