
A note on lower timeframe confirming price action…
Waiting for lower timeframe confirmation is our main tool to confirm strength within higher timeframe zones, and has really been the key to our trading success. It takes a little time to understand the subtle nuances, however, as each trade is never the same, but once you master the rhythm so to speak, you will be saved from countless unnecessary losing trades. The following is a list of what we look for:
- A break/retest of supply or demand dependent on which way you’re trading.
- A trendline break/retest.
- Buying/selling tails/wicks – essentially we look for a cluster of very obvious spikes off of lower timeframe support and resistance levels within the higher timeframe zone.
- Candlestick patterns. We tend to stick with pin bars and engulfing bars as these have proven to be the most effective.
We typically search for lower-timeframe confirmation between the M15 and H1 timeframes, since most of our higher-timeframe areas begin with the H4. Stops are usually placed 3-5 pips beyond confirming structures.
EUR/USD:
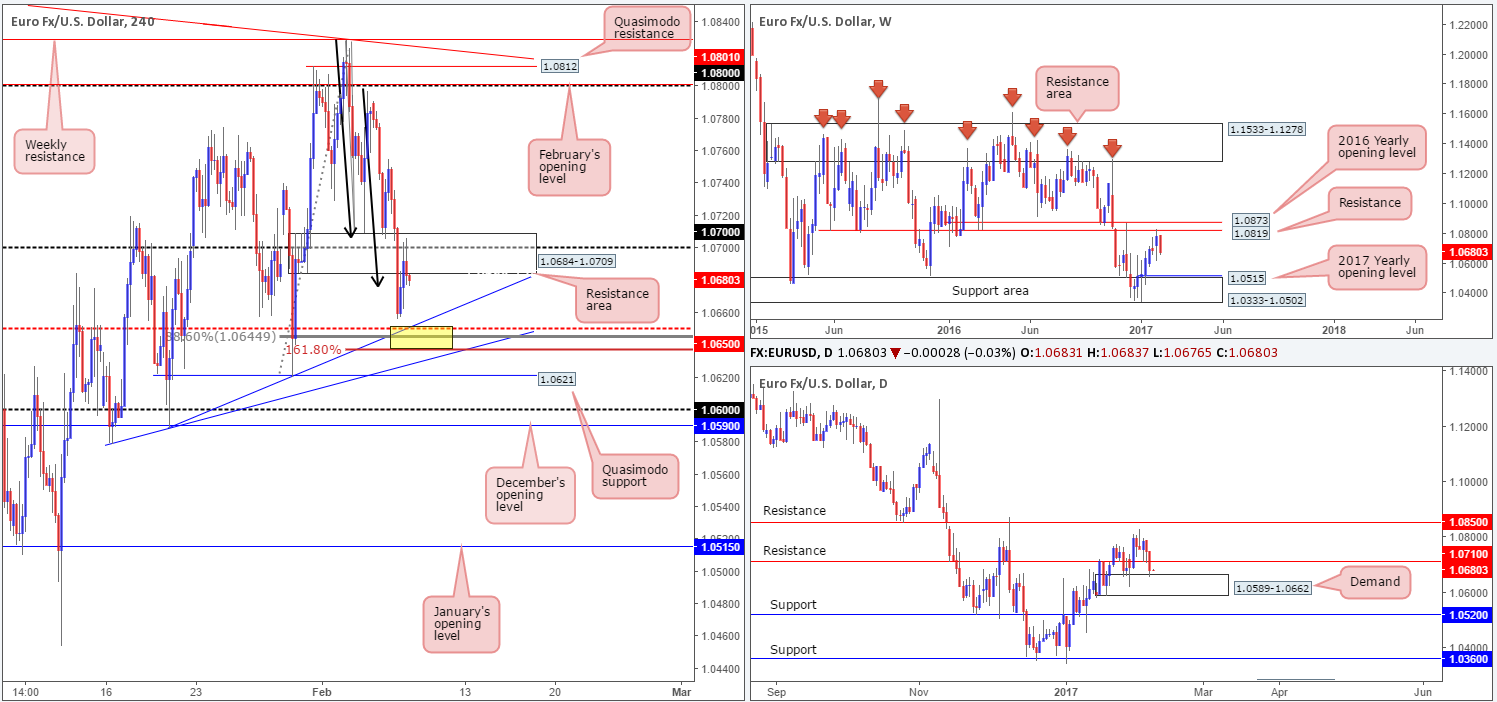
The EUR continued to sag against its US counterpart yesterday, as the US dollar advanced against the majority of its trading peers. H4 demand at 1.0684-1.0709 along with the 1.07 psychological handle housed within, were both wiped out, allowing price to clock a low of 1.0656 and retest the aforementioned H4 broken demand as a resistance area.
From a technical perspective, the weekly timeframe is trading with a reasonably strong downside bias at the moment. With the weekly resistance at 1.0819 holding firm, the next support target on tap falls in at around a weekly support area drawn from 1.0333-1.0502. While this may be true, we also have to take into consideration the fact that the daily candles are now seen checking in with a daily demand base at 1.0589-1.0662.
Our suggestions: Although weekly price indicates further selling may be on the cards, we really like the look of the H4 mid-way support at 1.0650. This level boasts a H4 AB=CD 161.8% ext. at 1.0637, a deep 88.6% retracement at 1.0644, a H4 trendline support etched from the low 1.0589 (yellow zone) and is seen positioned within the above noted daily demand area. One could also say that there’s a possible H4 three-drive approach in play as well. Ideally, we’ll be looking to enter just above 161.8% ext. today, with stops placed 2-3 pips below the H4 Quasimodo support at 1.0621. That way, should a fakeout be seen beyond the 161.8% ext. there’s another H4 trendline seen just below (1.0579) to support our trade. Just to be clear here, we are not looking for a reversal off this area. A bounce is all that’s expected due to what’s been noted on the weekly timeframe.
Data points to consider: There are no scheduled high-impacting news events on the docket today relating to these two markets.
Levels to watch/live orders:
- Buys: 1.0637/1.0650 ([an area that can, dependent on the time of day, possibly be traded without additional confirmation] stop loss: 1.0619).
- Sells: Flat (stop loss: N/A).
GBP/USD:
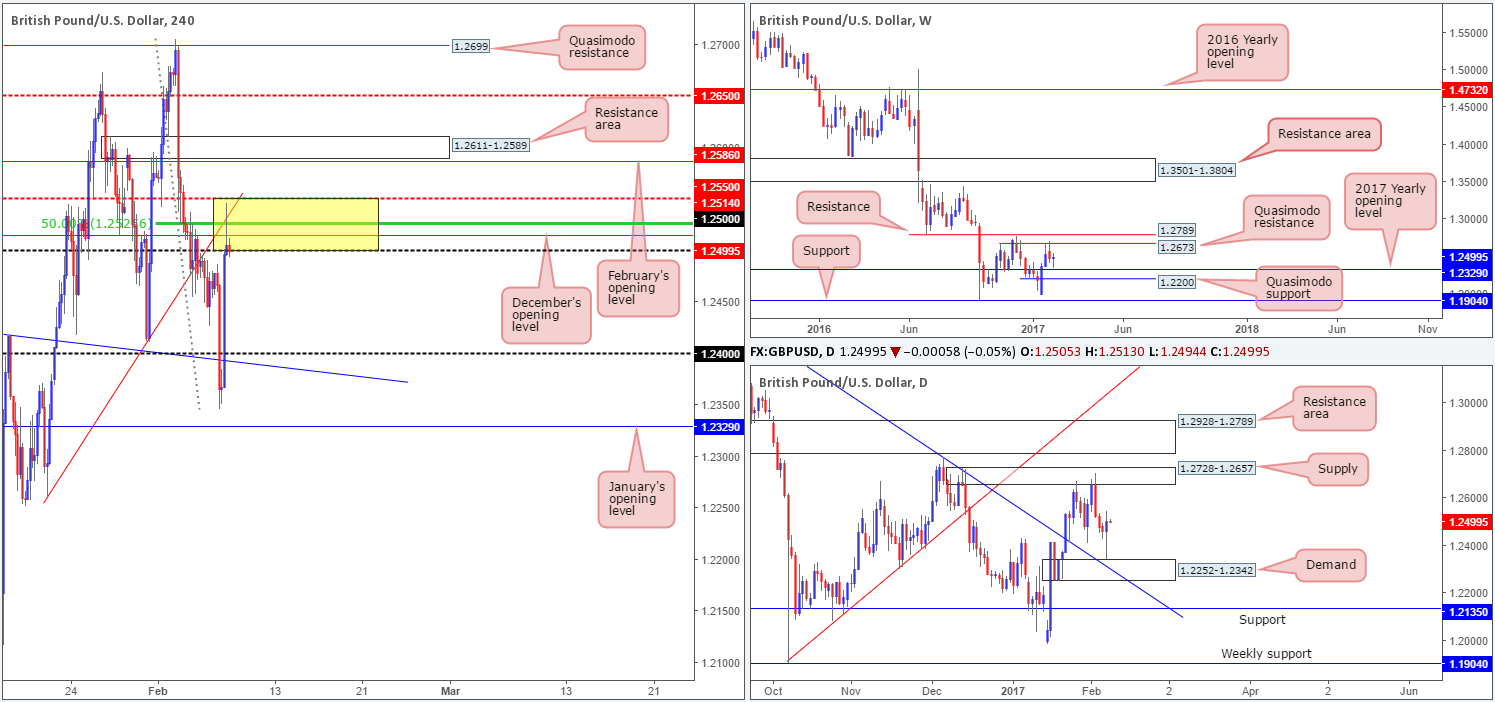
The GBP/USD, as you can see, came under pressure going into the early hours of yesterday’s European session, consequently walloping its way through the 1.24 handle and a H4 trendline support taken from the high 1.2432. However, this downside move was a relatively short-lived one, as the buyers managed to recover from lows of 1.2346 relatively quickly, and aggressively lift prices into positive territory by the closing bell.
In addition to the above, we can also see that daily price came within an inch of clipping the top edge of a daily demand area at 1.2252-1.2342, along with weekly action just missing the 2017 yearly opening level at 1.2329, before advancing north.
Our suggestions: As we write, the H4 candles are seen interacting with a rather interesting H4 area of resistance. Comprised of a psychological number at 1.25, December’s opening base at 1.2514, a H4 50% retracement at 1.2525, a H4 trendline resistance drawn from the low 1.2260 and a H4 mid-way resistance level at 1.2550 (yellow zone), this area could possibly halt buying today. Granted, there is little higher-timeframe convergence seen here, but given the H4 confluence in play, a short from this zone could be considered. Still, we would recommend waiting for a H4 close beyond 1.25 before initiating a sell, since beyond this number there’s very little standing in the way of price challenging the 1.24 vicinity.
Data points to consider: MPC member Cunliffe speaks today at 1pm GMT.
Levels to watch/live orders:
- Buys: Flat (stop loss: N/A).
- Sells: 1.2550/1.25 ([wait for a H4 close to be seen beyond 1.25 followed up with a retest to the underside of this number, before pulling the trigger] stop loss: ideally beyond the trigger candle).
AUD/USD:
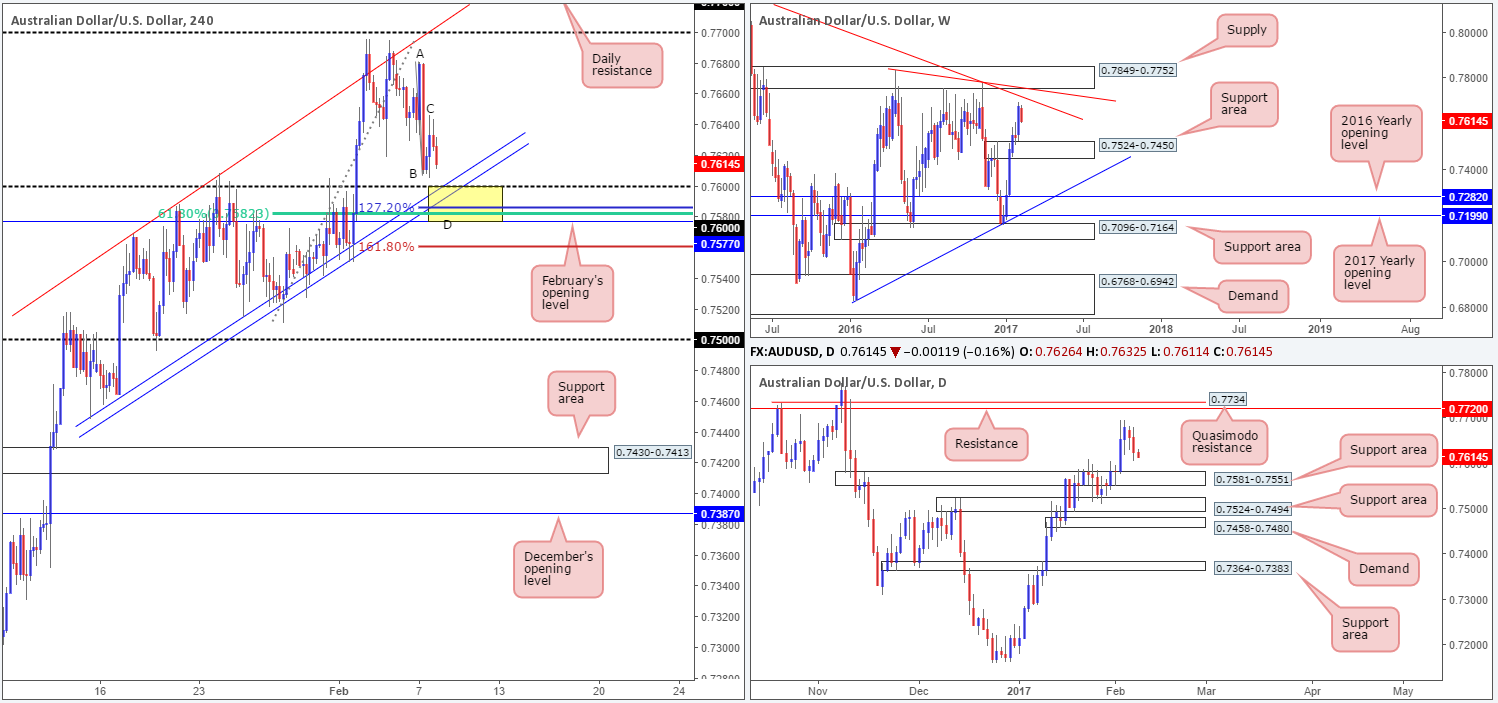
With the US dollar advancing across the board yesterday the AUD/USD tumbled lower, bottoming just ahead of the 0.76 psychological barrier. In view of this, we’re currently drawn to the 0.7577/0.76 H4 support area today. Supporting a bounce from this zone we have the following converging structures:
- A H4 AB=CD 127.2% ext. at 0.7586.
- A H4 61.8% Fib support at 0.7582.
- February’s opening level at 0.7577.
- Round number 0.76.
- We also have the top edge of a daily support area at 0.7581 bolstering the above noted H4 support zone.
Our suggestions: Based on the above confluence, we feel a long from the 0.7586 mark is feasible. To be on the safe side, stops may want to be placed beyond the H4 161.8% ext. at 0.7560 (0.7558).
Data points to consider: There are no scheduled high-impacting news events on the docket today relating to these two markets.
Levels to watch/live orders:
- Buys: 0.7577/0.76 ([an area that can, dependent on the time of day, possibly be traded without additional confirmation] stop loss: 0.7558).
- Sells: Flat (stop loss: N/A).
USD/JPY:
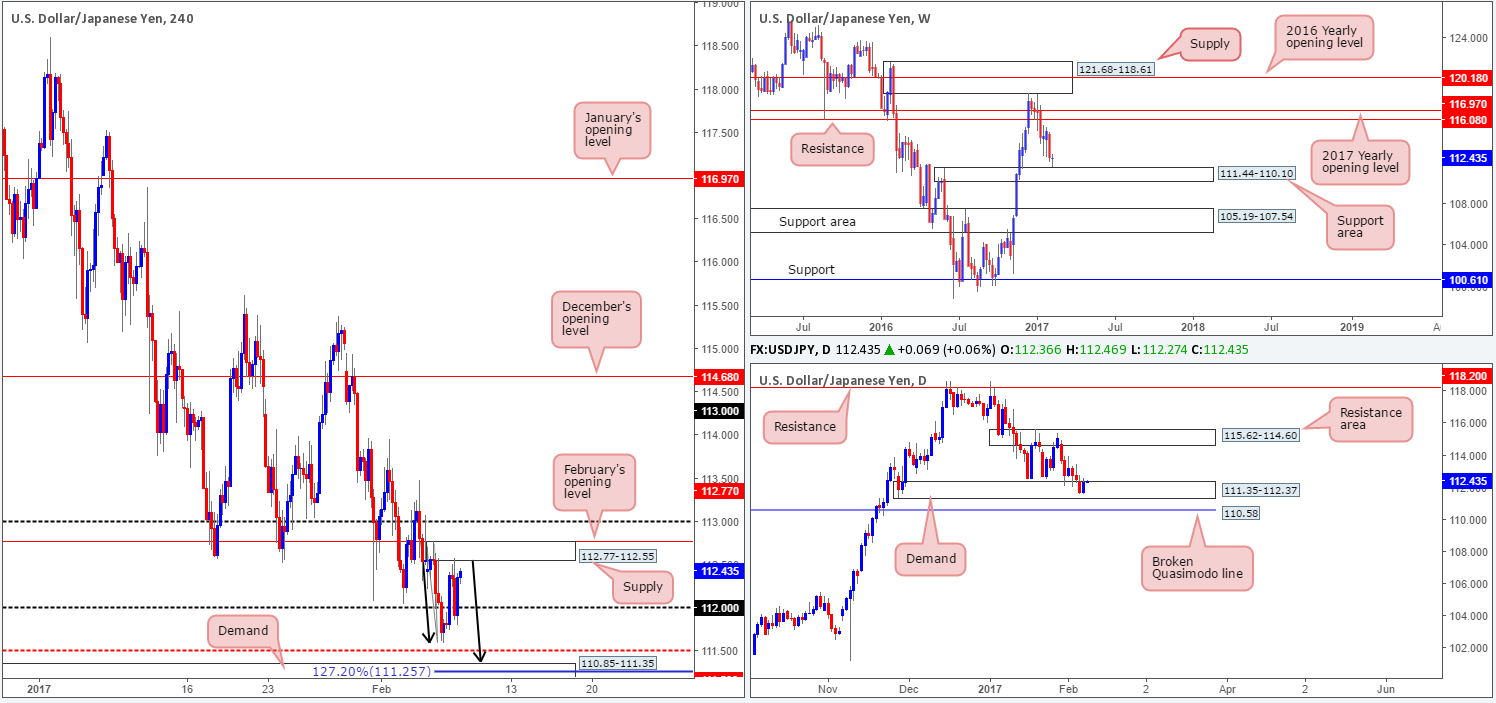
Starting from the top this morning, weekly action recently bottomed just ahead of a weekly support area registered at 111.44-110.10. To our way of seeing things, this could have something to do with the fact that a daily demand at 111.35-112.37 is also currently in play at the moment. Of particular interest here are Monday and Tuesday’s daily candles, as combined they resemble a strong buying tail!
Looking over to the H4 chart, we can see that yesterday’s advance brought the unit up to a H4 supply coming in at 112.77-112.55, which did in fact hold firm. Should this area continue to remain in motion, we may see the H4 candles complete the D-leg of an AB=CD bull pattern, terminating just ahead of a H4 demand area seen at 110.85-111.35.
Our suggestions: Should the above come to fruition, we would not be looking to enter long until price connects with the H4 AB=CD 127.2% ext. at 111.25. The safest position for stops, in our opinion, would be beyond the above noted H4 demand. This trade is effectively based on the premise that price will also be teasing the top edge of the aforementioned weekly support area. To avoid the possibility of a fakeout through this H4 demand to the daily broken Quasimodo line at 110.58, waiting for a H4 bull candle to take shape beforehand could help to eliminate this (a slightly different approach to Tuesday’s analysis).
Data points to consider: There are no scheduled high-impacting news events on the docket today relating to these two markets.
Levels to watch/live orders:
- Buys: 111.25 region ([wait for a H4 bull candle to form before looking to execute a trade] stop loss: ideally beyond the trigger candle or below the H4 demand at 110.85-111.35).
- Sells: Flat (stop loss: N/A).
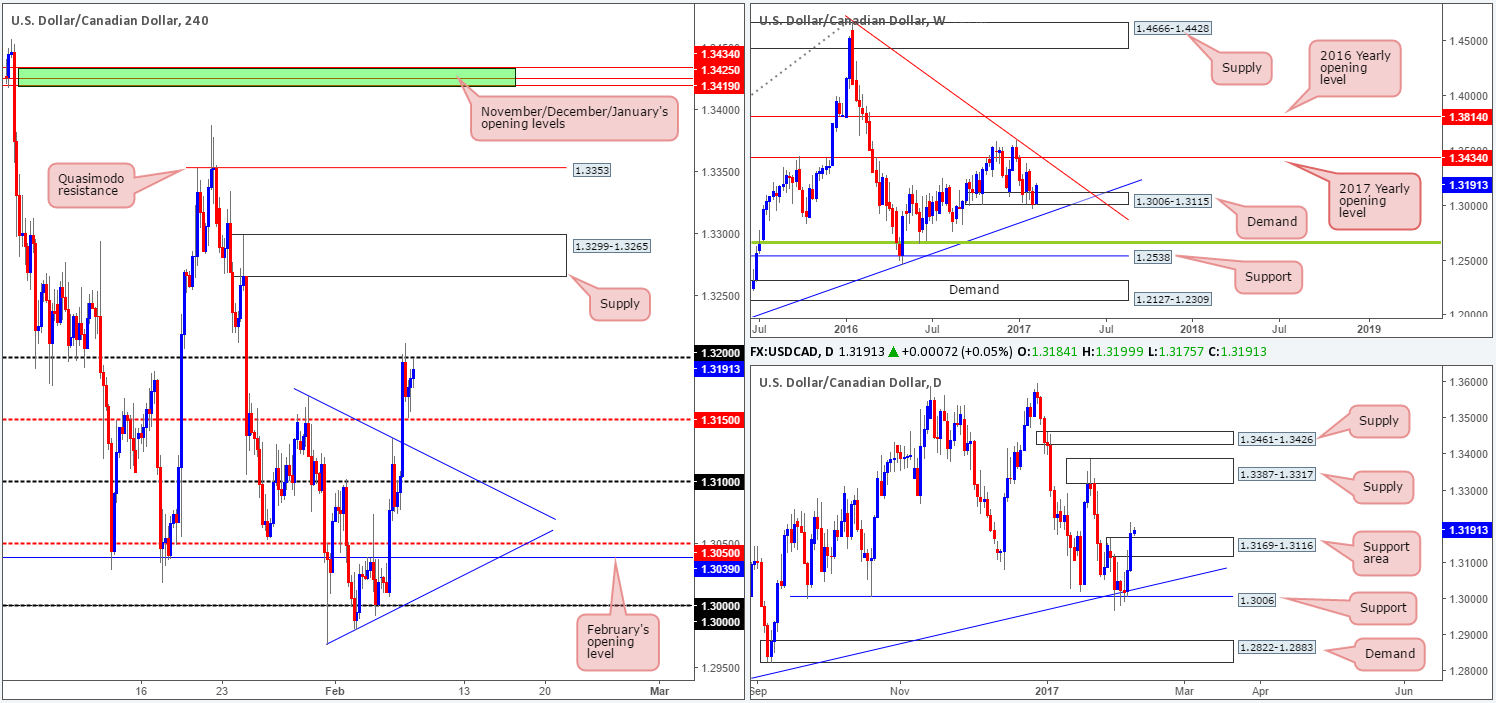
USD/CAD:
From the weekly chart this morning, we can see that the weekly bulls continue to bid price higher from weekly demand at 1.3006-1.3115. This could, assuming the bulls remain in the driving seat here, force price to challenge the weekly trendline resistance taken from the high 1.4689. In conjunction with the weekly chart, the daily candles recently closed above a daily supply area at 1.3169-1.3116 (now acting support area), potentially clearing upside towards a daily supply at 1.3387-1.3317.
In spite of the above notes, to become buyers in this market we would like to see the H4 candles close above the 1.32 handle. Not only would this further confirm the recent break above daily supply, but it would also open up the path north to H4 supply at 1.3299-1.3265.
Our suggestions: Assuming that a H4 close is seen above 1.32 today, this would be our cue to begin watching for price to retest this number as support. Providing that this is followed-up with a lower-timeframe buy signal (see the top of this report for more info on confirming price action), this would be a viable long setup, targeting the aforementioned H4 supply zone.
Data points to consider: Crude oil inventories at 3.30pm GMT.
Levels to watch/live orders:
- Buys: Watch for a H4 close above 1.32 and then look to trade any retest seen thereafter ([waiting for a lower-timeframe buy signal to form following the retest is advised before pulling the trigger] stop loss: dependent on where one confirms this level).
- Sells: Flat (stop loss: N/A).
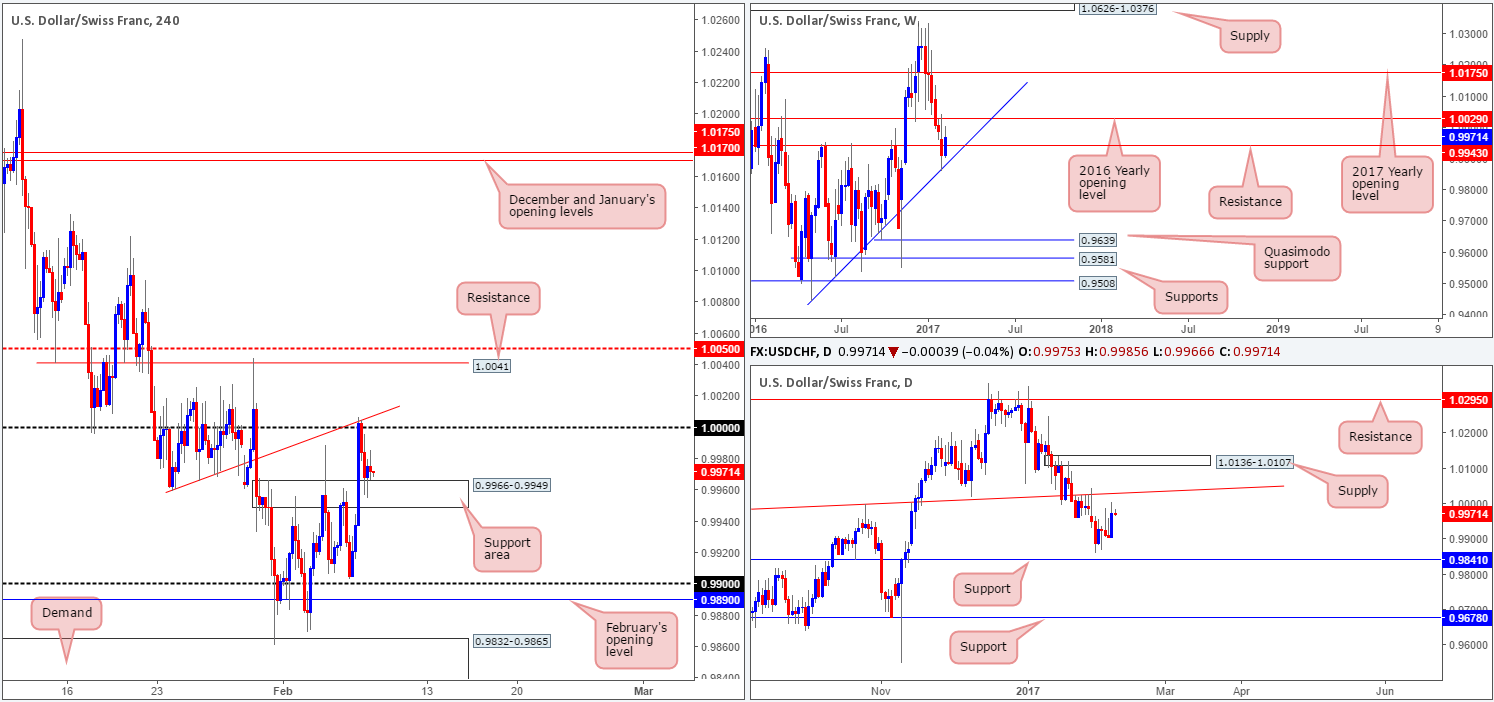
USD/CHF:
The USD/CHF, as you can see, stabilized around parity (1.0000) yesterday, following a wave of buying from just ahead of the 0.99 handle. With parity being a closely watched juncture in this market, as well as being reinforced with a H4 trendline resistance taken from the low 0.9960, it was no surprise to see price had reacted so well from this neighborhood. However, as we write, price seems to be stalling around a nearby H4 support area coming in at 0.9966-0.9949.
With the daily candles potentially on course to retest the underside of a daily trendline resistance drawn from the high 0.9956 right now, and weekly price reflecting a bullish stance beyond weekly resistance at 0.9943, we feel the current H4 support area has a better than fair chance of holding ground today. Based on this, do we believe that the H4 zone is stable enough to permit a long entry? Probably not, in our opinion. The reason is that from the top edge of this zone up to parity gives one only 30 or so pips to play with. Does this mean that a trade from the H4 support zone will not work? Absolutely not. If one is able to pin down a lower-timeframe buy signal from here (see the top of this report) that allows a trade with a relatively small stop loss, the risk/reward could still be favorable up to 1.0000.
Our suggestions: For us personally, we will remain flat going into today’s segment and look to reassess around tomorrow’s open.
Data points to consider: There are no scheduled high-impacting news events on the docket today relating to these two markets.
Levels to watch/live orders:
- Buys: Flat (stop loss: N/A).
- Sells: Flat (stop loss: N/A).
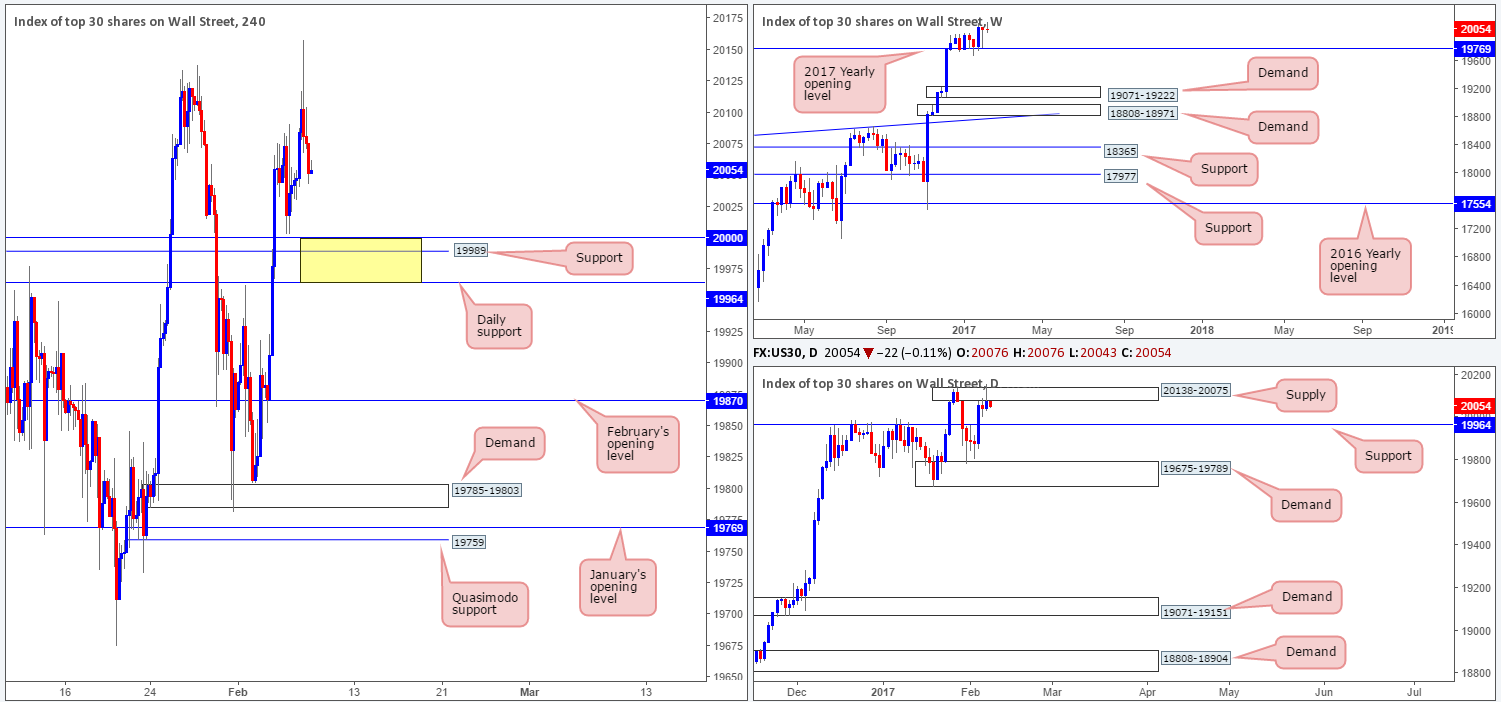
DOW 30:
US equities trimmed an earlier advance on Tuesday, after price spiked through a daily supply area at 20138-20075. Although yesterday’s move recorded fresh all-time highs, we would not be confident (at least in the medium term) buyers until the said daily supply is consumed.
In light of the recent selloff, the H4 candles show little standing in the way of a move lower to 20000. Now, given that 20000 is bolstered by both a H4 support at 19989 and a daily support at 19964, this area could be somewhere to expect price to bounce from, or even potentially reverse.
Our suggestions: Before our team looks to commit to any long positions from the 19964/20000 region, however, we would need to see at least a H4 bull candle take shape within the walls of this area. Although this would not guarantee a winning trade, what it does do is signal buyer interest within a high-probability reversal zone.
Data points to consider: There are no scheduled high-impacting news events on the docket today that will likely affect the US equity market.
Levels to watch/live orders:
- Buys: 19964/20000 ([wait for a H4 bull candle to form before looking to execute a trade] stop loss: ideally beyond the trigger candle).
- Sells: Flat (stop loss: N/A).
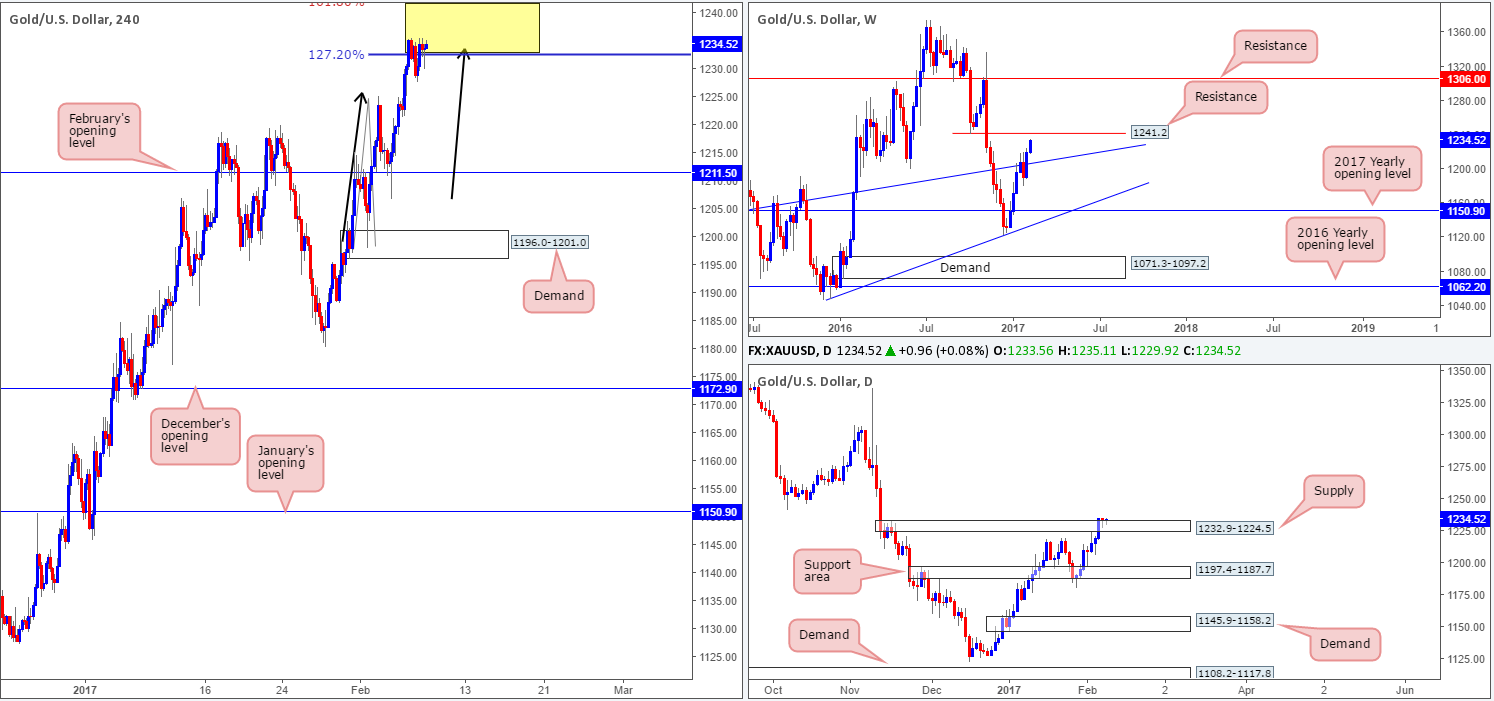
GOLD:
Gold prices are little changed this morning. The H4 candles continue to emphasize overbought conditions, in our opinion, as price remains trading within a H4 AB=CD (see black arrows) sell zone comprised of both the 127.2%/161.8% Fib extensions (yellow area – 1232.9/1241.7). As highlighted in Tuesday’s report, this area is also supported by the fact that the top edge is strengthened by a weekly resistance level pegged at 1241.2. As such, there may be trouble ahead for traders who bought into the breakout above daily supply at 1232.9-1224.5!
Our suggestions: On the account that there’s been very little change to structure in this market, we continue to wait and see if bullion can stretch a little higher into the above noted H4 sell zone, before looking to short. Ideally, the closer the better to the weekly resistance at 1241.2! In addition to this, our trigger to sell will be based on whether or not a reasonably sized H4 bear candle forms. Granted, this will by no means guarantee a winning trade, but what it will do is show seller interest within a high-probability reversal zone.
Levels to watch/live orders:
- Buys: Flat (stop loss: N/A).
- Sells: 1241.7/1232.9 ([wait for a H4 bear candle to form within the upper limit of this zone before looking to execute a trade] stop loss: ideally beyond the trigger candle).


