
EUR/USD:
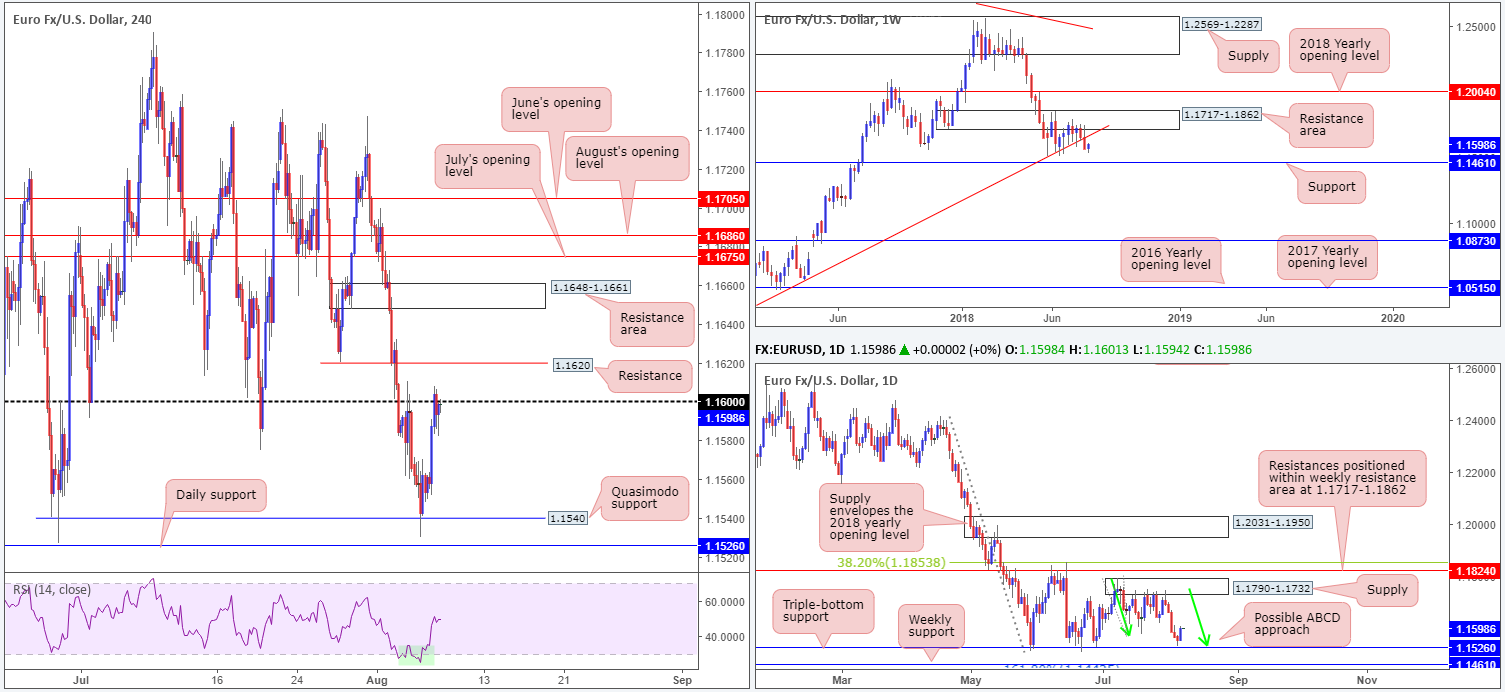
Breaking a five-day bearish phase, the single currency kept itself on the winning side of the table on Tuesday on the back of a weaker USD. H4 Quasimodo support at 1.1540, as you can see, held form, providing a platform for buyers to eventually gravitate towards the 1.16 handle. Above this number, H4 resistance waits at 1.1620, followed closely by a H4 resistance area plotted at 1.1648-1.1661.Given we pushed above 1.16 by 8 or so pips amid US trade yesterday, sellers’ stop-loss orders around 1.16 are likely filled, therefore, the expectation is for an intraday pop up to at least 1.1620 on the H4.
In terms of the higher timeframes, weekly action appears poised to retest the underside of a trend line support-turned resistance (taken from the low 1.0340). Daily movement, on the other hand, could push as far north as supply at 1.1790-1.1732. Note on this scale, price recently came within 5 pips of testing a triple-bottom support at 1.1526.
Areas of consideration:
Unfortunately, we see limited high-probability reversal points in this market right now, i.e. no setups with higher-timeframe convergence.
Intraday levels to keep eyeballs on for a bounce, however, are: the 1.16 handle, the H4 resistance at 1.1620 and the H4 resistance area at 1.1648-1.1661.
Today’s data points: FOMC member Barkin speaks.
GBP/USD:
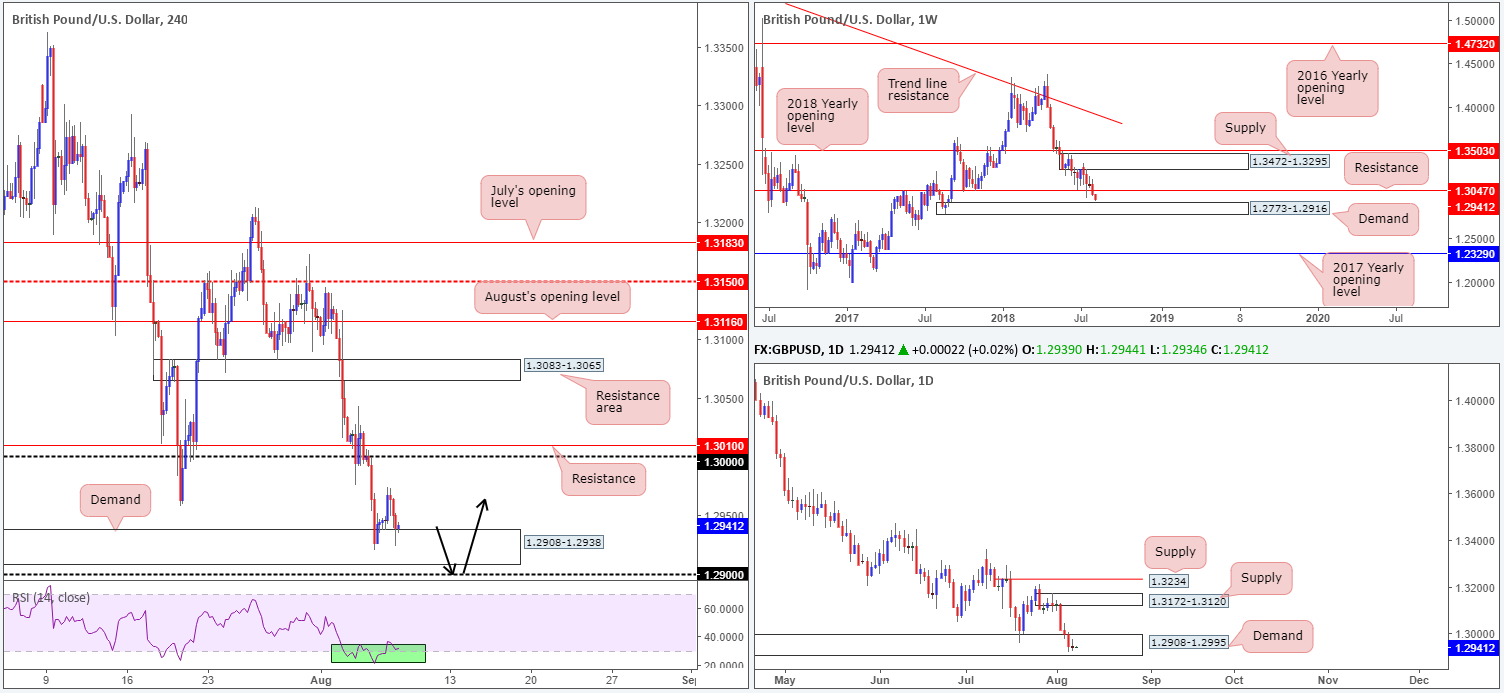
Sterling, once again undermined by more Brexit-related woes, failed to sustain gains beyond session highs at 1.2973 chalked up during early Europe on Tuesday. Despite broad USD weakness, the pound concluded the day pretty much unchanged, forming a daily indecision candle (albeit with a slight bearish echo to it).
While the political situation in the UK remains a sore point, technical structure in this market shows collective demand in view. H4 demand coming in at 1.2908-1.2938 (also see the RSI indicator on this timeframe is testing oversold waters) continues to hold its top edge, in spite of the failed attempt to drive higher yesterday. Although formed all the way back in early September of 2017, this H4 area boasts strong momentum from its base, thus indicating possible strength.
What’s also interesting is the H4 zone is seen positioned within the lower limits of a daily demand base coming in at 1.2908-1.2995, which also happens to be bolstered by the top edge of a weekly demand area drawn from 1.2773-1.2916.
Areas of consideration:
In similar fashion to Tuesday’s report, we’re sure you’ll agree this market is a troubled one. While we do have muscular demand in the fight, there’s a reluctance from the buyers to commit at the moment. For that reason, traders might want to wait and see if weekly price can shake hands with demand mentioned above at 1.2773-1.2916 (essentially the lower limits of the current H4 demand) before contemplating longs. In fact, a test of the 1.29 handle may be the place to watch today. A rebound from this angle is attractive, not only because weekly buyers are then likely in the fold, but also due to stop-loss orders (liquidity) taken from the lower edge of the H4 and daily demand (1.2908) for larger traders to buy into. To take advantage of a buy from 1.16, consider waiting for a H4 bullish candlestick formation to present itself. This will help avoid being taken on any fakeout seen below 1.16, and also provide a location for stop-loss orders.
Today’s data points: FOMC member Barkin speaks.
AUD/USD:
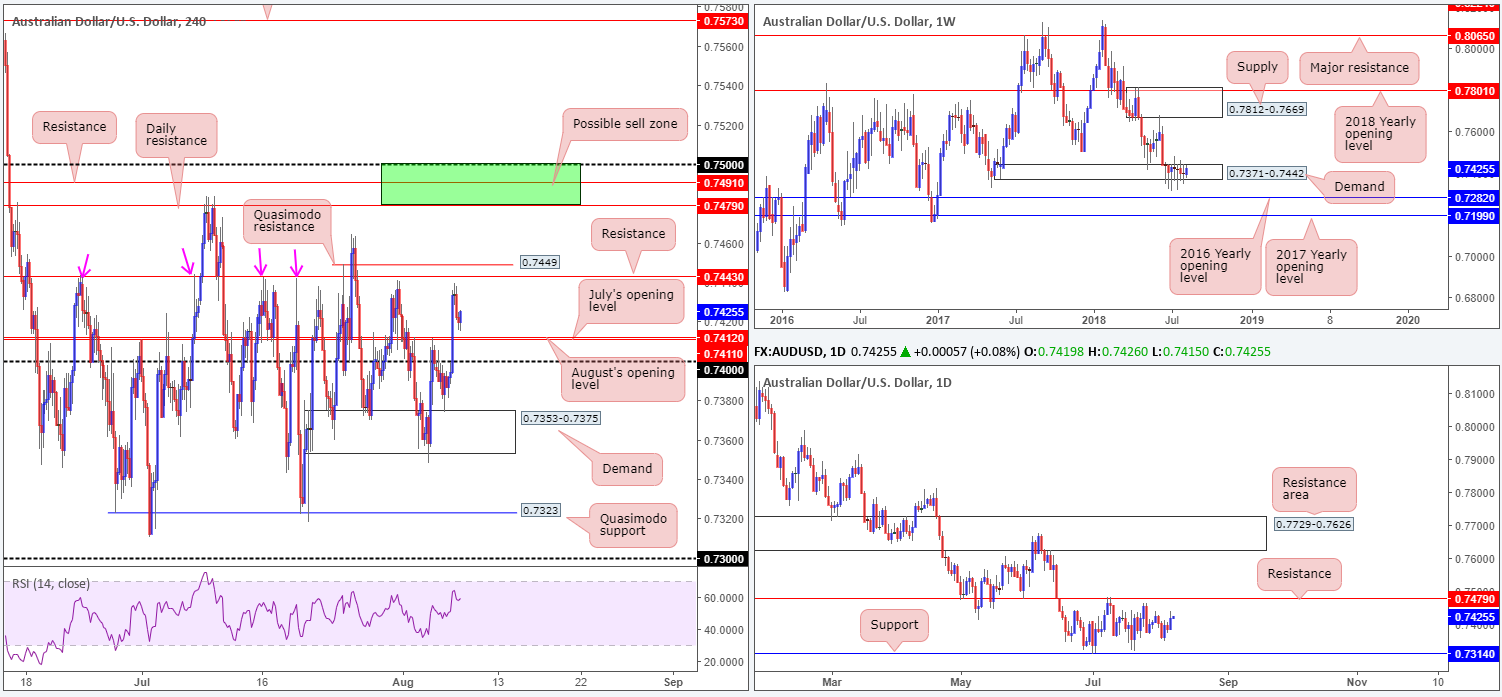
The Reserve Bank of Australia (RBA) celebrated its second anniversary of no policy changes on Tuesday, suggesting on hold beyond the current 2-year hiatus. Amid early European hours on Tuesday, nevertheless, the commodity currency found strong support, breaking through the 0.74 handle and July/August’s opening levels at 0.7412/11 on the H4 timeframe.
As you can see, H4 structure remains restricted right now. Between 0.7412 and 0.7443 (a H4 resistance), one has less than 30 pips to play with, whereas a push back beneath the 0.74 handle, sellers have the top edge of H4 demand to target at 0.7375 – even less room! A break through 0.7443 and nearby H4 Quasimodo resistance at 0.7449, nonetheless, likely opens the path to 0.75/0.7479: a H4 sell zone marked in green comprised of a round number, a H4 resistance and daily resistance.
In terms of weekly price action, little has changed over the past month and a half. Demand at 0.7371-0.7442 remains in a fragile state, opening the window to a possible test of the 2016 yearly opening level at 0.7282 sometime down the road. In the event the bulls regain consciousness, however, a retest of supply at 0.7812-0.7669 may eventually be on the cards. The reason behind the lack of movement on the weekly timeframe, technically that is, likely has something to do with the fact daily flow continues to respect its current range. Since early July, the Aussie has fluctuated between support drawn from 0.7314 and resistance chalked up at 0.7479.
Areas of consideration:
The only area of interest that jumps out at us this morning is the H4 sell zone mentioned above at 0.75/0.7479. Already holding price lower once in early July, this area has a healthy chance of holding should it be tested. As the approach has yet to complete it’s difficult to pin down any firm take-profit targets. In regards to stop-loss orders, nevertheless, traders are urged to wait for H4 price to print something of note (a full or near-full-bodied H4 bear candle) from within the zone (tuck stops above the candle’s rejection wick), since there’s a chance the market may witness a fakeout above 0.75 (common viewing around psychological boundaries).
Today’s data points: RBA Gov. Lowe speaks; CNY trade balance; FOMC member Barkin speaks.
USD/JPY:
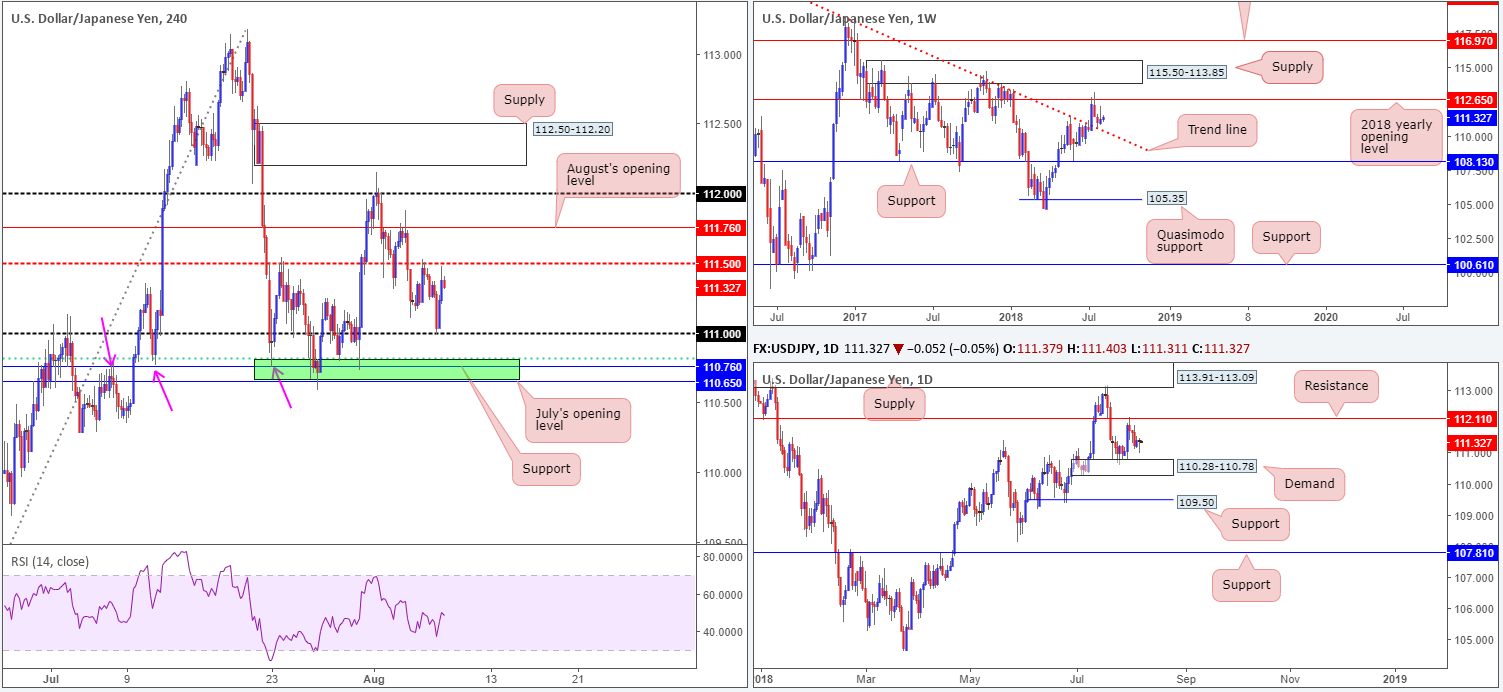
The market witnessed broad USD selling amid European trade on Tuesday, consequently dragging the USD/JPY towards the 111 handle on the H4 timeframe. As is evident from the chart, 111 responded aggressively, providing a platform for buyers to enter the fold during the US session. On the whole, the market remains unchanged, though, as H4 price hovers just south of the mid-level resistance at 111.50.
Although 111 held in strong form yesterday, the green H4 area marked below it at 110.65/110 is still a base to keep eyes on for possible longs. Why we like this area comes down to its following construction:
- July’s opening level at 110.65.
- H4 support at 110.76.
- 61.8% H4 Fib support at 110.81.
- Stop-loss orders below 111 will likely provide bigger players the liquidity needed to buy.
Also bear in mind the top edge of daily demand at 110.28-110.78 converges with 110.65/110.81, along with the current weekly trend line resistance-turned support (taken from the high 123.57) intersecting with the lower edge of the daily zone.
Areas of consideration:
On account of the above, 110.65/110.81 remains an area of interest for possible buy trades today/this week (conservative stops can be placed around the 110.57 neighborhood). A H4 close back above 111 from this area would, in our view, be a solid cue to begin thinking of reducing risk to breakeven and taking partial profits off the table.
Today’s data points: FOMC member Barkin speaks.
USD/CAD:
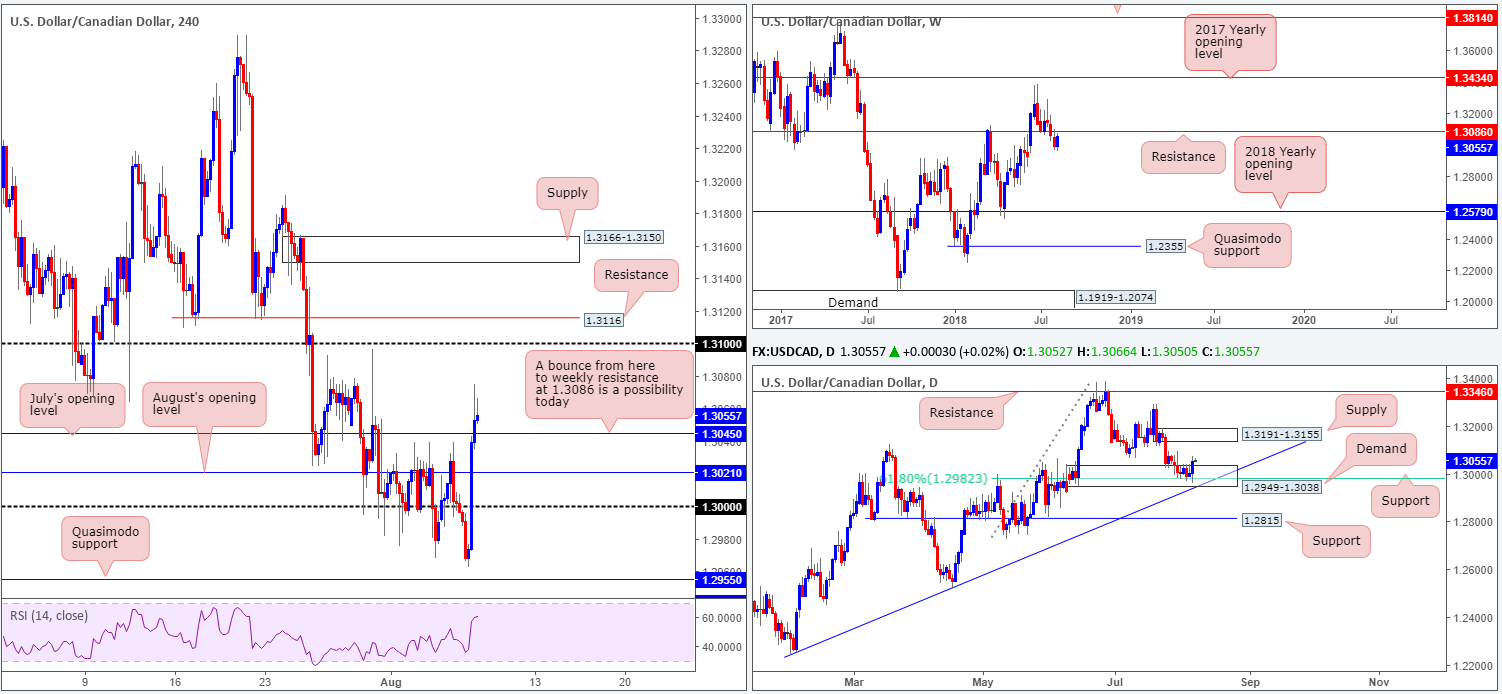
Boosted by a lower-than-expected Canadian Ivey PMI on Tuesday, the USD/CAD crunched its way above key resistance at 1.30 in one fell swoop (see M30 for a clearer view). Further buying was observed in US hours, removing August’s opening level at 1.3021 and shortly after July’s opening level as well at 1.3045 (H4). Recent moves potentially cleared the pathway north for further buying on the H4 scale, with the 1.31 handle likely being the next base in the firing range.
According to daily structure, an upside move was to be expected. Daily price had been toying with demand at 1.2949-1.3038 for some time, which housed a 61.8% Fib support value at 1.2982 and intersected with nearby trend line support (etched from the low 1.2247). The next upside target from the current demand area falls in around supply fixed at 1.3191-1.3155. While both H4 and daily structure imply further buying could be on the cards, the weekly timeframe is unfortunately seen closing in on resistance drawn from 1.3086.
Areas of consideration:
Traders looking for a bounce off July’s opening level mentioned above on the H4 timeframe at 1.3045 today, targeting the 1.31 neighborhood, need to remain cognizant of where we’re coming from and possibly heading to on the bigger picture.
A long from 1.3045 has 1.3086 (weekly resistance) to target as its initial port of call. That’s a 40-pip move. Therefore, there is scope for possible intraday buying off this number, as long as one is able to pin down a setup with a relatively tight stop in order to keep risk/reward in perspective.
Today’s data points: FOMC member Barkin speaks; Crude oil inventories.
USD/CHF:
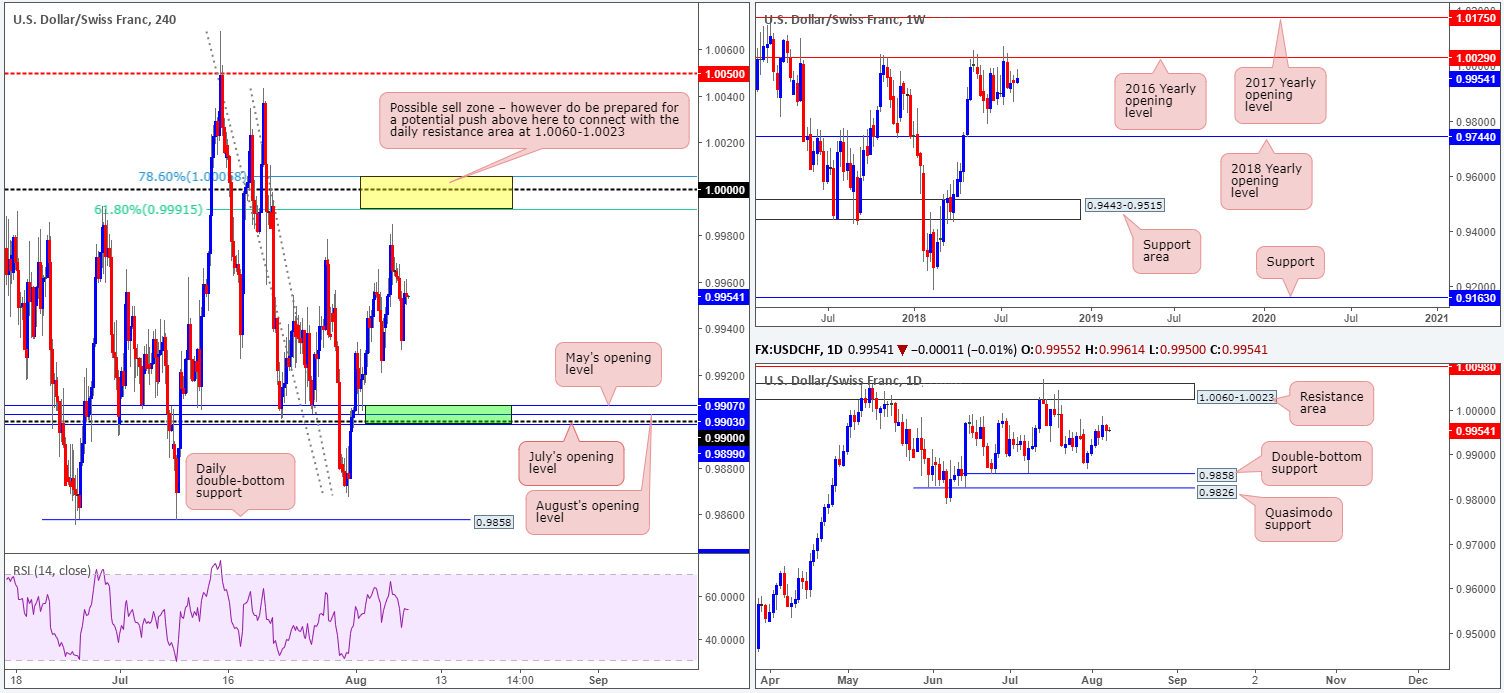
A light macroeconomic calendar on Tuesday kept investors sidelined, resulting in a lackluster USD/CHF performance. With that being the case, much of the following report will echo thoughts aired in yesterday’s analysis…
Parity (1.0000) remains a number to watch on the H4 timeframe, as it’s surrounded by two Fibonacci ratios: 78.6% at 1.0005 and 61.8% at 0.9991 (yellow zone). Another area that remains ‘stand out’ on the H4 timeframe can be seen in green at 0.9899/0.9907 (comprised of July’s opening level at 0.9899, the 0.99 handle, August’s opening level at 0.9903 and May’s opening level at 0.9907).
Turning our attention to the higher timeframes, weekly price continues to trade beneath key resistance at 1.0029: the 2016 yearly opening level. Holding price lower on two occasions in 2017, and twice already in 2018, this level commands attention! The story on the daily scale shows price action consolidating ahead of 1.0060-1.0023: a resistance area that encapsulates the 2016 yearly opening level mentioned above on the weekly timeframe at 1.0029.
Areas of consideration:
On the whole, our attention remains fixed on 1.0000 this morning. Before considering a short from this region, nonetheless, traders are urged to wait for additional H4 candle confirmation, preferably a full or near-full-bodied bearish candle. The reason being is round numbers tend to attract ‘stop runs’ (fakeouts). Additionally, there’s a chance price may ignore 1.0000 and head for the weekly 2016 yearly opening level at 1.0029, which, as we already know, is captured within the walls of a daily resistance area at 1.0060-1.0023.
Today’s data points: FOMC member Barkin speaks.
Dow Jones Industrial Average:
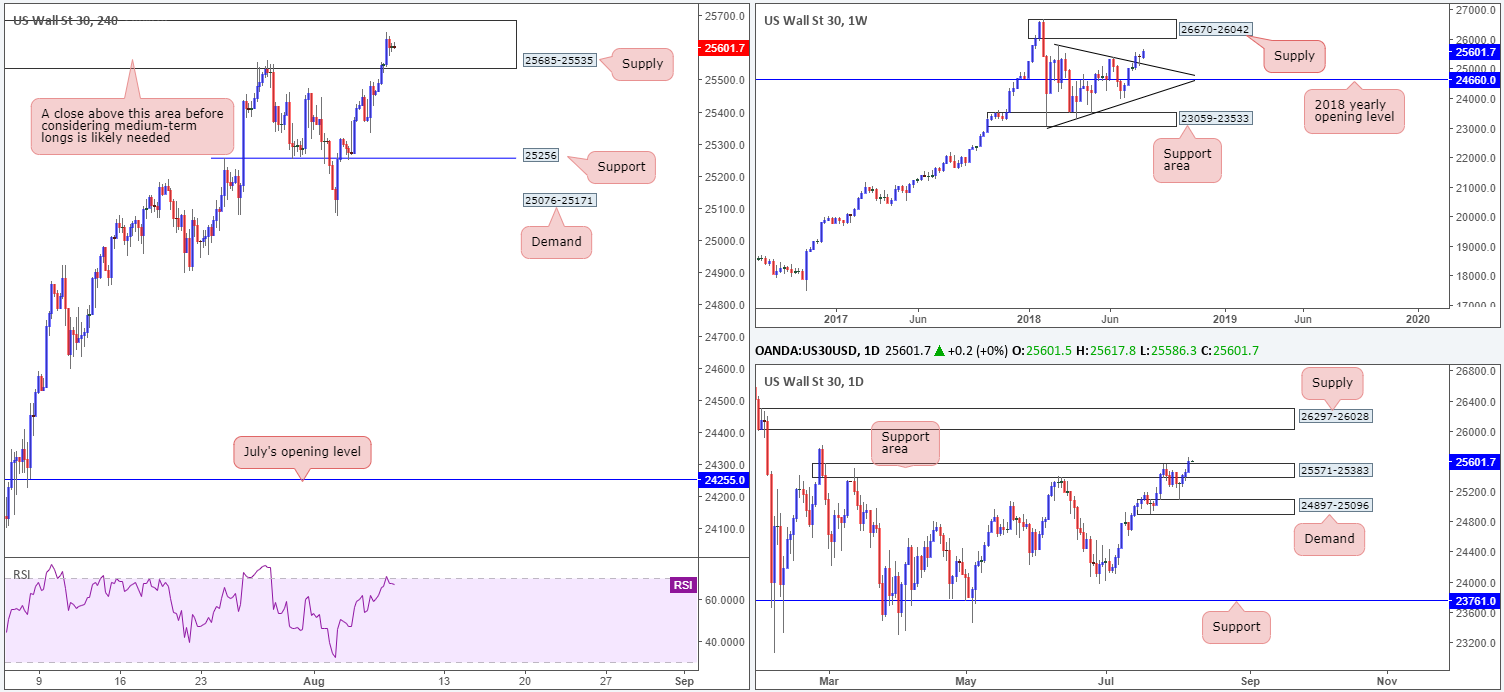
US equities extended gains on Tuesday, punching to highs of 25649. A lack of fresh headlines on trade conflict allowed investors to remain focused on upbeat earnings figures.
As a result of yesterday’s move north the July 27 high at 25559 was engulfed, forcing the H4 candles into supply territory at 25685-25535. While this H4 supply will likely be no ‘walkover’, higher-timeframe structure is pointing to a possible continuation to the upside. Weekly price recently retested trend line resistance-turned support (etched from the high 25807) in the shape of a reasonably nice-looking bullish pin-bar formation. From this point, a run up to supply coming in at 26670-26042 is a possible scenario to keep tabs on this week. Daily supply at 25571-25383, as you can see, was also engulfed on Tuesday (now acting support area), opening up a possible run towards another layer of supply coming in at 26297-26028 (seen within the walls of the aforementioned weekly supply).
Areas of consideration:
With both weekly and daily action indicating additional bullish sentiment, entering short from the current H4 supply is a chancy move, in our humble opinion.
Technically speaking, waiting for H4 price to CLOSE above the current supply zone before considering longs in this market remains a logical route. A retest to the top edge of this zone that holds firm will likely be enough to draw in buyers and bring the unit towards the aforesaid weekly supply, and therefore remains a viable long setup to keep eyes on going forward.
Today’s data points: FOMC member Barkin speaks.
XAU/USD (Gold)
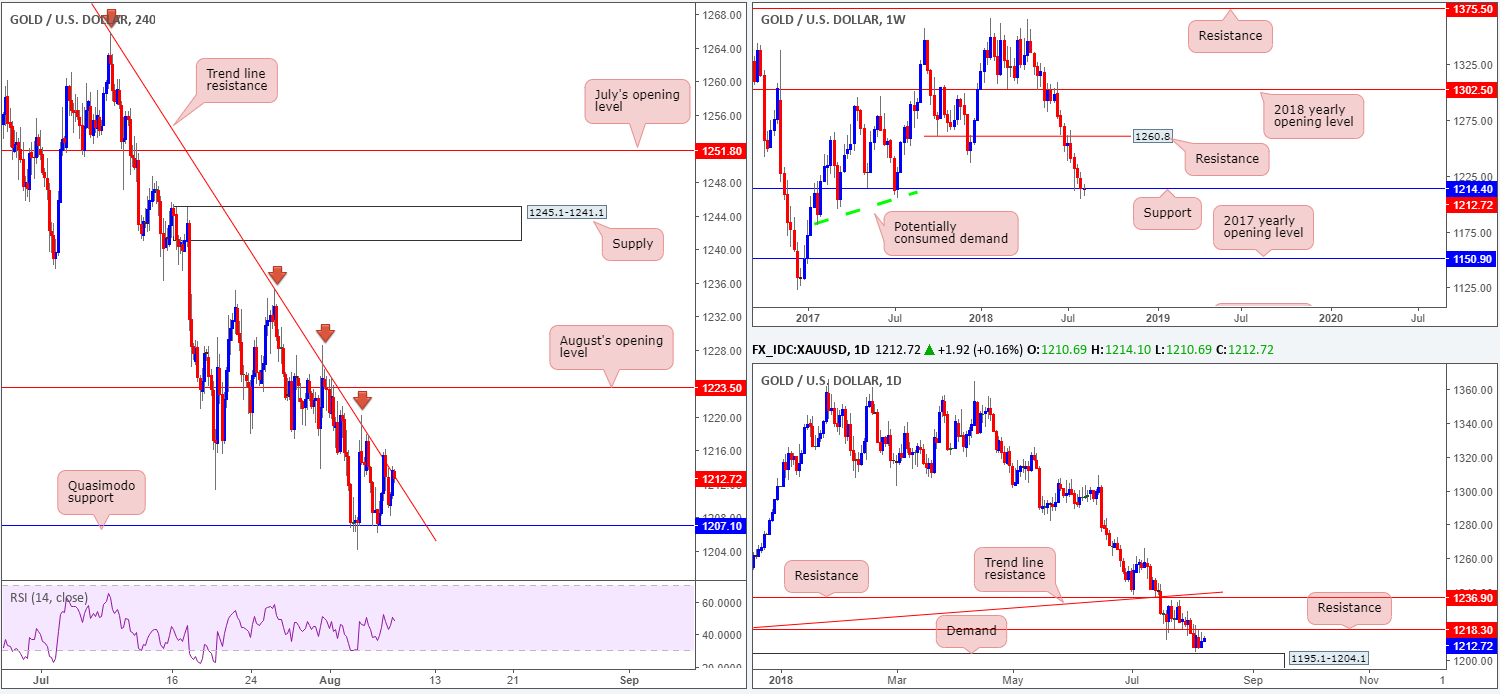
Using a top-down approach this morning, bullion’s weekly support at 1214.4 remains in the fight, despite a number of attempts to push lower. A decisive close beneath here would, in our technical opinion, open up the possibility for further downside as far south as the 2017 yearly opening level at 1150.9. Note there’s limited active demand to the left of current price between these two levels.
Meanwhile, on the daily picture the yellow metal is seen consolidating between resistance drawn from 1218.3 and demand coming in at 1195.1-1204.1. A break of this demand base may call for a move towards 1171.1-1185.0, another layer of demand (not seen on the screen).
In terms of intraday movement, buyers and sellers on the H4 timeframe are seen battling for position between a descending trend line resistance (taken from the high 1265.9 – fuses with the noted daily resistance) and a Quasimodo support at 1207.1. A push higher from here has August’s opening level to target at 1223.5. Bear in mind, though, buyers will have to contend with selling from daily resistance mentioned above at 1218.3 before reaching this far north!
Areas of consideration:
This is a challenging market to trade right now. On the weekly timeframe we have a precarious support in play, while on the H4 and daily timeframes direction is limited by closely positioned barriers. To our way of seeing things, therefore, neither a long nor short seems attractive right now.
The use of the site is agreement that the site is for informational and educational purposes only and does not constitute advice in any form in the furtherance of any trade or trading decisions.
The accuracy, completeness and timeliness of the information contained on this site cannot be guaranteed. IC Markets does not warranty, guarantee or make any representations, or assume any liability with regard to financial results based on the use of the information in the site.
News, views, opinions, recommendations and other information obtained from sources outside of www.icmarkets.com.au, used in this site are believed to be reliable, but we cannot guarantee their accuracy or completeness. All such information is subject to change at any time without notice. IC Markets assumes no responsibility for the content of any linked site. The fact that such links may exist does not indicate approval or endorsement of any material contained on any linked site.
IC Markets is not liable for any harm caused by the transmission, through accessing the services or information on this site, of a computer virus, or other computer code or programming device that might be used to access, delete, damage, disable, disrupt or otherwise impede in any manner, the operation of the site or of any user’s software, hardware, data or property.


