
Key risk events today:
FOMC Meeting Minutes.
(Previous analysis as well as outside sources – italics).
EUR/USD:
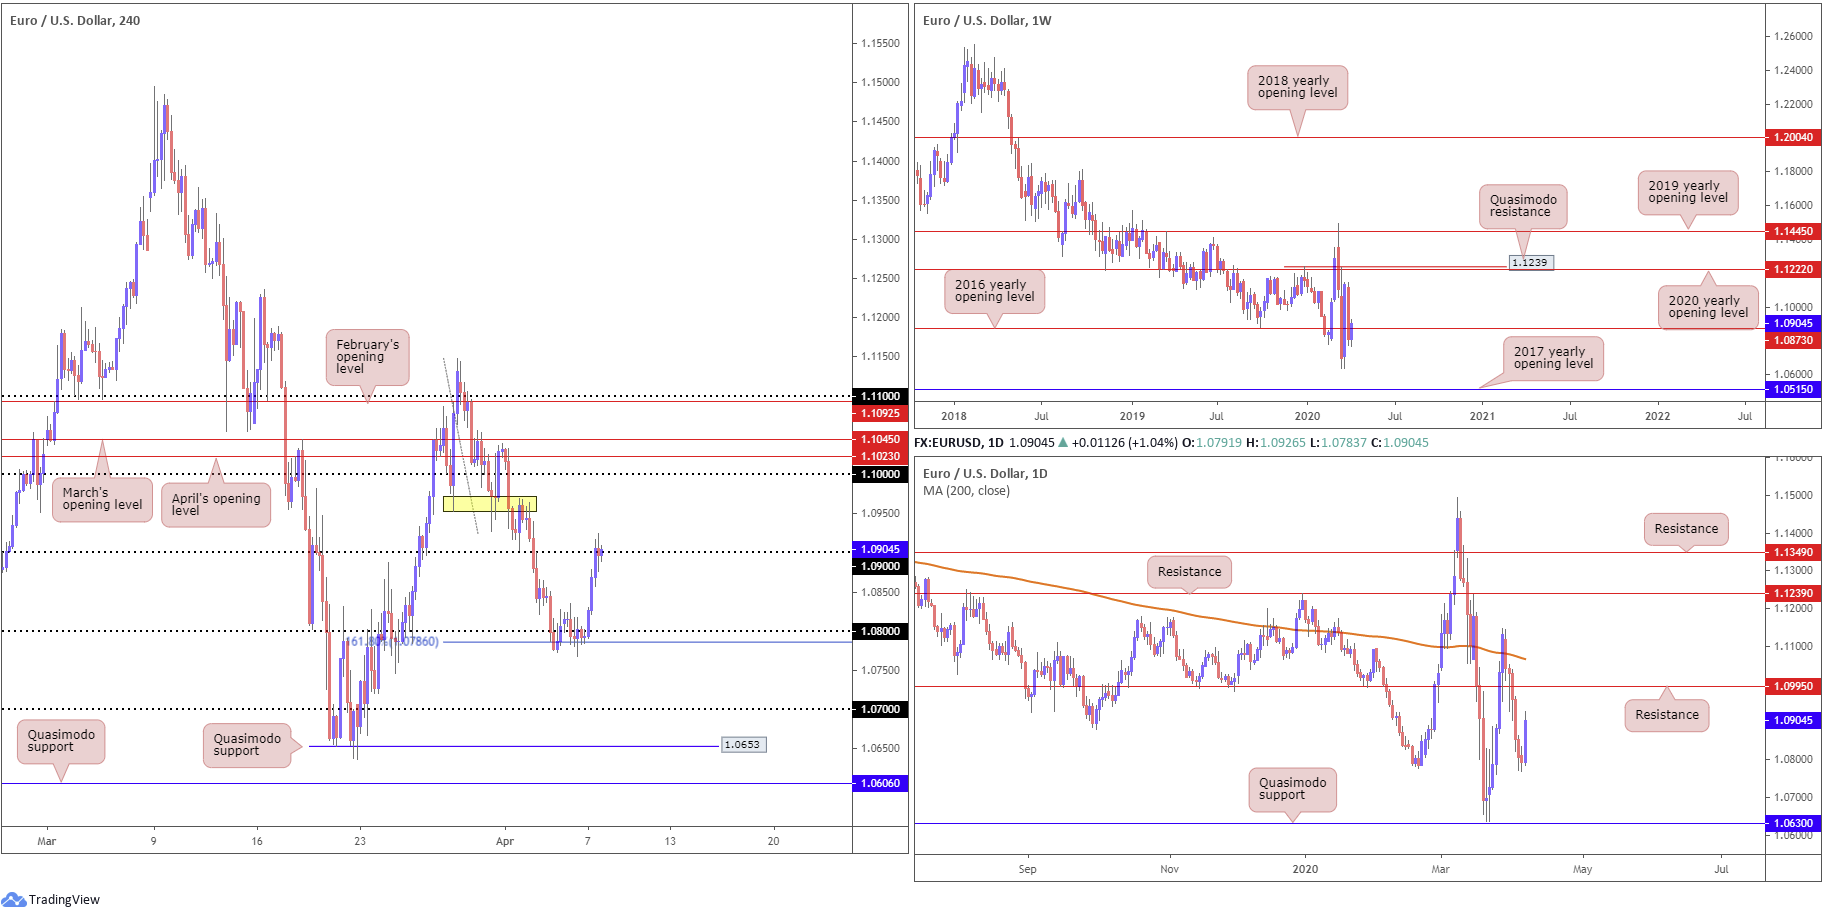
EUR/USD bulls outperformed Tuesday, reclaiming 1.08 status in early trade and shaking hands with 1.09 into US hours. The US dollar index, or DXY, snapped a four-day bullish phase (EUR/USD snapped a six-day bearish run), drawing the US dollar sub 100.00.
North of 1.09, local resistance is present around 1.0950 (yellow), with a break highlighting 1.10 and then April and March’s opening level at 1.1023 and 1.1045, respectively. Note this area is closely connected to daily resistance at 1.0995, followed by the 200-day SMA (orange – 1.1066).
Higher up on the curve, weekly price is attempting to cross above the 2016 yearly opening level at 1.0873. Skies above here are reasonably clear for a run to the 2020 yearly opening level at 1.1222, shadowed by a Quasimodo resistance at 1.1239.
Areas of consideration:
The possibility of further buying materialising above 1.09 is certainly there, with both weekly and daily structure trading in harmony. However, before pulling the trigger, traders will likely seek more of a decisive close north of 1.09, with the majority likely to consider reducing risk to breakeven around the 1.0950ish threshold on the H4.
GBP/USD:
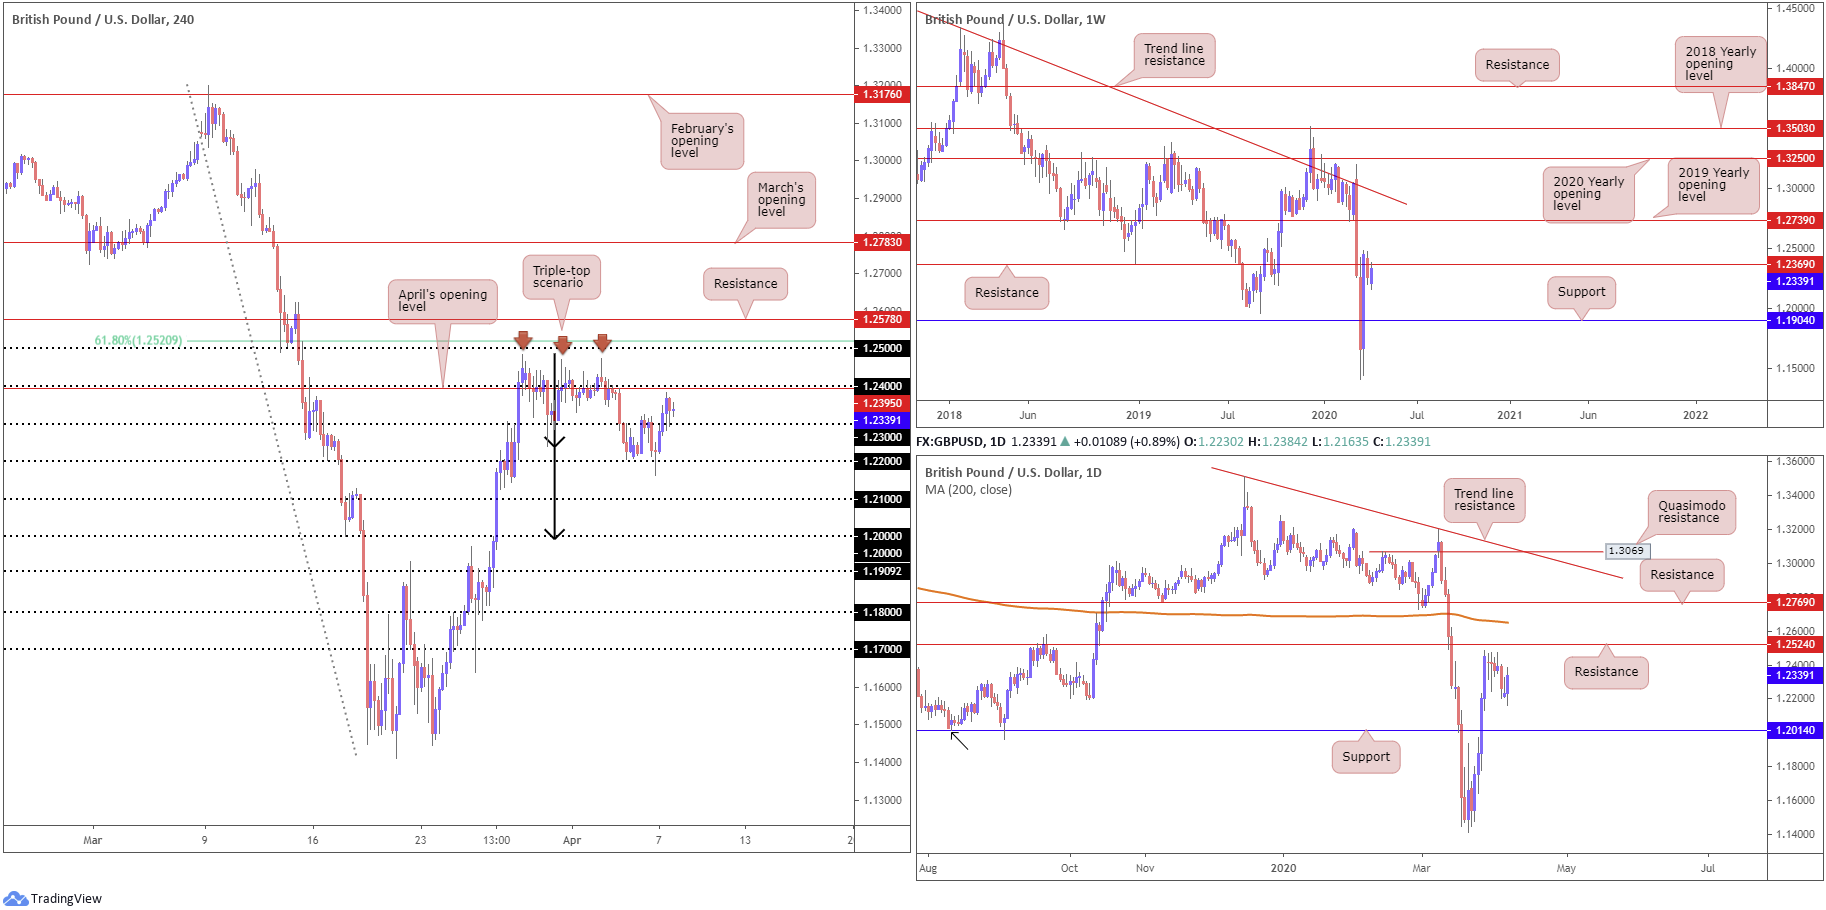
Following the formation of a H4 triple-top pattern around 1.2476ish, sited just beneath the 1.25 handle and a 61.8% Fibonacci retracement at 1.2520, early trade witnessed sterling latch onto a fresh bid Tuesday, involving a 1.23 takeover and retest into the close. Just ahead we have 1.24 circling nearby, which happens to merge closely with April’s opening level at 1.2395.
The break of the lowest trough within the aforementioned triple-top pattern (1.2241) has confirmed the formation as a potential contender for shorts, with a take-profit target (measured by taking the value between the highest peak to the lowest trough and adding this to the breakout point) set around the key figure 1.20 (black arrows).
From the weekly timeframe, longer-term flow has reconnected with resistance at 1.2369, with the possibility of a reversal forming towards support priced in at 1.1904. The next upside target beyond 1.2369, on the other hand, falls in around the 2019 yearly opening level at 1.2739, with a break exposing long-term trend line resistance, taken from the high 1.5930.
The story on the daily timeframe has price action hovering beneath resistance at 1.2524. The 200-day SMA (orange – 1.2650) lurks north of noted resistance, while support resides around the 1.2014 neighbourhood. Note price action also chalked up a bullish outside day yesterday.
Areas of consideration:
Having noted weekly movement garnering resistance from 1.2369 as well as daily price displaying room to stretch lower to support at 1.2014 (despite the outside day setting), the triple-top H4 pattern could still complete, in spite of the recent advance. Note also the said pattern’s take-profit target merges with daily support at 1.2014.
Technically, therefore, traders are still likely to consider either shorts off 1.24, or on a close south of 1.23.
AUD/USD:
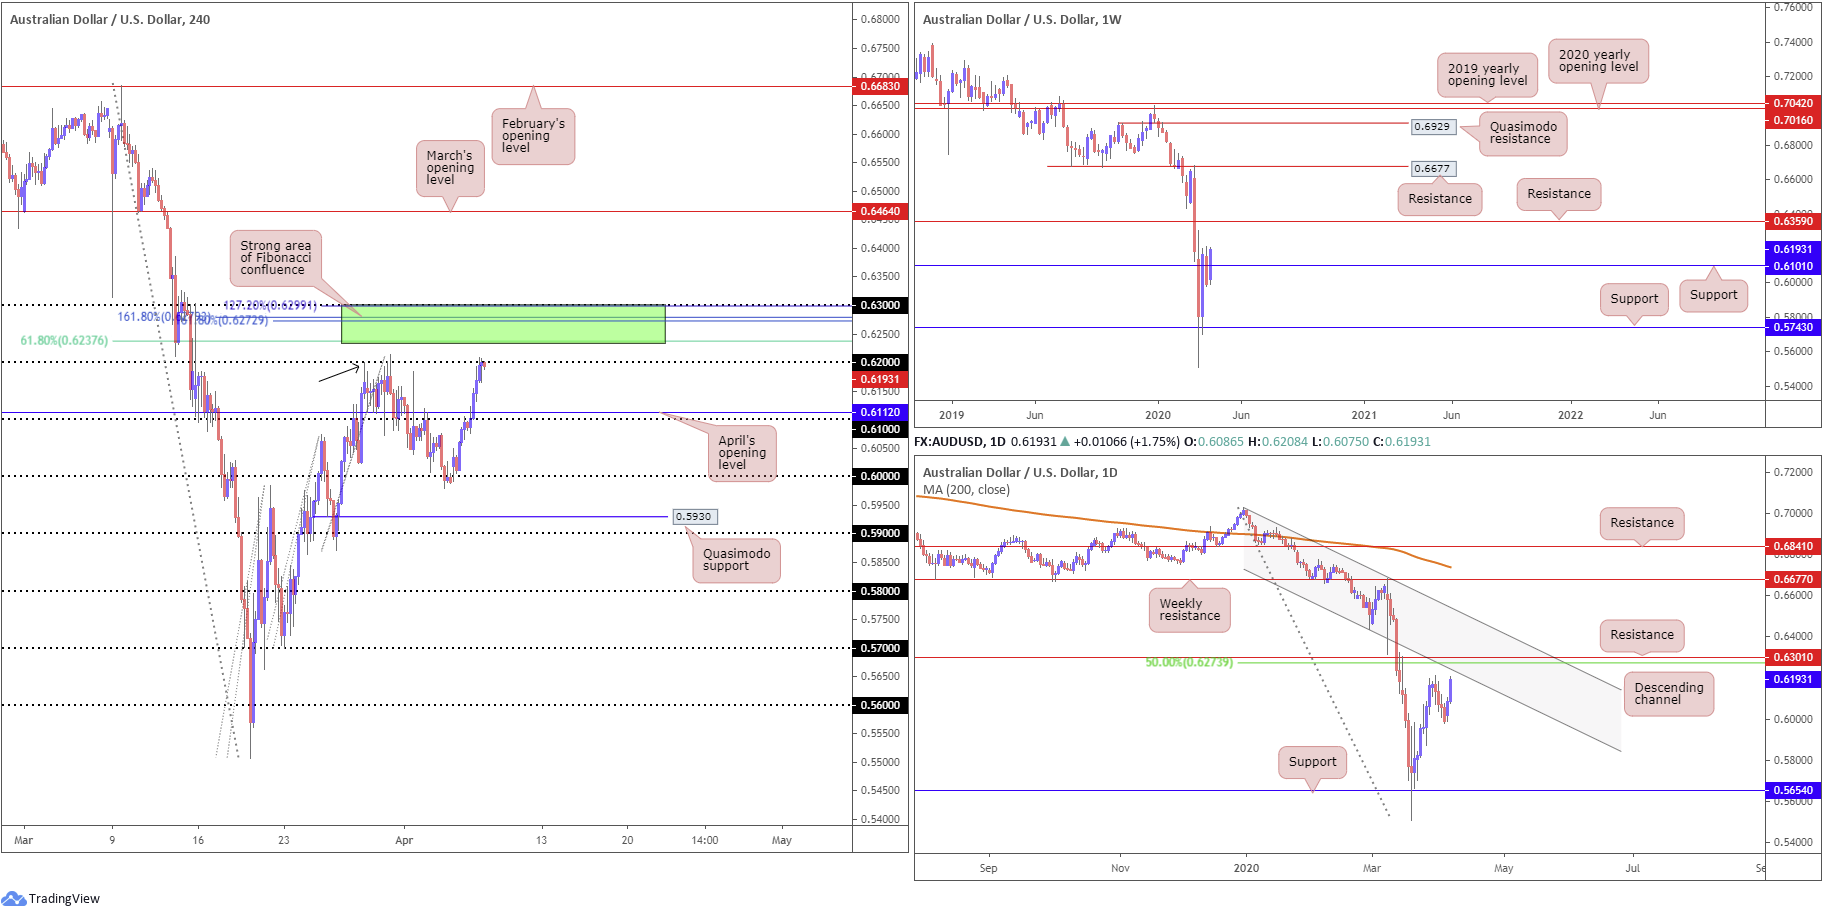
Tuesday had the Reserve Bank of Australia (RBA) stand pat on rates while also noting a global recovery is expected once Covid-19 has been contained. This provided fresh impetus to the Australian dollar, rallying more than 100 points against the buck into the close.
Price action made short work of 0.61 and merging April’s opening level at 0.6112 on the H4 timeframe, leading to a charge towards 0.62, which also represents a Quasimodo resistance (black arrow). Directly above lies an interesting area of Fibonacci studies – typically referred to as a Fibonacci cluster. 0.63/0.6237 is comprised of the 0.63 handle, two 161.8% Fibonacci extension points at 0.6272 and 0.6279, a 61.8% Fibonacci resistance point at 0.6237 and a 127.2% Fibonacci extension point at 0.6299.
Further afield, weekly movement recently crossed above resistance at 0.6101 (now labelled support), with price action threatening moves to resistance coming in at 0.6359. A closer examination of price action on the daily timeframe has resistance nearing in the form of a channel support-turned resistance, extended from the low 0.6433. Traders will also note that directly above this point we have resistance plotted at 0.6301, which converges closely with a 50.0% retracement ratio at 0.6273.
Areas of consideration:
All (technical) eyes are likely on 0.63/0.6237 today. Not only is it a H4 Fibonacci powerhouse, it connects with the 50.0% retracement noted on the daily timeframe at 0.6273 and resistance at 0.6301. In addition to this, buy stops positioned above 0.62, once filled, become buy orders, therefore providing liquidity to sell into.
Entry techniques, of course, will vary. Most, nonetheless, will favour an entry on a close back beneath 0.62 as this helps confirm seller intent; others may favour entry by way of candlestick confirmation.
USD/JPY:
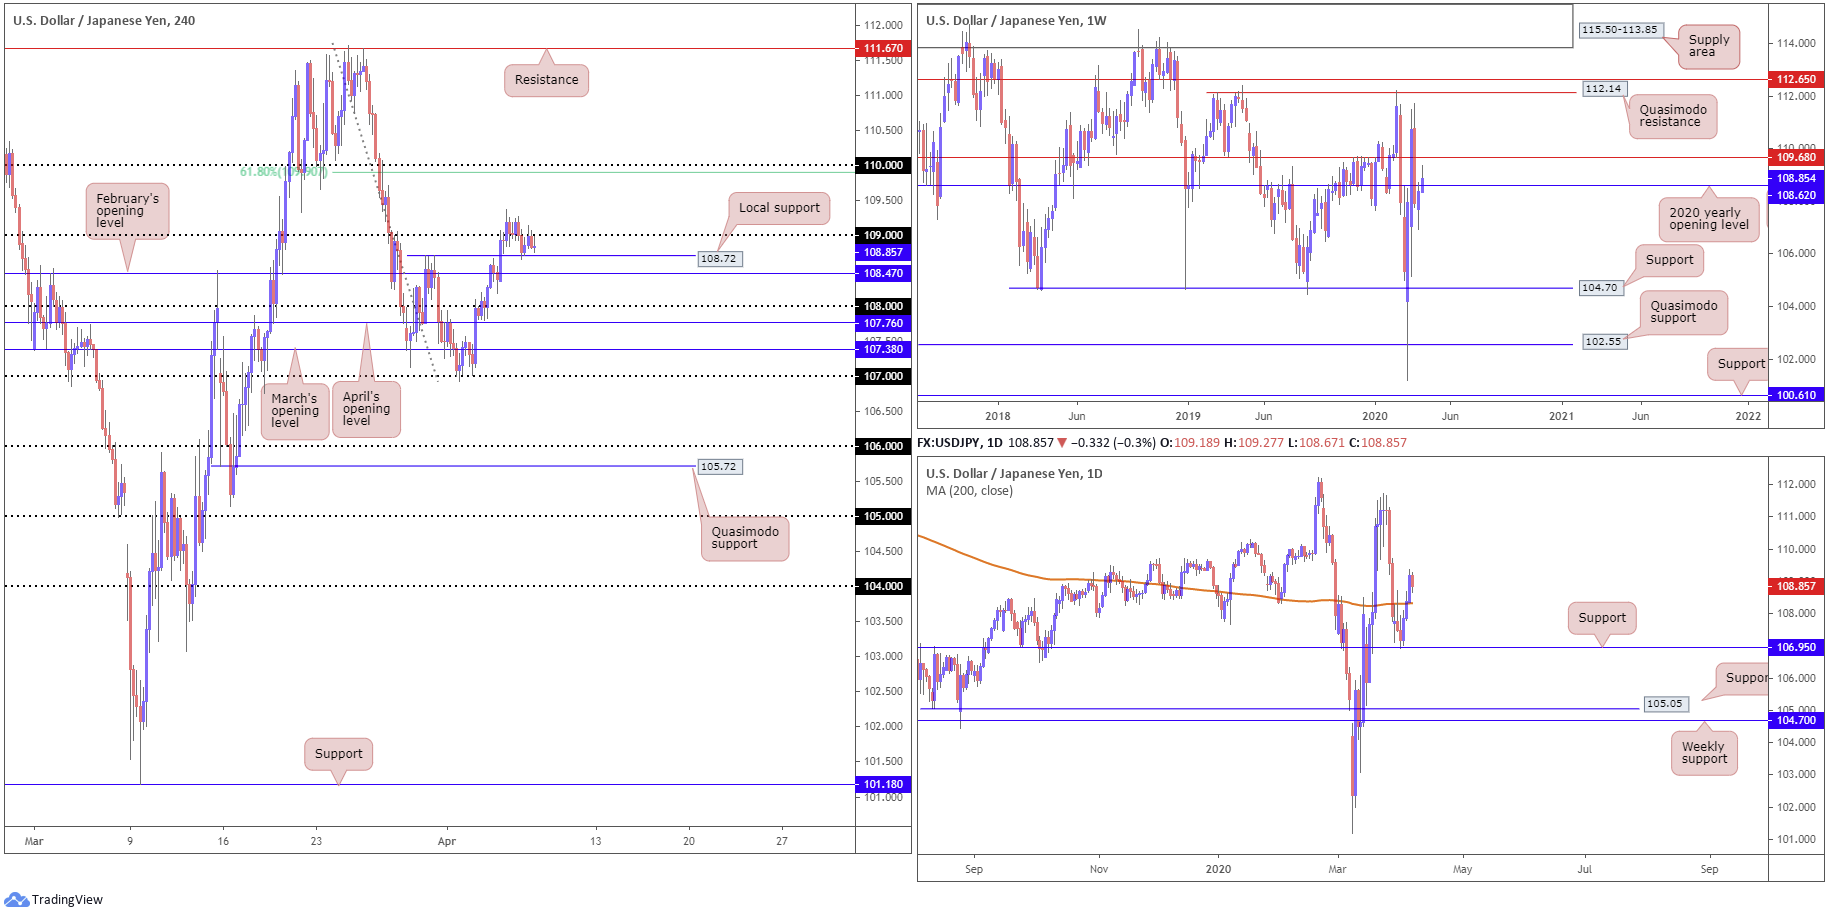
The US dollar ended Tuesday a shade lower against the greenback, snapping a three-day bullish phase off the 107 handle, consequently dipping sub 109 on the H4.
H4 local support is seen off the 108.72ish region, sited just ahead of February’s opening level at 108.47. As of current price, the H4 candles are holding 109 to the downside on a retest, though appears to be a lack of follow through.
Recent movement pulled weekly price through its 2020 yearly opening level at 108.62, drawing the 2019 yearly opening level at 109.68 into sight as possible resistance. Lower on the curve, daily price toppled its 200-day SMA at 108.32, potentially providing an early cue we may be headed for 109.68 on the weekly timeframe.
Areas of consideration:
For traders who read Tuesday’s briefing you may recall the following piece (italics):
Technical traders will likely be watching price action for signs of buying off 109, possibly in the shape of a bullish candlestick formation – think hammer or engulfing pattern – targeting weekly resistance at 109.68, followed by the 110 handle on the H4.
There was little suggesting buyers wanted to take things higher off 109 (via candlestick analysis), therefore most likely avoided an unnecessary trade here. Going forward, however, the research team still feels upside above 109 is possible, in light of the bigger picture showing scope for higher levels to at least 109.68 (weekly timeframe). As such, a H4 close back above 109 today may draw breakout buyers back into the frame, with conservative traders joining the party should a retest at 109 occur and hold in the form of a bullish candlestick pattern.
USD/CAD:
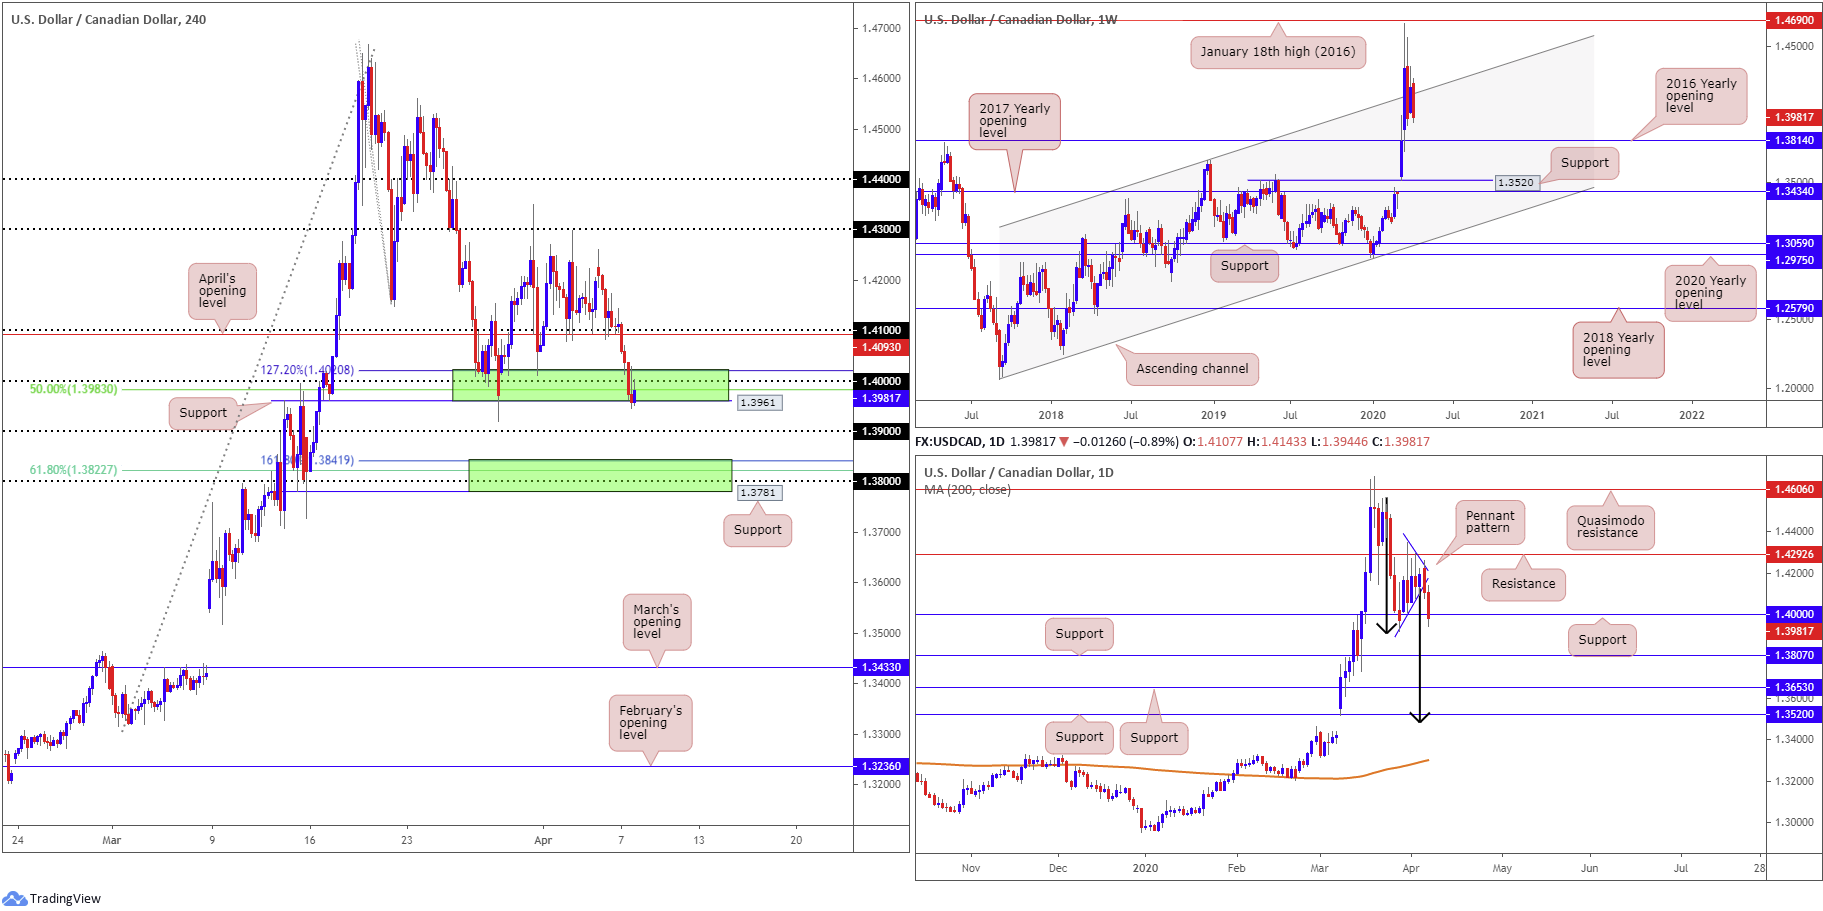
With the US dollar index putting in a reasonably dominant bearish session, along with oil prices tumbling for a second successive day, USD/CAD overwhelmed the 1.41 handle and April’s opening level at 1.4093. This led to the H4 candles nosediving into the walls of a notable support zone between 1.3961-1.4020 (upper green zone), made up of a 127.2% Fibonacci extension base at 1.4020, the round number 1.40, a 50.0% retracement at 1.3983 and support coming in at 1.3961.
In the event 1.3961-1.4020 fails to hold, 1.3781-1.3841 is next in the firing range, comprised of a H4 support level at 1.3781, the 1.38 handle, a 61.8% Fibonacci retracement ratio at 1.3822 and a 161.8% Fibonacci extension point at 1.3841 (lower green zone).
Across the page on the daily timeframe, pattern traders will recognise a bearish pennant formation (1.4349/1.4011) had its lower edge breached yesterday, with daily support at 1.4000 welcoming price action. The take-profit target for the bearish pattern is set around 1.3482, measured by taking the preceding move prior to the pattern formation and adding this value to the breakout point (black arrows).
Higher up on the curve, weekly price is making space south of a channel resistance, extended from the high 1.3661, with the 2016 yearly opening level at 1.3814 noted as a possible downside target.
Areas of consideration:
1.3961-1.4020 on the H4 timeframe is unlikely to hold ground. Not only has it had its lower edge tested, weekly price shows room to approach 1.3814 and daily price recently broke out from a bearish pennant formation, with plenty of room seen to the downside until crossing swords with its take-profit target.
While daily support at 1.4000 may have buyers attempting to hold things higher, sellers appear to have the upper hand here. For that reason, bearish scenarios off the underside of the 1.40 handle on the H4 may be an option today, targeting 1.39 as the initial take-profit zone.
USD/CHF:
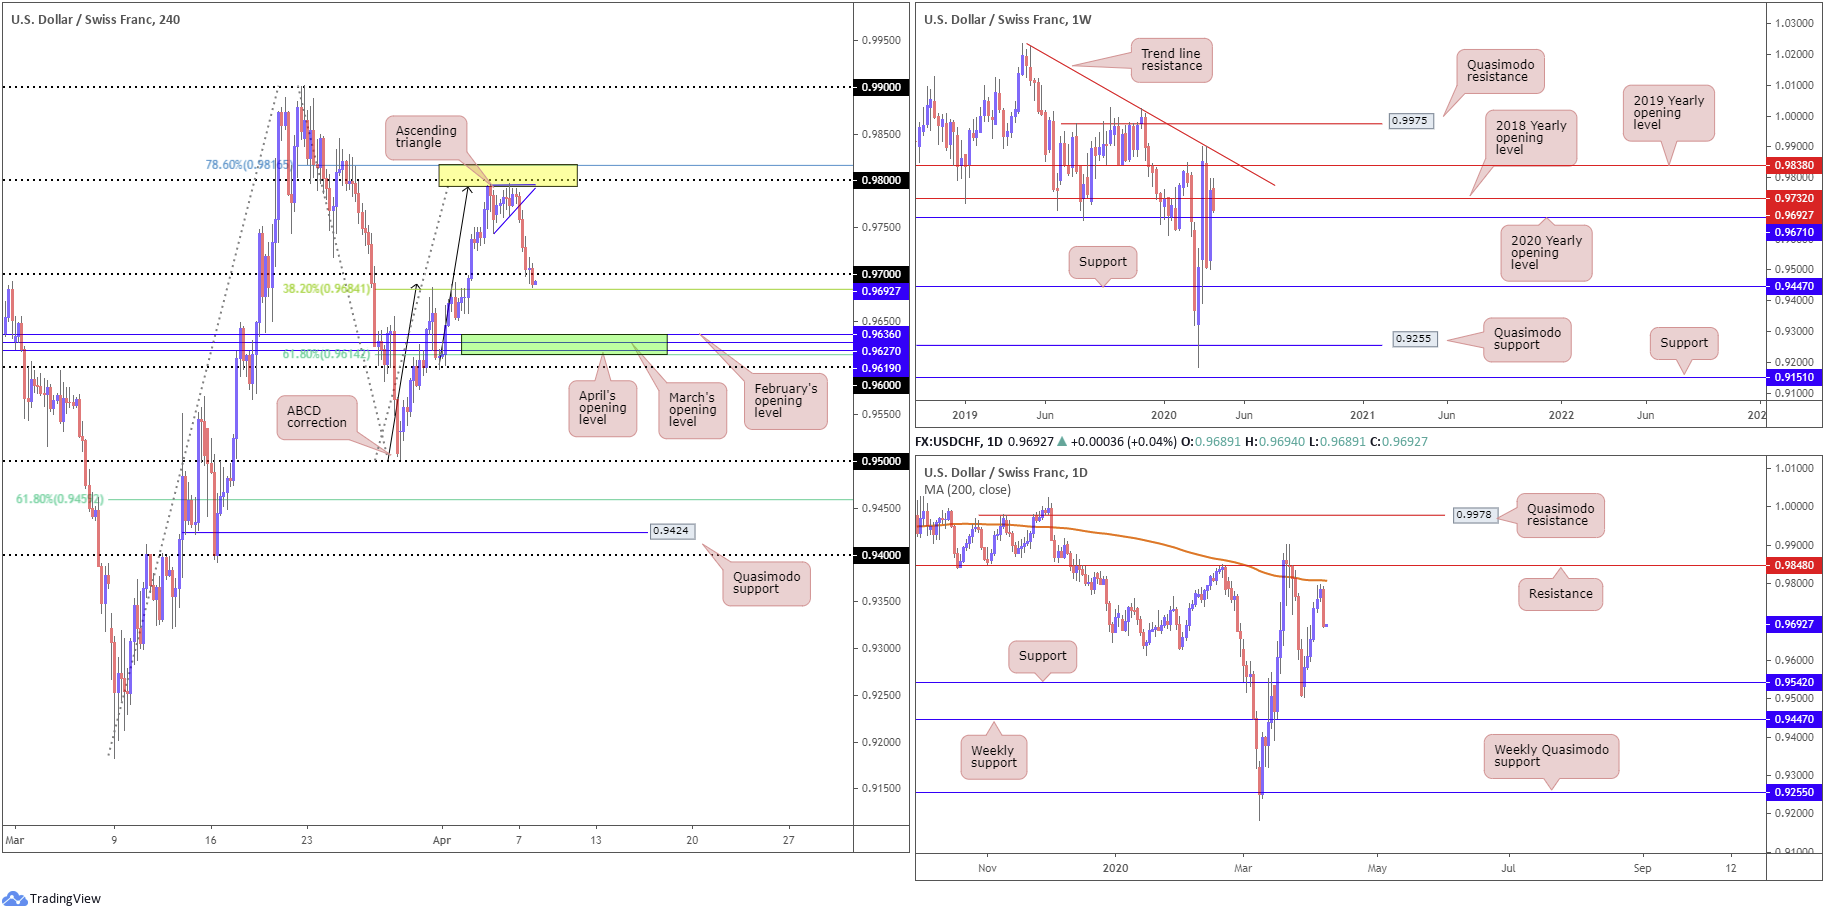
Alongside the US dollar index, USD/CHF turned sharply lower Tuesday after rattling the lower boundary of an ascending triangle formation on the H4 timeframe. Price action, as aired in yesterday’s analysis, tested a H4 ABCD bearish completion (black arrows) from 0.9794, formed south of 0.98, shadowed by a 78.6% Fibonacci retracement at 0.9816 (yellow). Also noted in recent writing was in the event of a breakout lower from the triangle pattern, downside targets form around the 0.97 handle, followed closely by the 38.2% Fibonacci retracement at 0.9684 (a traditional take-profit target out of ABCD formations).
Should we continue to navigate lower levels today, an interesting combination of monthly opening levels from April, March and February form around 0.9619, 0.9627 and 0.9636, respectively. Note also this area closely connects with the 61.8% Fibonacci retracement at 0.9614 – considered the second take-profit target out of the ABCD pattern.
As seen on the weekly timeframe, the current candle crossed back beneath the 2018 yearly opening level at 0.9732, consequently shining the spotlight back on the 2020 yearly opening level at 0.9671. Closer analysis of price action on the daily timeframe reveals USD/CHF snapped a six-day bullish phase and chalked up a near-full-bodied bearish candle just south of the 200-day SMA (orange – 0.9807). Support at 0.9542, therefore, is back in the offing.
Areas of consideration:
Bearish setups south of 0.97 are an idea worth exploring today, given weekly price reclaiming 0.9732, targeting the 2020 yearly opening level on the weekly timeframe at 0.9671, followed by 0.9614/0.9636 on the H4.
0.9614/0.9636 is an interesting area of support likely on the watchlists of many traders today (contains a number of monthly opening levels and a 61.8% Fibonacci support), not only as a take-profit target, but also as a platform for buyers to possibly enter the market. Traders are, however, urged to pencil in the possibility of a fakeout occurring to 0.96 before serious buyers step in.
Dow Jones Industrial Average:
Major benchmark indexes dipped into negative territory after retreating into the later stages of Tuesday’s session. The Dow Jones Industrial Average erased 26.13 points, or 0.12%; the S&P 500 also lost 4.27 points, or 0.16%, and the tech-heavy Nasdaq 100 concluded lower by 32.36 points, or 0.40%.
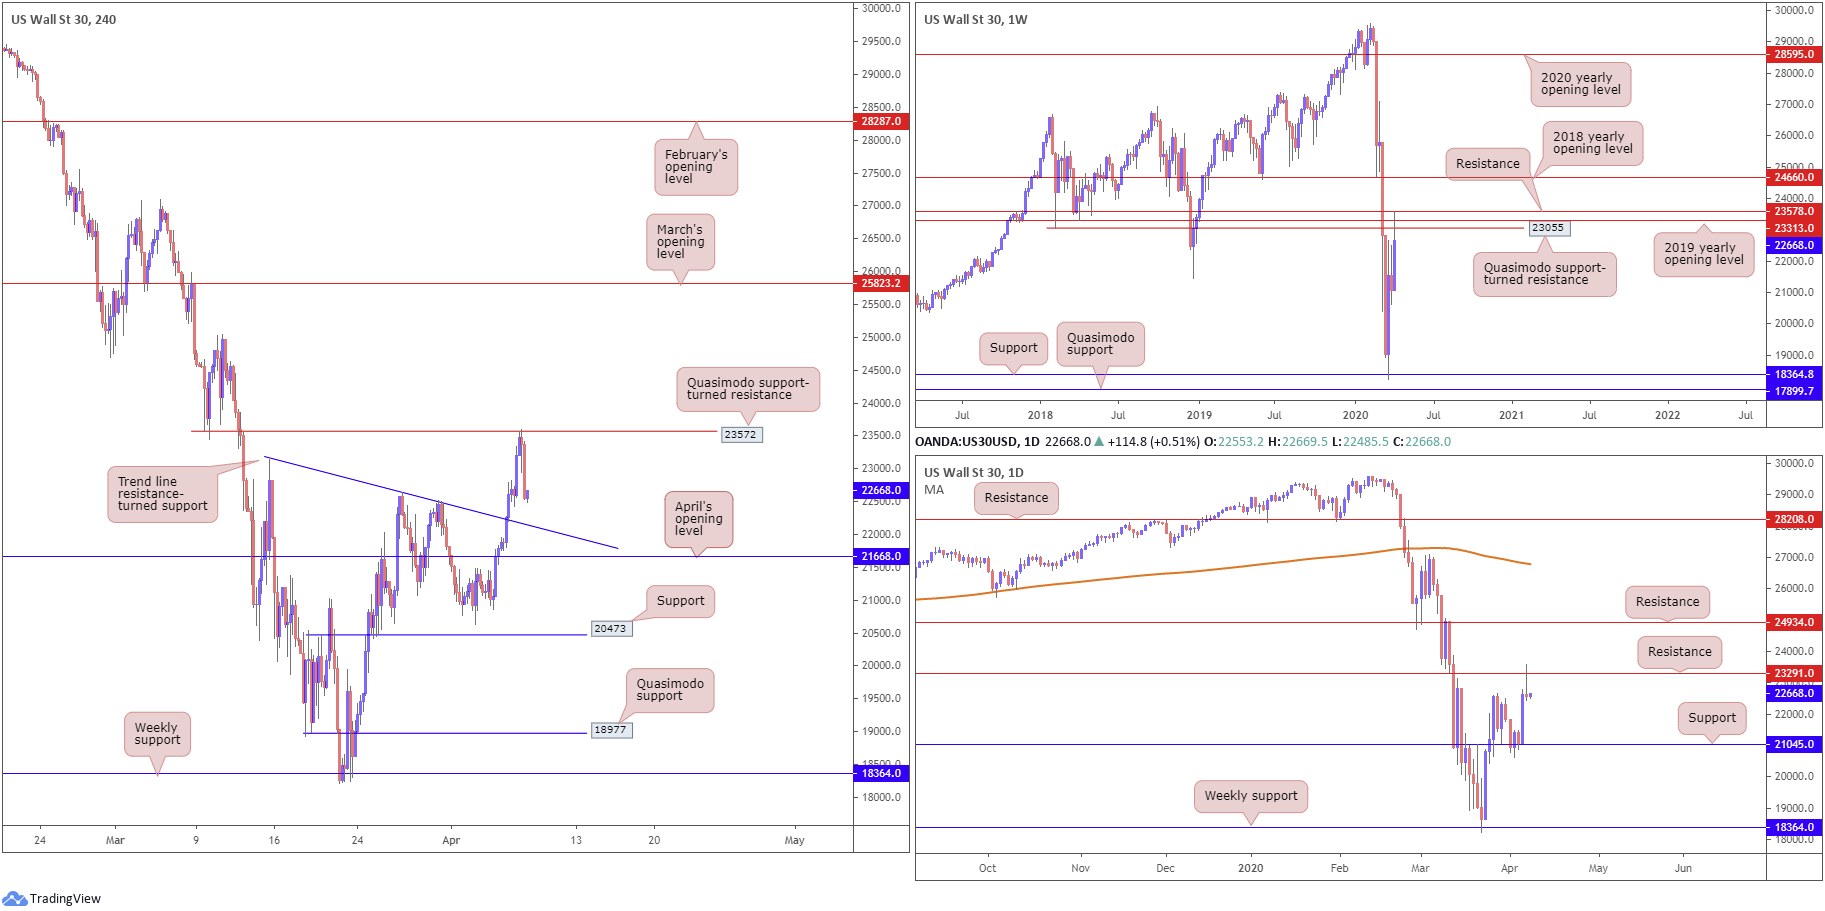
Kicking off from the weekly timeframe this morning, we can see price action ran into a strong ceiling of resistance, comprised of 23578, the 2019 yearly opening level at 23313 and a Quasimodo support-turned resistance at 23055.
Lower on the curve, daily price retested resistance at 23291 and finished the day in the shape of a shooting star candlestick pattern. Price action on the H4 timeframe connected with a Quasimodo support-turned resistance at 23572 yesterday and turned sharply lower, with the candles pointing to a possible test of trend line resistance-turned support, taken from 23145, followed by April’s opening level at 21668.
Areas of consideration:
According to the weekly and daily timeframes, further selling is likely in the offing today. Some traders will likely seek short positions off the back of the recently closed daily shooting star candlestick pattern, targeting daily support at 21045.
Shorter-term movement, nonetheless, could see downside hampered from the H4 trend line resistance-turned support, taken from 23145, and April’s opening level at 21668. Therefore, short sellers may consider waiting and seeing if a pullback materialises before pulling the trigger. This will at least provide some breathing space, enough to reduce risk to breakeven at the said H4 support structures.
XAU/USD (GOLD):
Gold, in $ terms, failed to build on Monday’s gains, with Tuesday dipping nearly 1% into the red and snapping a four-day bull phase, as equities explored higher ground and drew markets into a risk-on scenario.
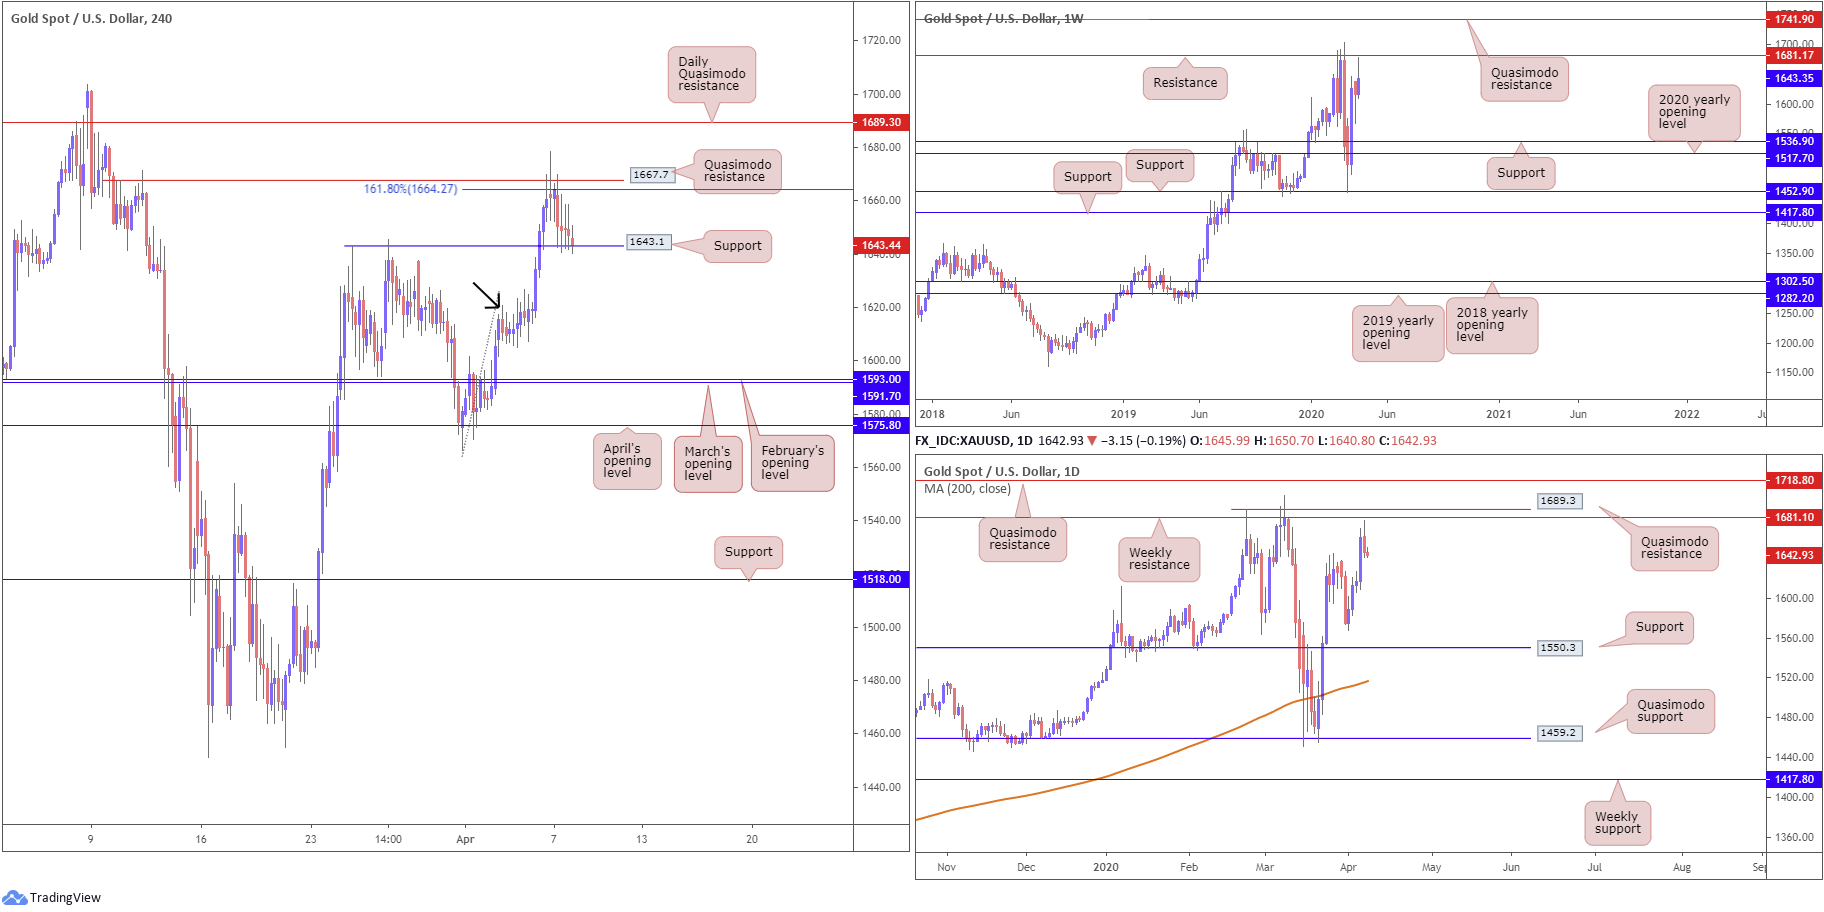
H4 Quasimodo resistance at 1667.7 remains in the field, as does the 161.8% Fibonacci extension at 1664.2. Recent action, however, nudged into local support at 1643.1, a prior Quasimodo support level. Should the level fail, demand is visible around 1617.0ish, followed by March and April’s opening levels at 1591.7 and 1593.0, respectively.
Further out on the weekly timeframe, we have the current candle off best levels south of resistance at 1681.1, with a break of this base exposing Quasimodo resistance at 1741.9. As evident from the daily chart, price action is retreating a few points beneath weekly resistance at 1681.1, closely followed by daily Quasimodo resistance at 1689.3. Support on the higher timeframes is not expected to emerge until reaching a daily base coming in at 1550.3.
Areas of consideration:
Having noted higher-timeframe flow making a show close by weekly resistance at 1681.1, H4 action may look to step through current support at 1643.1 today.
While a decisive H4 close sub 1643.1 will lure breakout sellers into the market, conservative traders may seek additional confirmation, such as a retest of 1643.1, or even a retest that’s formed by way of a bearish candlestick signal. Irrespective of the entry, H4 support could develop off 1617.0 and also from March and April’s opening levels at 1591.7 and 1593.0.
The accuracy, completeness and timeliness of the information contained on this site cannot be guaranteed. IC Markets does not warranty, guarantee or make any representations, or assume any liability regarding financial results based on the use of the information in the site.
News, views, opinions, recommendations and other information obtained from sources outside of www.icmarkets.com.au, used in this site are believed to be reliable, but we cannot guarantee their accuracy or completeness. All such information is subject to change at any time without notice. IC Markets assumes no responsibility for the content of any linked site.
The fact that such links may exist does not indicate approval or endorsement of any material contained on any linked site. IC Markets is not liable for any harm caused by the transmission, through accessing the services or information on this site, of a computer virus, or other computer code or programming device that might be used to access, delete, damage, disable, disrupt or otherwise impede in any manner, the operation of the site or of any user’s software, hardware, data or property.


