
A note on lower timeframe confirming price action…
Waiting for lower timeframe confirmation is our main tool to confirm strength within higher timeframe zones, and has really been the key to our trading success. It takes a little time to understand the subtle nuances, however, as each trade is never the same, but once you master the rhythm so to speak, you will be saved from countless unnecessary losing trades. The following is a list of what we look for:
- A break/retest of supply or demand dependent on which way you’re trading.
- A trendline break/retest.
- Buying/selling tails/wicks – essentially we look for a cluster of very obvious spikes off of lower timeframe support and resistance levels within the higher timeframe zone.
- Candlestick patterns. We tend to only stick with pin bars and engulfing bars as these have proven to be the most effective.
We search for lower timeframe confirmation between the M15 and H1 timeframes, since most of our higher-timeframe areas begin with the H4. Stops are usually placed 5-10 pips beyond confirming structures.
EUR/USD:
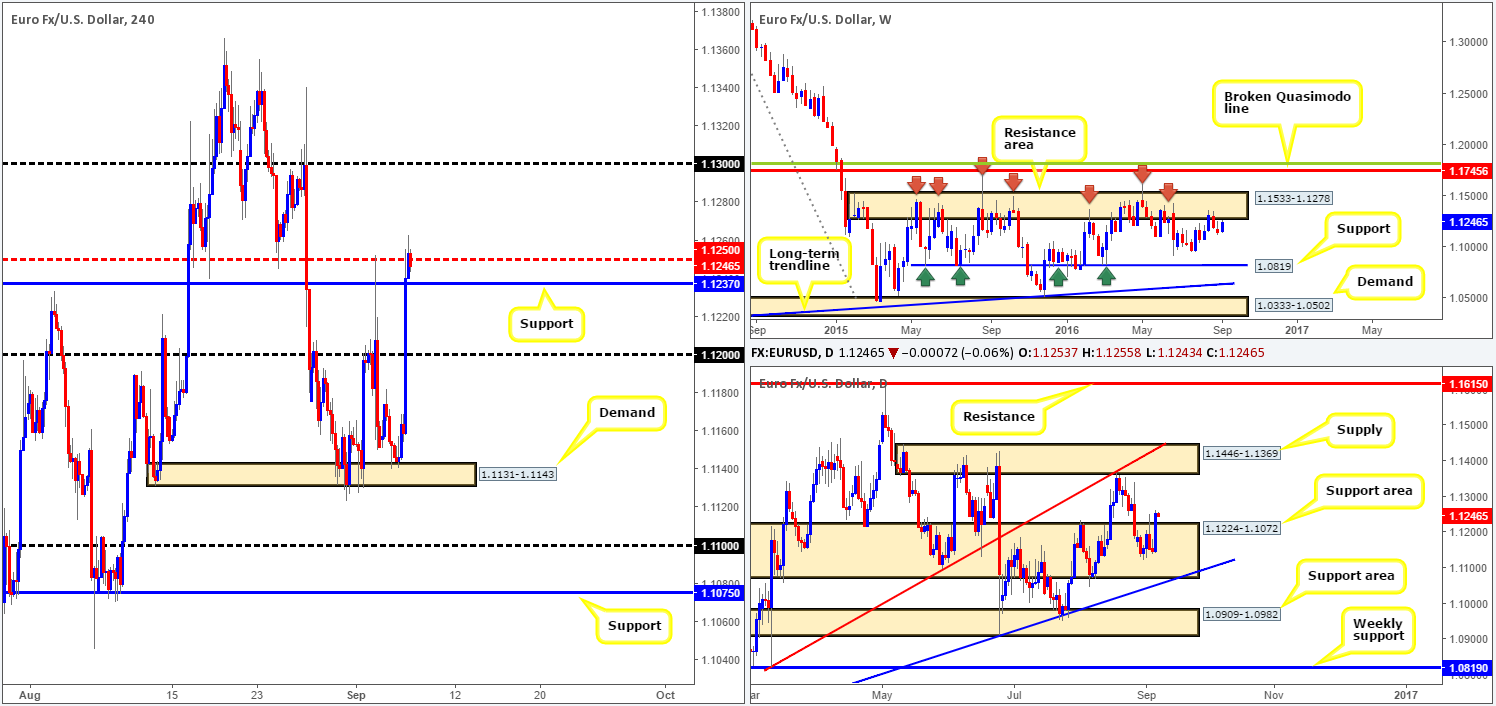
With the help of a lower than expected US ISM non-manufacturing PMI print, the shared currency rallied over 100 pips yesterday. Both the 1.12 handle and the H4 resistance at 1.1237 (now acting support) were wiped out, allowing price to challenge the H4 mid-way resistance 1.1250 going into the close.
Looking over at the higher-timeframe technicals, we can see that the daily support area at 1.1224-1.1072 is holding firm for the time being. Further buying from here will likely see price marry up with daily supply coming in at 1.1446-1.1369. Meanwhile, however, up on the weekly chart, the current weekly candle is now seen within striking distance of the major resistance area seen at 1.1533-1.1278. Considering that this beauty has capped upside in this market since May 2015, the bulls likely have their work cut out for them if they intend on pushing the pair higher this week!
Our suggestions: Look for a decisive close above 1.1250 today. As long as price retests this barrier followed by a lower timeframe buy signal (see the top of this report), a buy entry is valid in our opinion, and has a high probability of achieving 1.13. Other than this folks, we do not really see much else to hang our hat on at the moment.
Levels to watch/live orders:
- Buys: Watch for price to close above 1.1250 and then look to trade any retest seen thereafter (lower timeframe confirmation required).
- Sells: Flat (Stop loss: n/a).
GBP/USD:
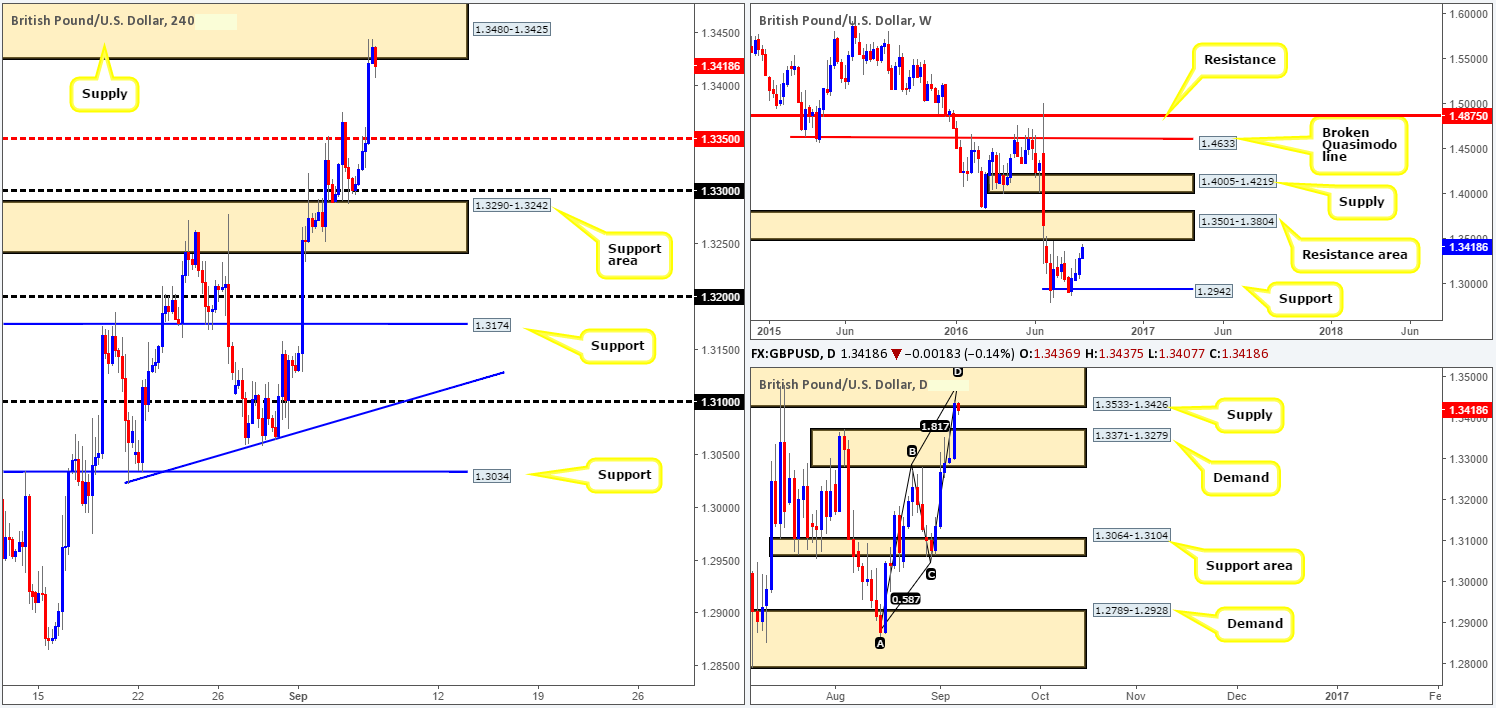
During the course of yesterday’s sessions the pound rallied close to 140 pips against its US counterpart, aided by a weak US ISM non-manufacturing PMI print. Well done to any of our readers who caught this move as this was a noted setup to keep an eye on yesterday. As is shown on the H4 chart, price is now seen rotating from supply chalked up at 1.3480-1.3425. The other key thing to note here is that this zone is housed within the confines of a larger daily supply area seen at 1.3533-1.3426, which in itself is supported by a weekly resistance area at 1.3501-1.3804.
Our suggestions: Quite simply, given the overall structure of this market, we feel that a downside move is likely on the cards. Personally, however, we’d like to see the bulls stretch to around the 1.3475ish range before shorting. The reasons for why are because the tip of a daily AB=CD completion sits around this region, and we also have to allow for the possibility of a fakeout above the current H4 supply to the 1.35 handle, which, of course, represents the underside of the weekly resistance area! Therefore, a pending sell order has been set at 1.3475 (deep within the current H4 supply) with a stop placed above the current daily supply area at 1.3535.
Levels to watch/live orders:
- Buys: Flat (Stop loss: n/a).
- Sells: 1.3475 [pending order] (Stop loss: 1.3535)
AUD/USD:
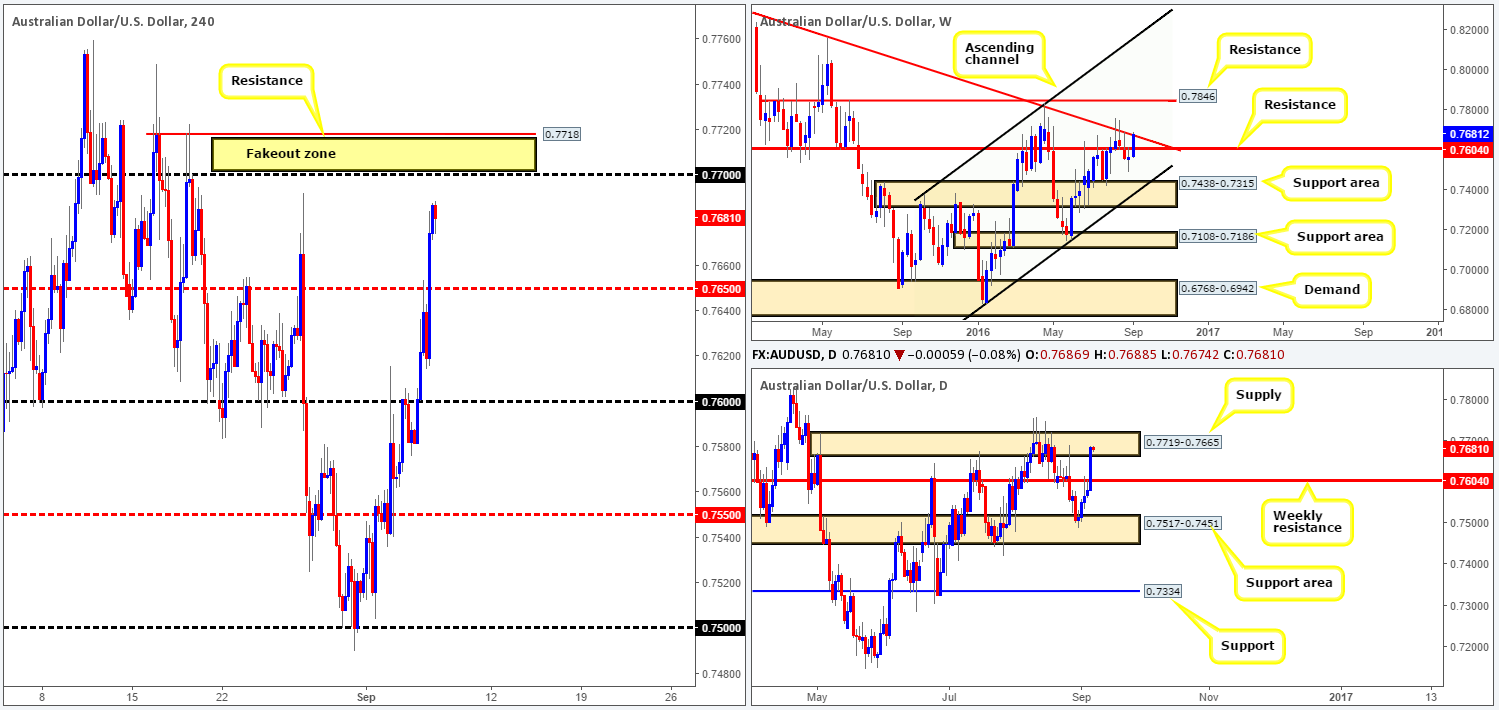
Starting from the top of the pile this morning, weekly action shows price recently breached resistance coming in at 0.7604 and connected with trendline resistance extended from the high 0.8295. Looking down to the daily chart, supply at 0.7719-0.7665 was brought into the action yesterday. This zone, as you can see, held this market lower between the 10/18th August so we may see history repeat itself here.
Jumping across to the H4 chart, we can see that the ailing dollar helped push the Aussie above the mid-way resistance 0.7650 yesterday, and is now seen loitering within shouting distance of the 0.77 handle. Usually, our team would look to short 0.77 due to this number being positioned around both a daily supply as well as a weekly trendline resistance (see above). However, seeing as how there’s a nice-looking H4 resistance level at 0.7718 lurking just above it, we feel a fakeout is highly likely to take place. With that being the case, traders may want to keep an eye on this level for shorting opportunities today.
Levels to watch/live orders:
- Buys: Flat (Stop loss: n/a).
- Sells: 0.7718 region [possible fakeout level] (Stop loss: around the 0.7752ish band).
USD/JPY:
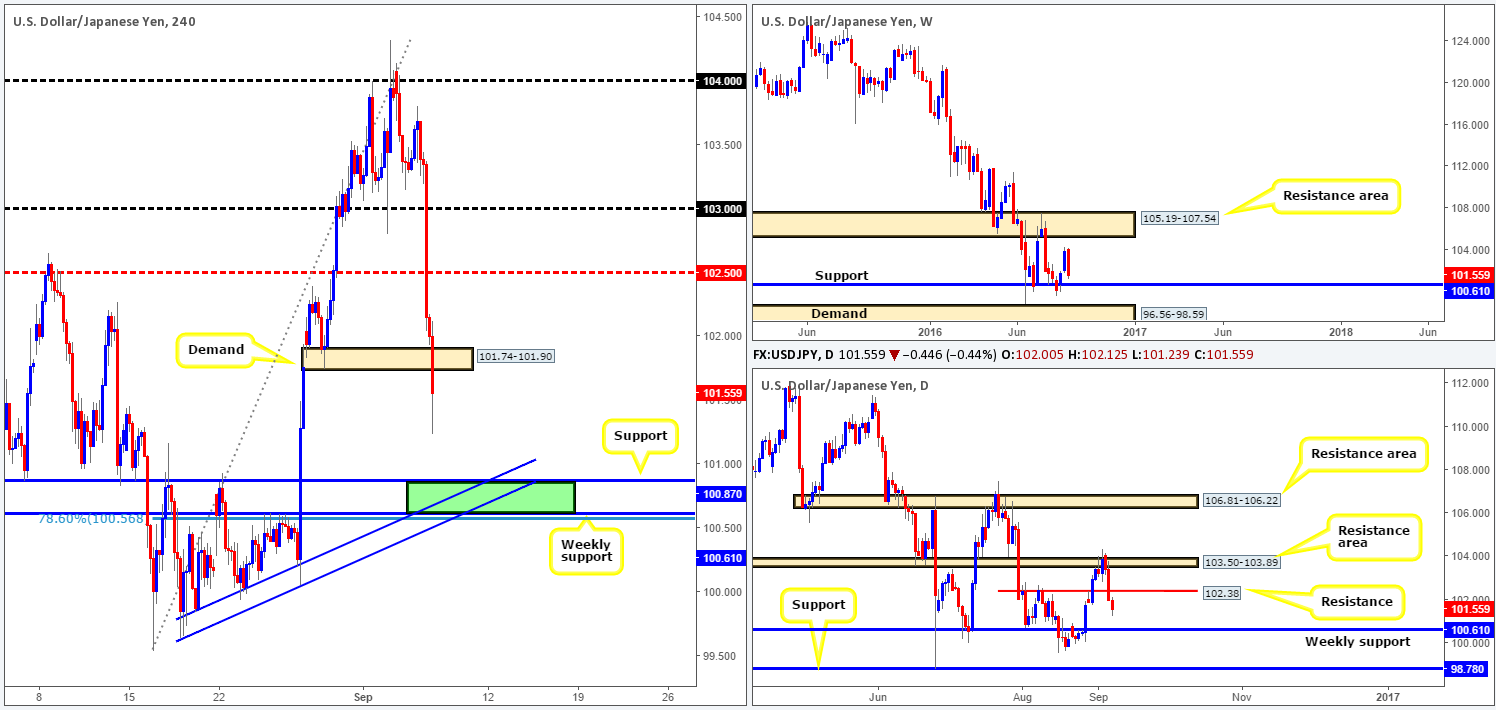
In recent trading, we saw the USD plummet on the back of week US data, taking out the 103 handle, the H4 mid-way support 102.50 and just recently the H4 demand base seen at 101.74-101.90. With a truckload of buyers likely taken out from this recent move, there is space now seen to move lower down to test the H4 support 100.87. In addition to this, a minor daily support level at 102.38 was also engulfed during yesterday’s selling, which, as you can probably see, has opened the path down to weekly support coming in at 100.61.
Our suggestions: Between the current weekly support and H4 support (100.61/100.87), there is a good chance that price will bounce from this region should the couple strike this area today. Bolstered by a H4 trendline support taken from the low 99.64 as well as a H4 78.6% Fib support at 100.56, this area has sufficient confluence, in our opinion, to condone a pending buy order with a stop placed at 100.48.
Levels to watch/live orders:
- Buys: 100.88 [possible pending order] (Stop loss: 100.48).
- Sells: Flat (Stop loss: n/a).
USD/CAD:
The USD/CAD has been trading south for three consecutive days, down from its peak 1.3147. Yesterday’s selling was triggered by a weak US ISM non-manufacturing PMI reading, consequently forcing the H4 to close below a Quasimodo support at 1.2858. With recent action seen retesting the underside of this line, and space seen for this unit to move lower down to another H4 Quasimodo support at 1.2798, we may be in for another ride south today! This – coupled with weekly action showing room for price to test 1.2658: a 38.2% Fib support, and daily price looking set to continue lower down to the support area at 1.2653-1.2753, shorting this market at the current H4 broken Quasimodo line is a high-probability turning point!
Our suggestions: If one is considering selling the 1.2858 level today, however, we would advise waiting for lower timeframe confirmation (see the top of this report). The reason as to why is simply to avoid any fakeout that could take place around this fixed level.
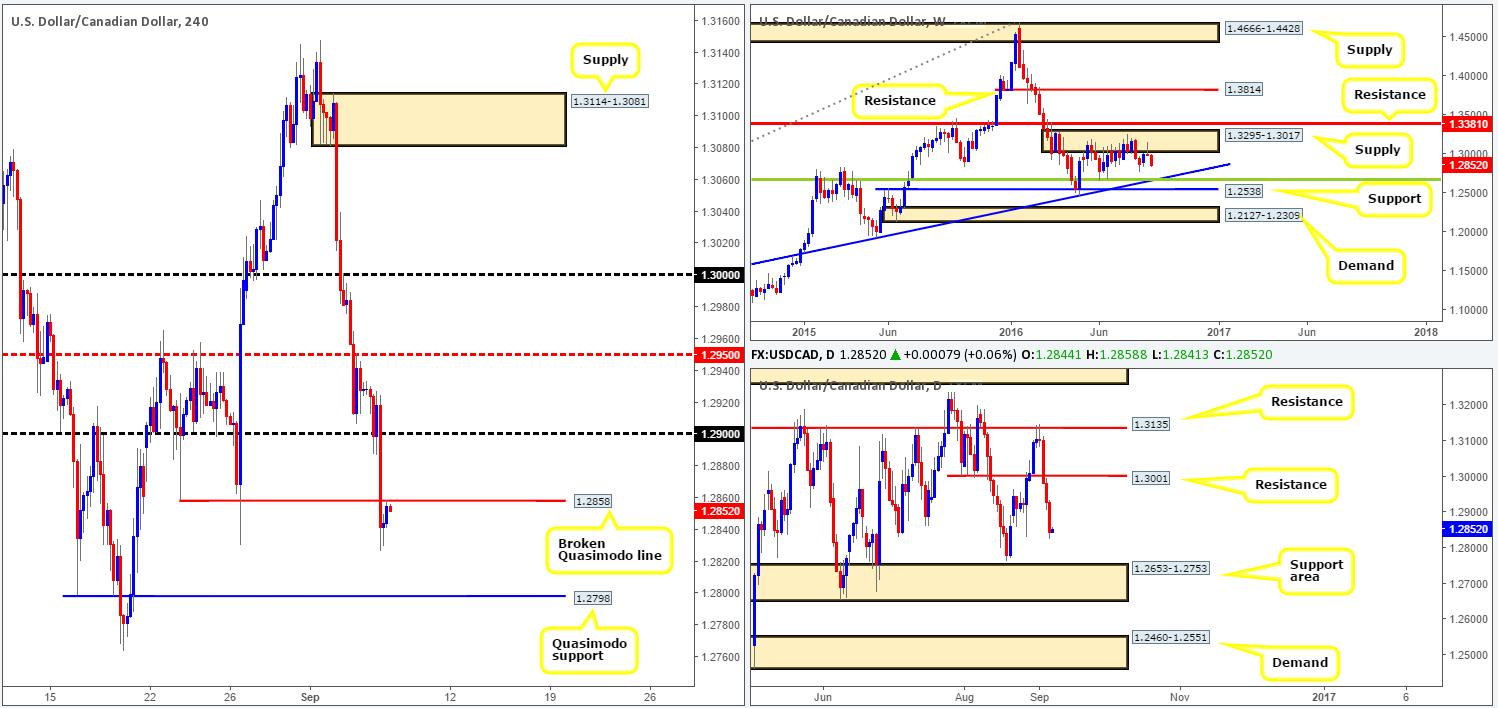
Levels to watch/live orders
- Buys: Flat (Stop loss: n/a).
- Sells: 1.2858 region [tentative – confirmation required] (Stop loss: dependent on where one confirms this area).
USD/CHF:
Weighed on heavily by poor US ISM non-manufacturing PMI data, the pair aggressively sold off going into yesterday’s London session. The H4 support at 0.9762 was completely annihilated and ended the day with price testing the 0.97 handle.
Taking into account that bids are holding firm around the 0.97 boundary right now, would we consider this to be a stable platform for long trades today? Of course, it is possible that we may see the US dollar appreciate from this region due to daily price also occupying a support area coming in at 0.9648-0.9708. Despite this, there is, at least in our opinion, a far more attractive zone sitting just below.
Also housed within the above said daily support area we have a H4 support level at 0.9648, a H4 AB=CD completion point checking in at 0.9673 and a H4 61.8% Fib support at 0.9670. Collectively, this area is likely to bounce this market should price strike this zone today, and at least reach the 0.97 handle. However, in that weekly price is showing room to extend lower down to the 0.9508 (support level) hurdle right now, we would advise waiting for lower timeframe confirmation to form prior to pulling the trigger within the above said H4 buy zone. For a list of lower timeframe entry techniques, please see the top of this report.
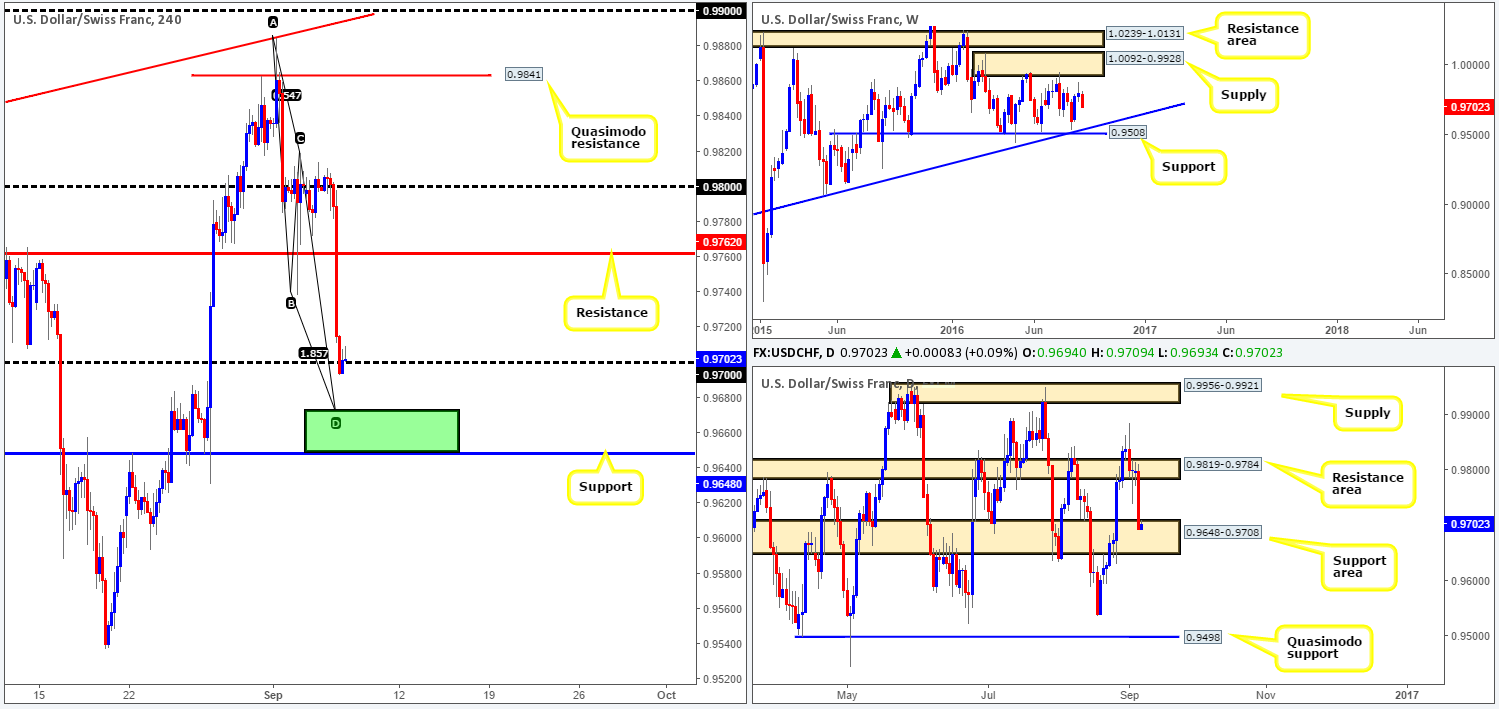
Levels to watch/live orders:
- Buys: 0.9648/0.9673 [tentative – confirmation required] (Stop loss: dependent on where one confirms this area).
- Sells: Flat (Stop loss: n/a).
DOW 30:
The impact of yesterday’s US ISM non-manufacturing PMI data forced price to violently whipsaw down to H4 demand seen at 18467-18446. This eventually led to a close above H4 supply drawn from 18524-18503, which, as you can see, is now an acting demand zone. Our team has come to general consensus that this area will likely hold firm today given its supporting higher-timeframe structures. Over on the weekly chart, price recently rebounded off the top edge of a support area coming in at 18365-18158, which could bolster an advance up to (and possibly beyond) the all-time high 18668 this week. Daily action on the other hand, remains trading mid-range between 18322/18636, but did in fact print a nice-looking bullish engulfing candle during yesterday’s session. This, along with weekly action, will likely see the index attack the top-side of this range sometime this week, and with a little bit of luck, possibly close above it.
Our suggestions: On account of the above points, today’s plan of attack will consist of looking for a H4 bullish close to form off the current H4 demand zone. Should this come into view, our team will look to enter long, with the stop placed below the trigger candle, targeting the H4 Quasimodo resistance at 18579 as an initial take-profit zone. If this comes to fruition, we would personally look at holding some of this position beyond this target, since, as we already mentioned, there’s potential for this market to break all-time highs and continue trading north.
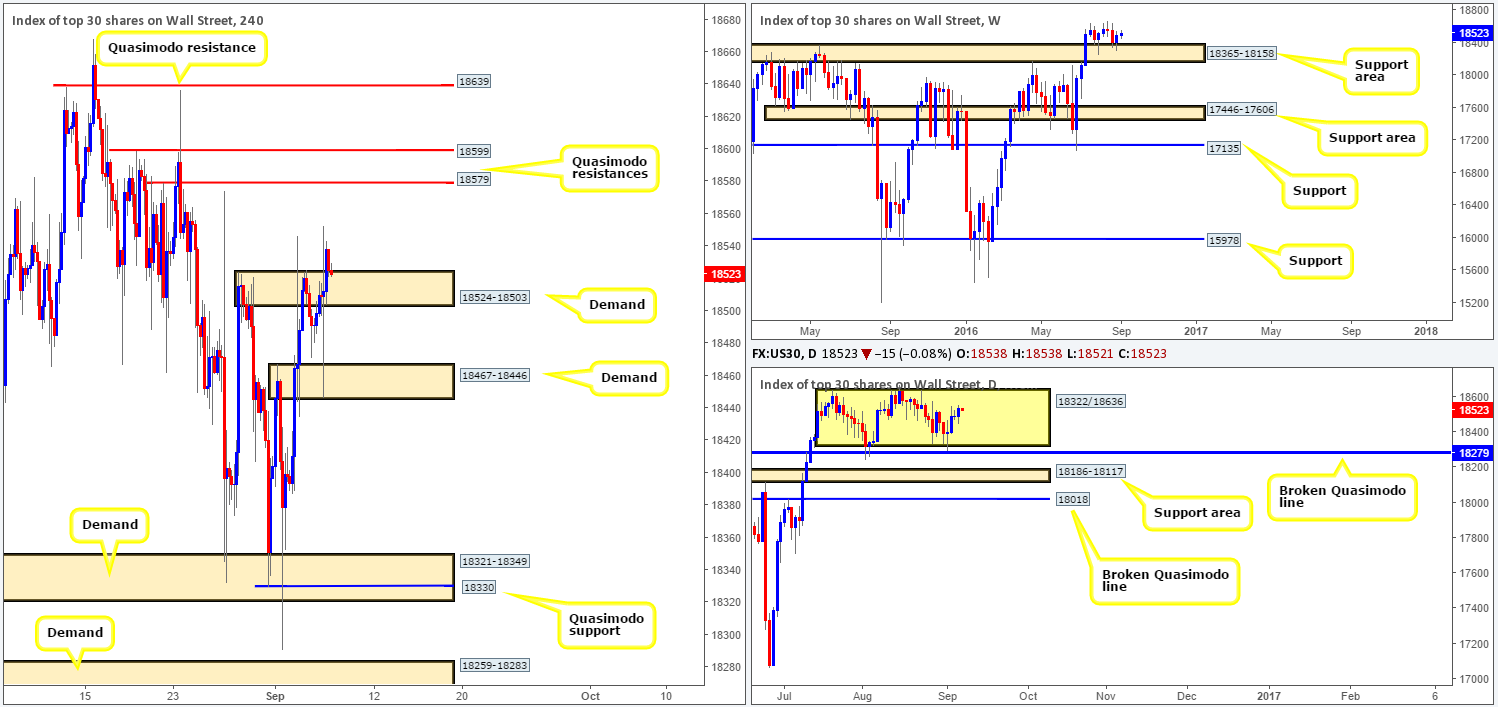
Levels to watch/live orders:
- Buys: Watch for a H4 bullish close off the current H4 demand base at 18524-18503, then look to go long with stops placed below the bullish trigger candle.
- Sells: Flat (Stop loss: n/a).
GOLD:
The yellow metal rallied for a fourth consecutive day yesterday, resulting in price taking out the H4 resistance at 1332.3 as well as a H4 supply barrier coming in at 1344.5-1341.0. This move was bolstered by a weak dollar due to a poor US ISM services PMI print. In addition to this, we can now see that the gold market is trading within reaching distance of a daily resistance level drawn from 1354.6, and also a nearby weekly Quasimodo resistance line penciled in at 1361.7.
Our suggestions: In view of price loitering just ahead of a major daily resistance level, our team has absolutely no intention of buying gold. As such, today’s spotlight will firmly be focused on the 1361.7/1354.6 (weekly Quasimodo level/daily resistance level) region for potential shorting opportunities. Nevertheless, seeing as how this area is rather large, we will not be placing pending orders here. Waiting for the lower timeframes (preferably the M30/H1 timeframes) to confirm bearish intent here is, at least in our book, the better route to take (see the top of this report for lower timeframe entry techniques). This will not only likely get you in at a better price, but also lessen the stop loss required since we’d be looking to place it above the H4 supply seen marked with a black arrow at 1364.9-1360.5.
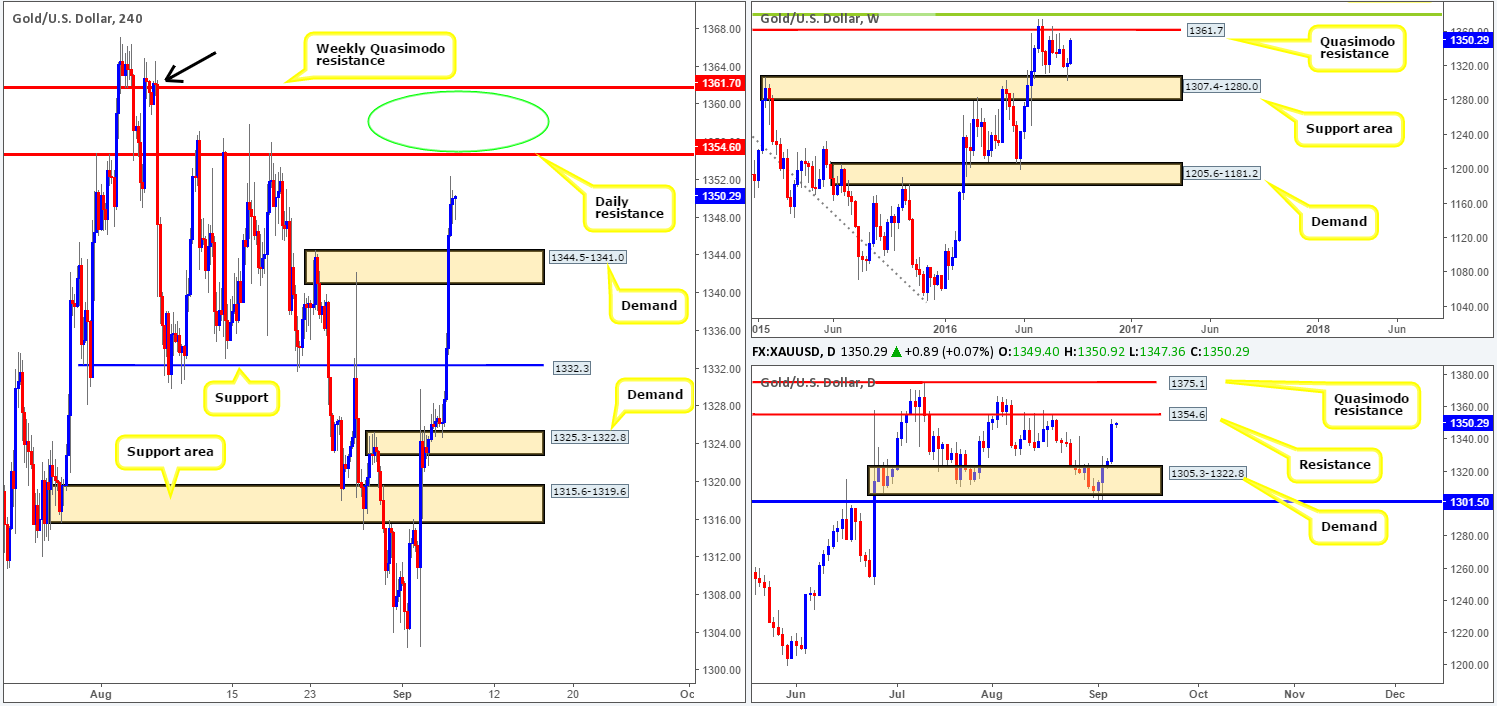
Levels to watch/live orders:
- Buys: Flat (Stop loss: n/a).
- Sells: 1361.7/1354.6 [tentative – confirmation required] (Stop loss: dependent on where one confirms this area).


