
EUR/USD:
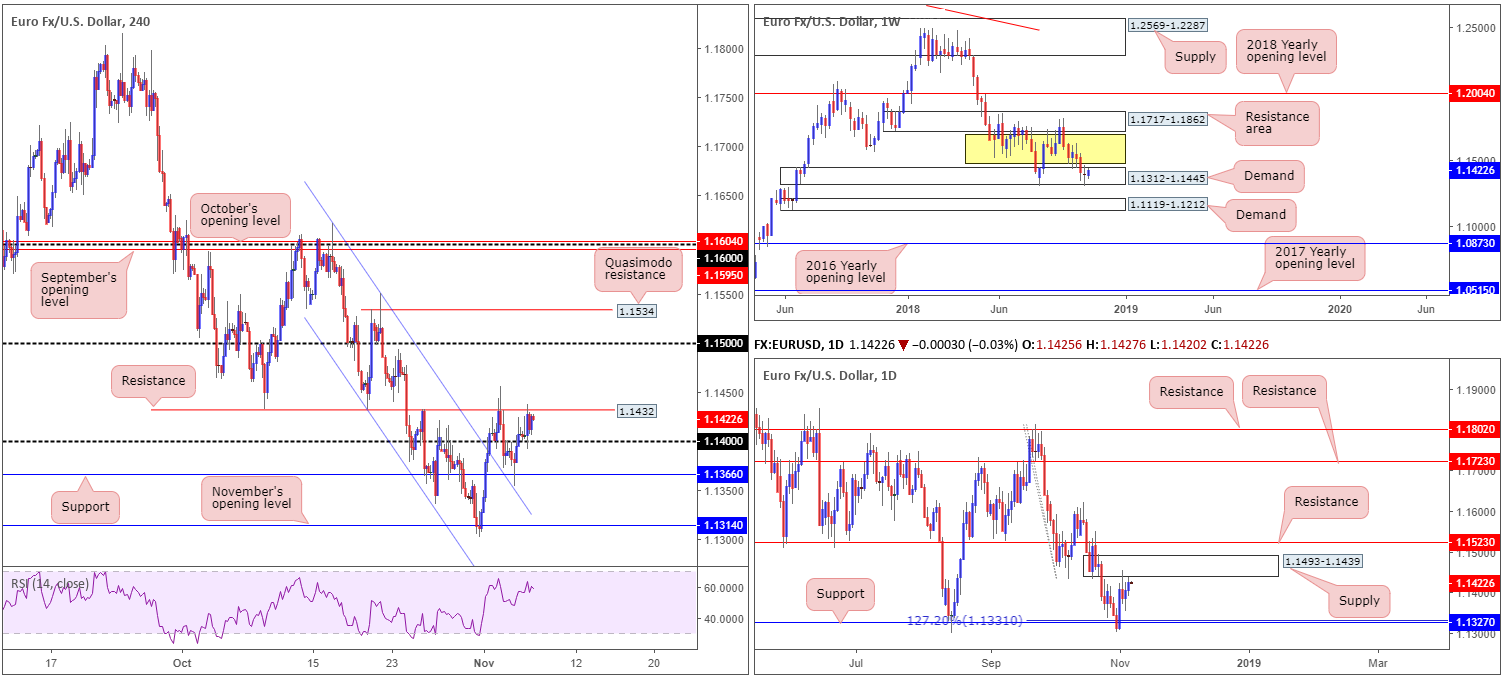
Although the single currency managed to uphold a bullish presence above its 1.14 handle on the H4, the unit failed to sustain gains beyond nearby resistance at 1.1432 Tuesday, concluding the day marginally in the green ahead of the US mid-term election results. Further buying from here has the 1.15 handle on the radar.
US Congressional elections are underway, as we write. Results are expected to begin filtering in around midnight GMT with the final result expected a couple of hours ahead of London’s opening bell. Should Republicans retain control, expect an advance in the USD and equities, while if the houses turn blue, both are expected to fall sharply.
Given the somewhat lackluster performance yesterday, the outlook for this market remains unchanged.
Weekly price remains trading within the walls of demand seen at 1.1312-1.1445. Should buyers regain control from this point, price shows room to extend as far north as a resistance area coming in at 1.1717-1.1862 (capped upside since early June 2018). On the whole, this timeframe is considered range bound (yellow zone). Areas outside of this border fall in at the 2018 yearly opening level drawn from 1.2004 and demand marked at 1.1119-1.1212.
Areas of consideration:
The expectation on the H4 timeframe is still for another higher high to form, according to current market structure (price broke to fresh highs [1.1455] Friday, along with Monday witnessing a lower low take shape off H4 support at 1.1366). Therefore, a break of the current H4 resistance is possible. Well done to any of our readers who managed to enter long from 1.1366 (and remain long in their position) as this was a noted intraday support level to watch in Monday’s briefing.
Although we are effectively trading from weekly demand at the moment, it is worth noting the daily supply at 1.1493-1.1439 could hinder further upside beyond the current H4 resistance level at 1.1432. For that reason, caution on the long side (medium/long term) is still recommended.
Also, from an Intraday standpoint neither a long nor short seems attractive. Not only have we competing structures on the weekly and daily timeframes, the outcome of the US mid-term election results is expected to shake up price action. Therefore, expect some volatility today, traders!
Today’s data points: US congressional election results.
GBP/USD:
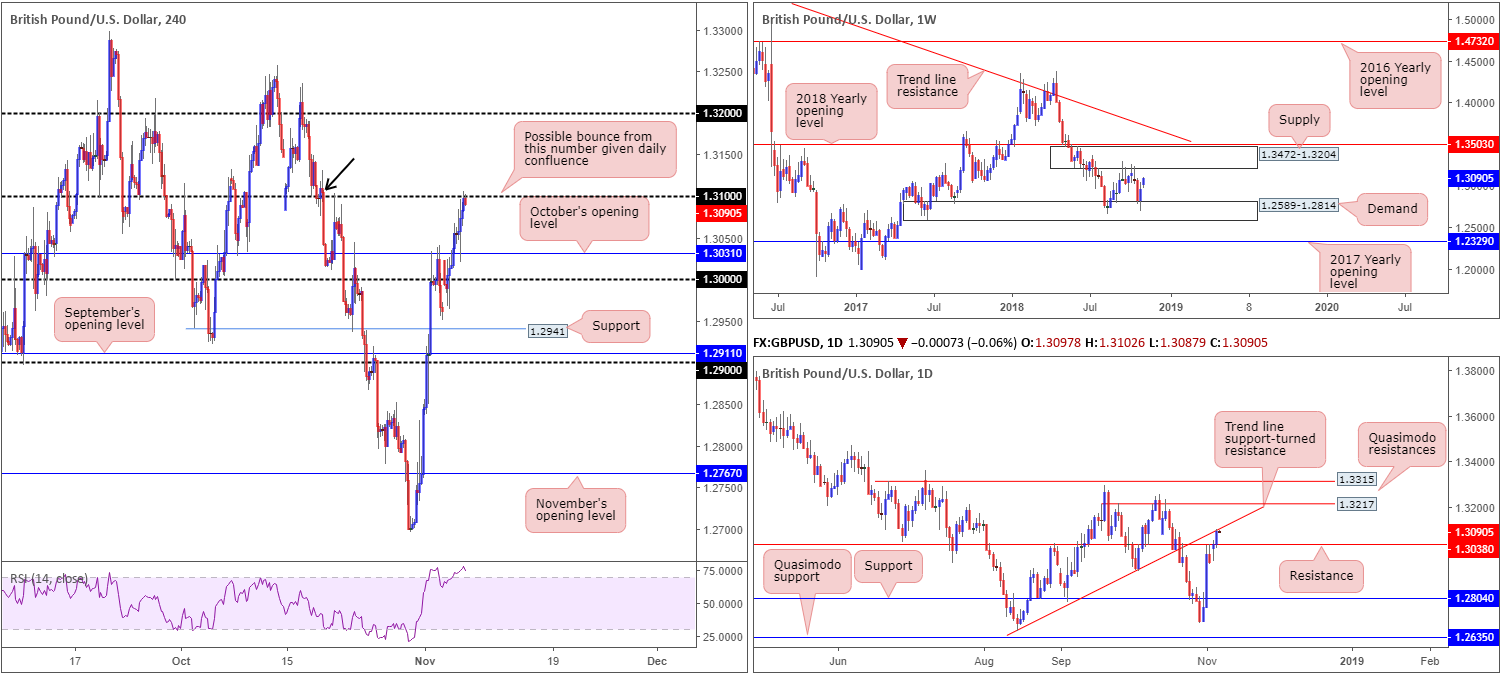
Hopes for a Brexit deal continues to underpin the GBP/USD, despite contradictory headlines flooding the wires. Closing the day up nearly half a percent, the H4 candles shook hands with its 1.31 handle after bouncing from nearby support at 1.3031: October’s opening level.
As highlighted in Tuesday’s briefing, 1.31 not only displays a reasonably sound history, it’s also accompanied by a supply marked with a black arrow at 1.3131-1.3093, along with the RSI indicator testing its overbought value. What’s also notable from a technical perspective is daily structure. Trend line support-turned resistance (taken from the low 1.2661) merges closely with 1.31.
While 1.31 appears attractive for shorts according to H4 and daily structure, weekly price continues to sculpt a range between demand at 1.2589-1.2814 and a supply drawn from 1.3472-1.3204. Of late, the market tested the lower limit of this consolidation and responded in reasonably strong fashion. This places a question mark on 1.31 as a sell level since the weekly timeframe could be heading for the top edge of its range: supply at 1.3472-1.3204 – in other words the 1.32 handle!
Areas of consideration:
Though weekly price suggests the pair may extend beyond 1.31, a bounce from this region is still promising in view of its surrounding confluence. To be on the safe side, however, waiting for additional candlestick confirmation to form is an option (entry/stop parameters can be defined by the candlestick structure). In terms of targets, the first port of call is October’s opening level at 1.3031, though price could turn higher ahead of this barrier as weekly buyers are in play (highlighted above). As a result, constant monitoring of the position is recommended.
The US election’s outcome is likely to affect the pound’s movement, though to a lesser extent than the EUR/USD.
Today’s data points: US congressional election results.
AUD/USD:
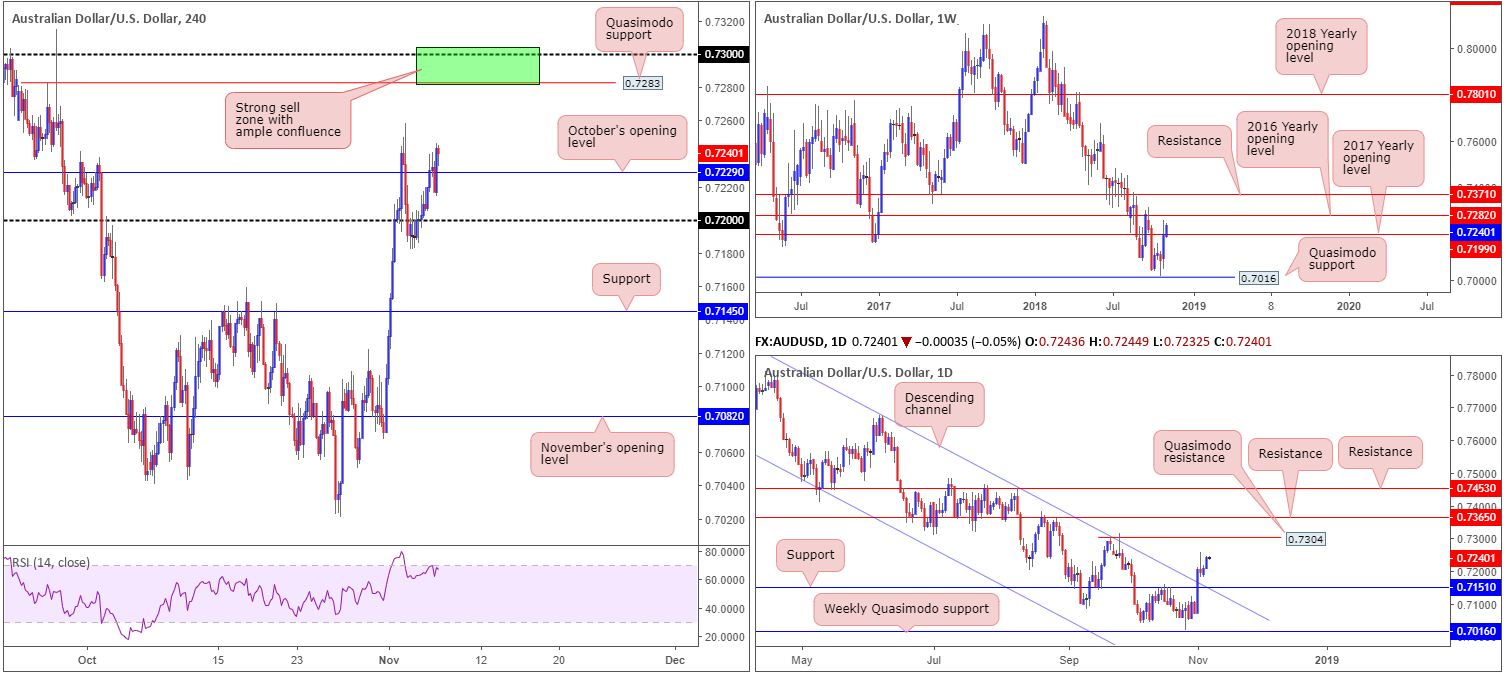
In recent sessions, the commodity currency received fresh impetus on the back of a hawkish RBA. The Aussie central bank left interest rates unchanged at 1.5%, as anticipated, though policymakers emphasized confidence on growth, inflation and employment.
Maintaining a solid presence above its 0.72 handle, H4 movement went on to overthrow October’s opening level at 0.7229. This draws the spotlight towards Friday’s high 0.7258 as the next upside hurdle, followed closely by a Quasimodo resistance at 0.7283 and the 0.73 handle.
The reason behind shading the area between 0.7304/0.7282 in green on the H4 timeframe is due to it likely acting as a sell zone. Besides the H4 structure mentioned above, having the 2016 yearly opening level at 0.7282 positioned nearby (weekly timeframe), and a daily Quasimodo resistance sited directly above 0.73 at 0.7304, adds considerable weight, according to our technical reading.
Areas of consideration:
For those looking to engage with 0.7304/0.7282, aggressive traders may simply enter short at 0.7282 and position stops above 0.7304. For conservative traders, fearful of a fakeout being seen above 0.73, waiting for additional candle confirmation is an alternative (entry/stop parameters can be defined by the candlestick structure). In terms of take-profit targets, eyes will likely be on 0.7258 (Friday’s high) as possible support, followed then by October’s opening level mentioned above at 0.7229.
Today’s data points: US congressional election results.
USD/JPY:
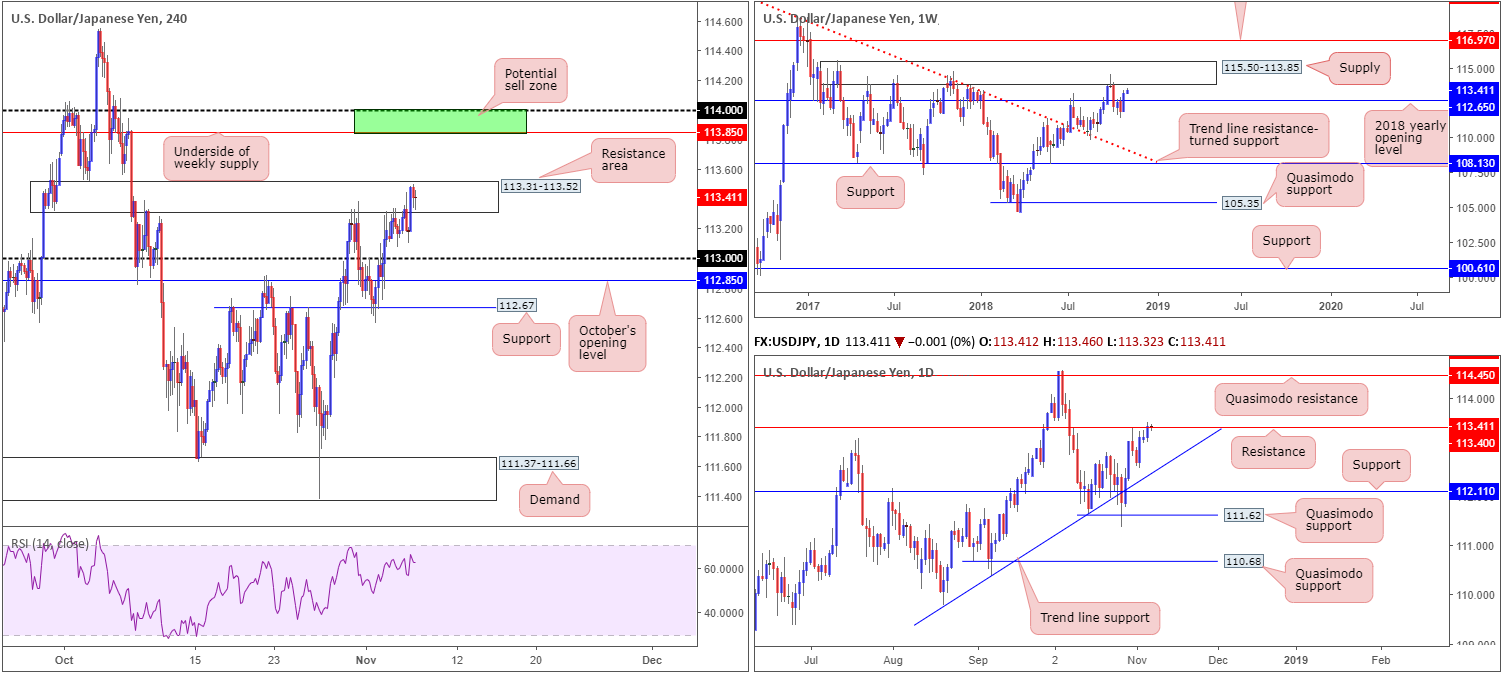
While the US dollar index entered a somewhat subdued state ahead of the US mid-term elections Tuesday, the USD/JPY market continued to explore higher ground, up 0.20% on the day.
This has brought weekly action within close proximity of supply at 115.50-113.85. Note this supply has incredibly strong history. The key observation on the daily timeframe, however, remains around the resistance at 113.40, which appears fragile at the moment. A break of this level has a reasonably clear run towards Quasimodo resistance at 114.45 (sited within the weekly supply), whereas a rejection could target trend line support (etched from the low 109.77).
In terms of Tuesday’s action on the H4 scale, the market continues to engage with a resistance area at 113.31-113.52. Given this H4 zone houses the daily resistance at 113.40, weekly buyers likely have their work cut out for them should they wish to challenge weekly supply at 115.50-113.85.
Areas of consideration:
In effect, we have weekly price indicating a move north may be on the cards, while both H4 and daily structure suggest a move lower. At current price, this makes it difficult to decipher direction.
In view of this, the only area that stands out this morning is the H4 green zone marked between the underside of weekly supply at 113.85 and the round number 114 for potential shorts. A H4 bearish candlestick pattern printed from within here is a high-probability short in terms of the overall market picture (entry/stop parameters can be defined by the candlestick structure). Granted, to reach this area, daily resistance at 113.40 will have to be taken out, though do keep in mind weekly action generally takes precedence over daily flow. The first take-profit target from 114/113.85 falls in around 113.31-113.52.
Today’s data points: US congressional election results.
USD/CAD:
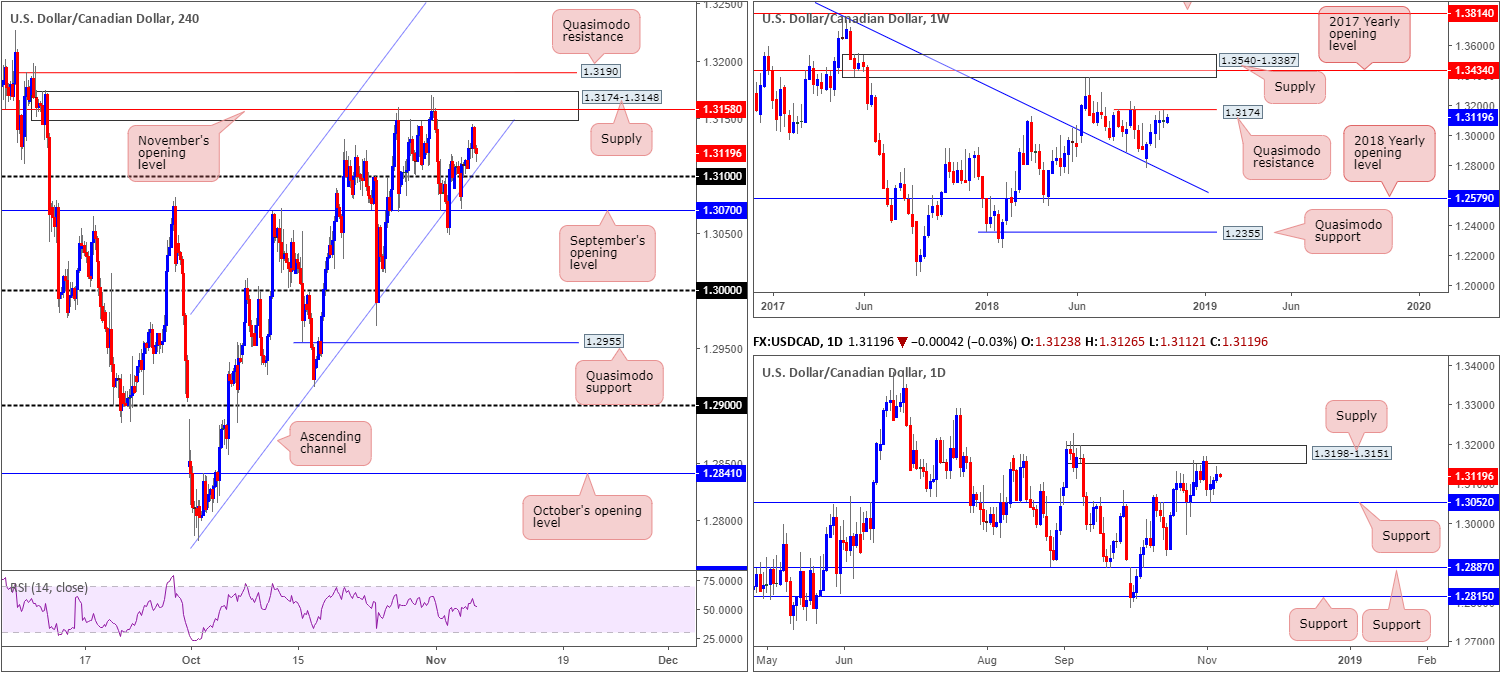
In spite of the USD/CAD registering mild gains Tuesday, technical structure remains unchanged. As a result, much of the following piece will echo thoughts put forward in Tuesday’s report.
As you can see, H4 flow remains supportive above its 1.31 handle/channel support (extended from the low 1.2802), and came within a stone’s throw away from connecting with supply at 1.3174-1.3148, which happens to encase November’s opening level at 1.3158 and is positioned just south of a Quasimodo resistance level at 1.3190.
Higher up on the curve, weekly price is seen meandering beneath Quasimodo resistance plotted at 1.3174. Daily flow, on the other hand, is sandwiched between supply drawn from 1.3198-1.3151 and support coming in at 1.3052.
Areas of consideration:
The H4 supply zone mentioned above at 1.3174-1.3148 and its neighbouring H4 Quasimodo resistance at 1.3190 remain open for possible shorting opportunities today. Not only do we have a weekly Quasimodo resistance at 1.3174 intersecting with the top edge of the H4 supply, there’s also daily supply at 1.3198-1.3151 in view as well (see above).
Irrespective of whether one selects the H4 supply to sell or the H4 Quasimodo, stop-loss order placement above the daily supply edge (1.3198) appears a logical option, though do try to include the 1.32 handle here as well. In terms of take-profit targets, the aforementioned H4 channel support is a reasonable first step.
Today’s data points: US congressional election results.
USD/CHF:
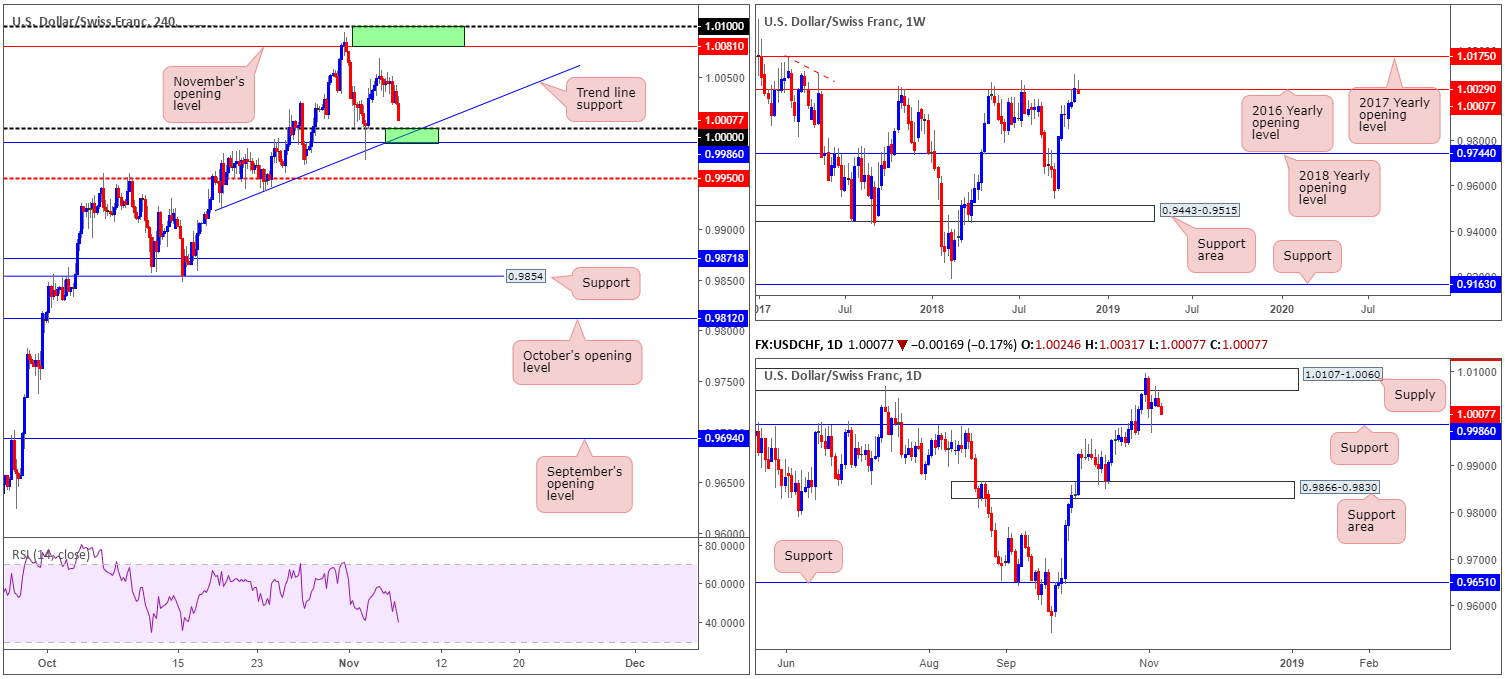
Leaving November’s opening level at 1.0081 unchallenged, the USD/CHF retreated to lower ground Tuesday, currently eyeing a test of parity (1.0000). Bolstered by a nearby trend line support surfacing below it (extended from the low 0.9920), and a daily support level at 0.9986 (lower green area), a bounce higher from 1.0000 is possible.
Why only a bounce comes down to where we’re coming from on the weekly timeframe: the 2016 yearly opening level at 1.0029. Note this level boasts incredibly strong history. In 2017 the base held price lower on two occasions and twice already in 2018. Therefore, a move lower from here should not come as much of a surprise.
Areas of consideration:
Although weekly price portends lower prices, a bounce from the 1.0000 area is likely. When attempting to trade against weekly flow, though, as you would be by entering long off 1.0000, waiting for additional candlestick confirmation is advised. Aside from providing entry/stop parameters, it shows bullish intent resides around the region. As for the first take-profit target, eyes will likely be on Monday’s high 1.0069.
A break beneath daily support, on the other hand, has the mid-level barrier on the H4 timeframe at 0.9950 to target.
Today’s data points: US congressional election results.
Dow Jones Industrial Average:
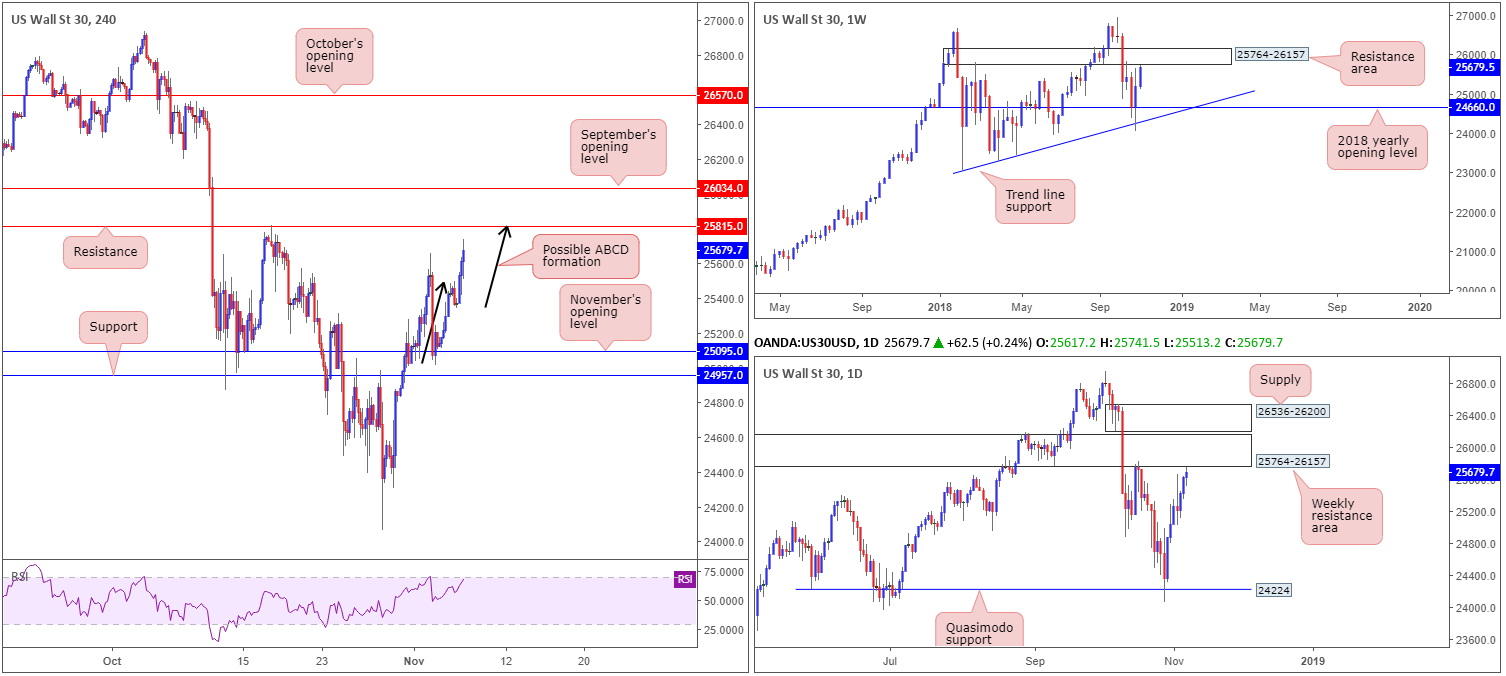
As US Congressional elections get underway, US equities printed reasonably strong gains Tuesday, up 0.77% on the day. This has positioned the H4 candles within close proximity to resistance at 25815 by way of a potential ABCD approach (see black arrows). Also worth noting in this case is the RSI indicator is currently seen hovering just south of its overbought value.
As underscored in Tuesday’s briefing, 25815 is an interesting level given the barrier is located within the lower limits of a weekly resistance zone at 25764-26157. As you can imagine, this adds considerable weight to the H4 base as a viable sell zone.
Areas of consideration:
The H4 resistance at 25815 remains a key level. In view of its connection with higher-timeframe structure, a short from here is high probability. To help avoid the possibility of a fakeout above 25815, though, waiting for additional candlestick confirmation may be something to consider. Not only will this display bearish intent, it’ll also define entry/stop parameters, as well.
As for take-profit targets, the higher timeframes shows the unit could potentially turn as far south as 24660: the 2018 yearly opening level on the weekly timeframe. Though for intraday support targets, using the 38.2%/61.8% Fib supports from legs A-D of the ABCD formation is an option.
Today’s data points: US congressional election results.
XAU/USD (Gold):
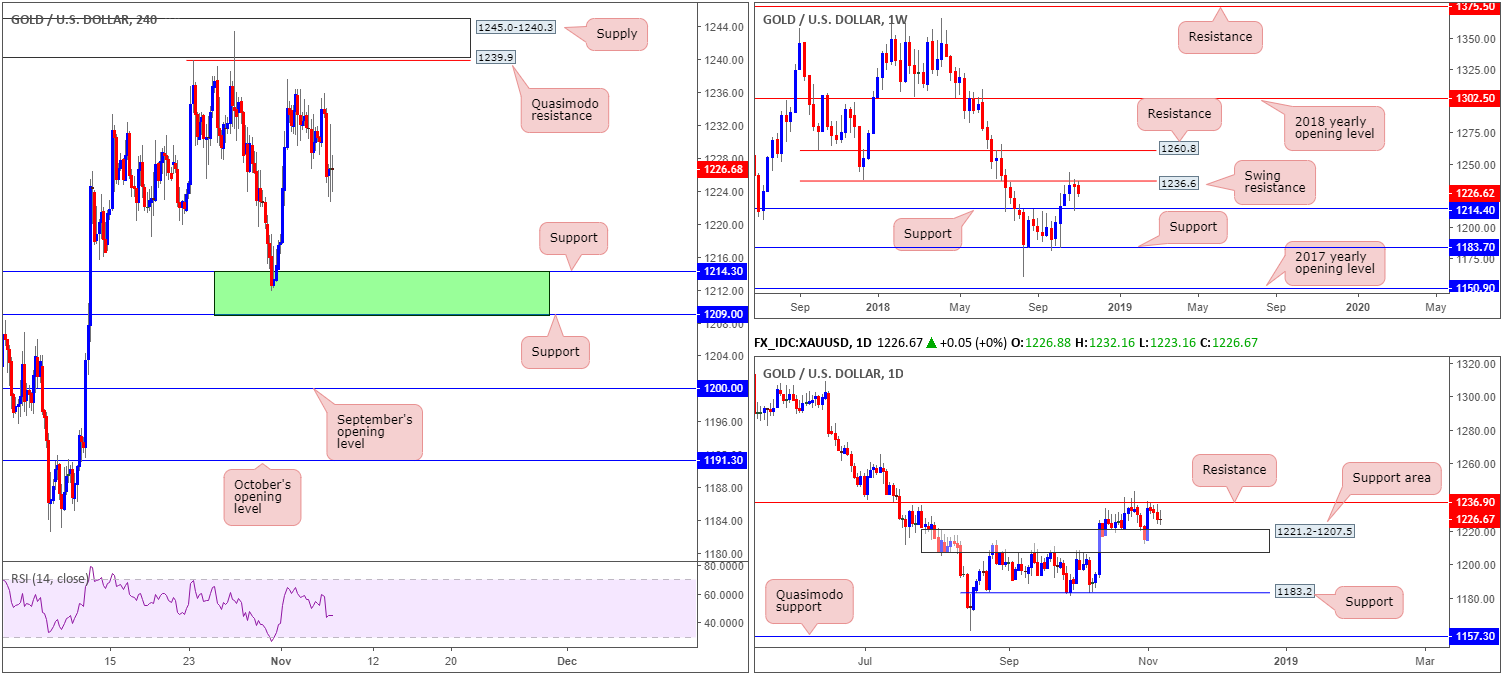
Taking things from the top this morning, gold is seen moving lower off weekly swing resistance at 1236.9, with potential to decline as far south as support resting at 1214.4. A similar scenario is present on the daily timeframe. The yellow metal is seen consolidating between a support area at 1221.2-1207.5 (weekly support resides within this area) and resistance at 1236.9 (positioned a few pips above the weekly swing resistance level).
On the H4 timeframe, our technical reading shows price left the Quasimodo resistance level at 1239.9/supply at 1245.0-1240.3 unchallenged prior to dropping lower. The next support target visible on this scale falls in around 1214.3 (essentially the same as the weekly support base).
Areas of consideration:
With hefty resistance observed on the higher timeframes around the 1236ish neighbourhood, and H4 price displaying room to push lower, all three timeframes suggest further downside may be in the offing.
Unfortunately, there’s limited structure to base a short from on the H4 timeframe. Therefore, focus turns to possible longs out of the green shaded zone on the H4 at 1209.0/1214.3: two H4 supports that have strong connections to higher-timeframe supports (see above).
Aggressive traders looking to enter long at 1214.3 and place stops beneath 1209.0 should remain aware of the possibility of a fakeout into the daily support area, given its lower base is limited by 1207.5. For conservative traders, waiting for additional candle confirmation is an alternative (entry/stop parameters can be defined by the candlestick structure).
The use of the site is agreement that the site is for informational and educational purposes only and does not constitute advice in any form in the furtherance of any trade or trading decisions.
The accuracy, completeness and timeliness of the information contained on this site cannot be guaranteed. IC Markets does not warranty, guarantee or make any representations, or assume any liability with regard to financial results based on the use of the information in the site.
News, views, opinions, recommendations and other information obtained from sources outside of www.icmarkets.com.au, used in this site are believed to be reliable, but we cannot guarantee their accuracy or completeness. All such information is subject to change at any time without notice. IC Markets assumes no responsibility for the content of any linked site. The fact that such links may exist does not indicate approval or endorsement of any material contained on any linked site.
IC Markets is not liable for any harm caused by the transmission, through accessing the services or information on this site, of a computer virus, or other computer code or programming device that might be used to access, delete, damage, disable, disrupt or otherwise impede in any manner, the operation of the site or of any user’s software, hardware, data or property.


