
EUR/USD:
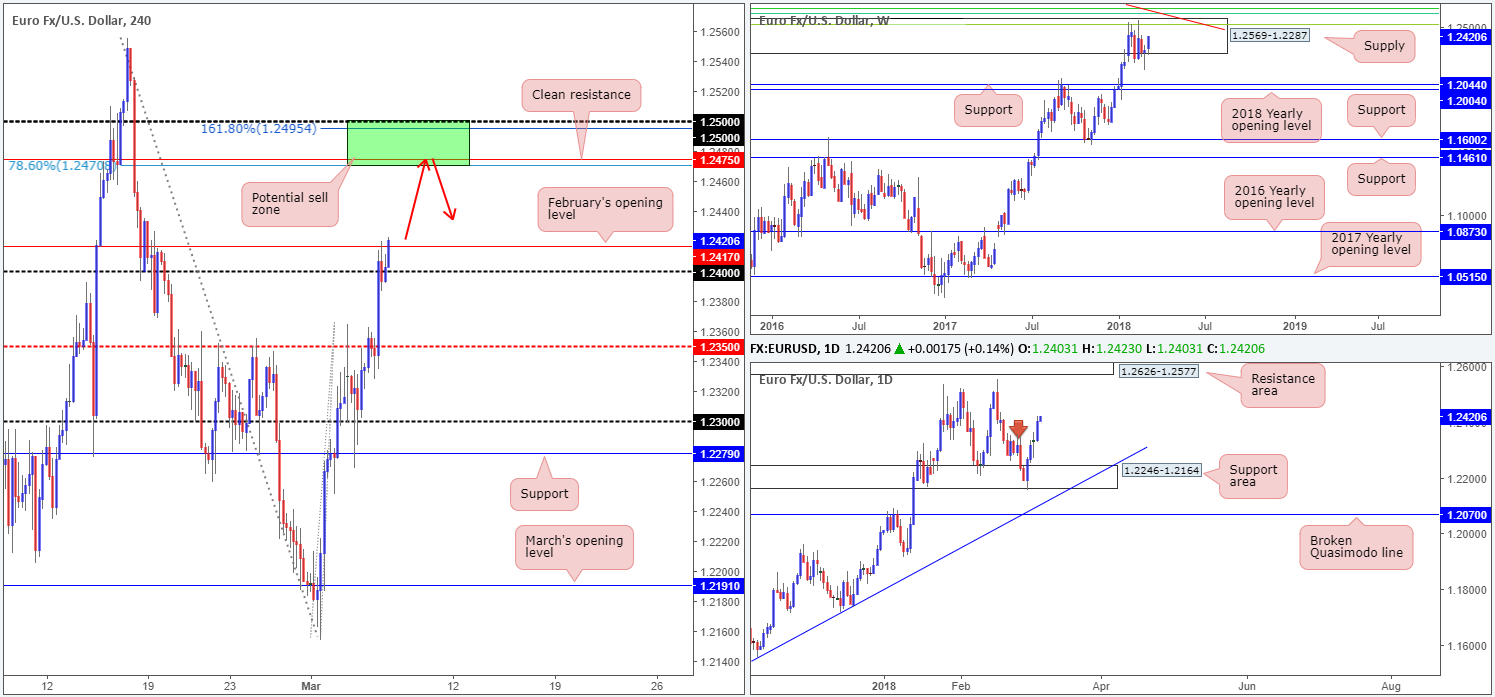
The euro is trading with a reasonably strong bias to the upside this morning, as concerns about trade wars give rise to fears of a structurally weaker dollar. Posting its fourth consecutive daily gain on Tuesday, the pair charged through offers at 1.2350 (a H4 mid-level resistance) and ended the day crossing swords with 1.24/February’s opening level at 1.2417.
The picture over on the higher timeframes shows that weekly movement remains within the limits of a weekly supply at 1.2569-1.2287. To date, this area has managed to cap upside for six consecutive weeks. On the other side of the field, daily price recently chewed through a supply zone marked with a red arrow at 1.2359-1.2282, and now shows room to possibly extend as far north as the daily resistance area at 1.2626-1.2577 (positioned above the current weekly supply).
Potential trading zones:
With H4 price looking as though its wants to tear through February’s opening band at the moment, the main interest above this area is 1.25/1.2470. This is a potential sell zone for the following reasons:
- Located within the current weekly supply area.
- 1.25 handle.
- 161.8% H4 Fib ext. point at 1.2495.
- H4 resistance at 1.2475.
- 78.6% H4 Fib resistance at 1.2470.
Should this area come to fruition today, and depending on the H4 approach, the first take-profit target from this region would be Feb’s open level/1.24.
Data points to consider: FOMC member Bostic speaks at 1pm; US ADP non-farm employment change at 1.15pm; FOMC member Dudley speaks at 1.20pm GMT.
Areas worthy of attention:
Supports: 1.24 handle; 1.2350.
Resistances: 1.25/1.2470; 1.2626-1.2577; 1.2569-1.2287.
GBP/USD:
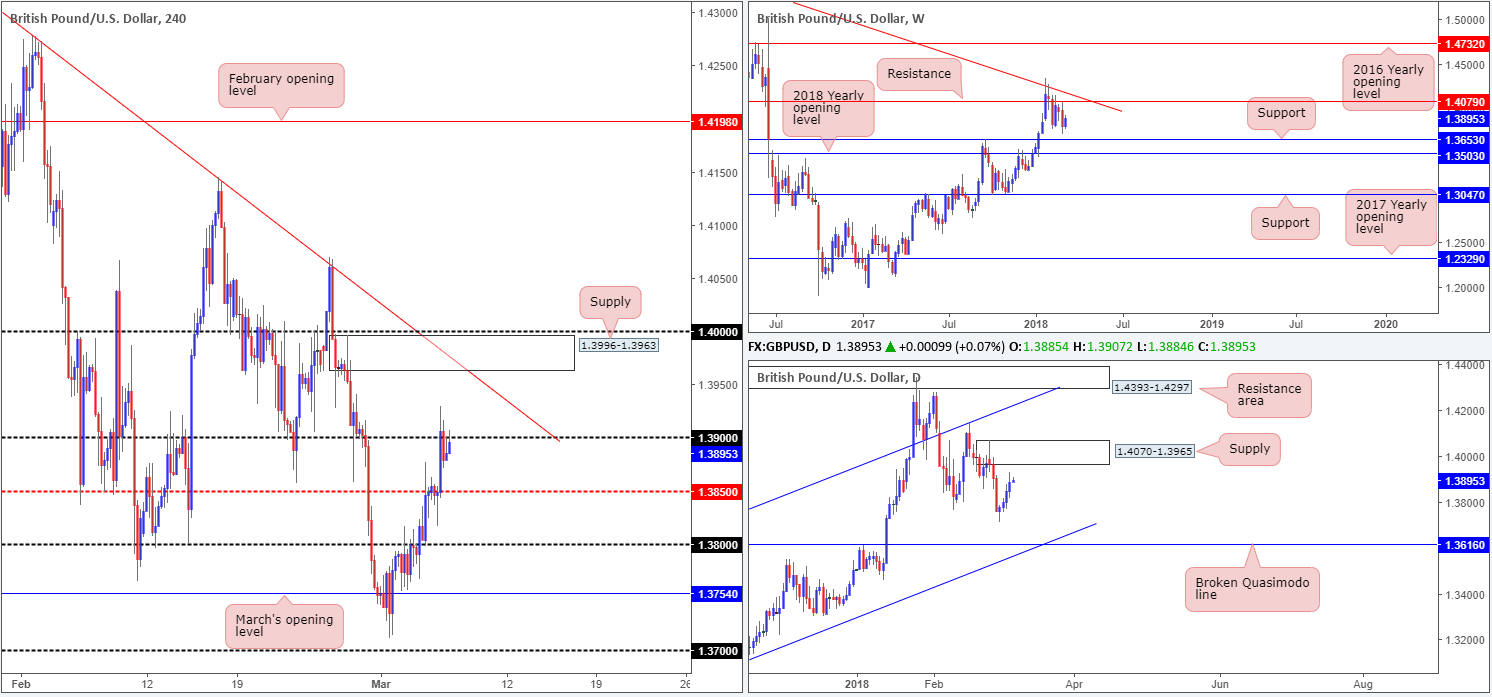
On the back of a weaker US dollar, the British pound climbed higher on Tuesday. Registering its fourth consecutive daily gain, the unit is now on track to connect with daily supply plotted at 1.4070-1.3965. Meanwhile, across on the H4 timeframe, price is seen challenging the 1.39 handle. Stop-loss orders positioned above this number have likely been filled, thus the path north is potentially free to H4 supply at 1.3996-1.3963, shadowed closely by a H4 trendline resistance taken from the high 1.4345 and the large psychological band 1.40.
Potential trading zones:
The H4 supply mentioned above at 1.3996-1.3963 is, at least for us, considered fresh. This – coupled with its surrounding H4 confluence as well as the areas being located within the confines of the noted daily supply – this is certainly an area to keep an eyeball on today, traders.
Waiting for additional candle confirmation in the form of a full or near-full-bodied H4 bearish candle is recommended, as large psychological levels such as 1.40 are prone to fakeouts. The first take-profit target, assuming the H4 approach is relatively smooth, would be around the 1.39 neighborhood.
Data points to consider: FOMC member Bostic speaks at 1pm; US ADP non-farm employment change at 1.15pm; FOMC member Dudley speaks at 1.20pm GMT.
Areas worthy of attention:
Supports: 1.3850.
Resistances: 1.39/40 handle; 1.3996-1.3963; H4 trendline resistance; 1.4070-1.3965.
AUD/USD:
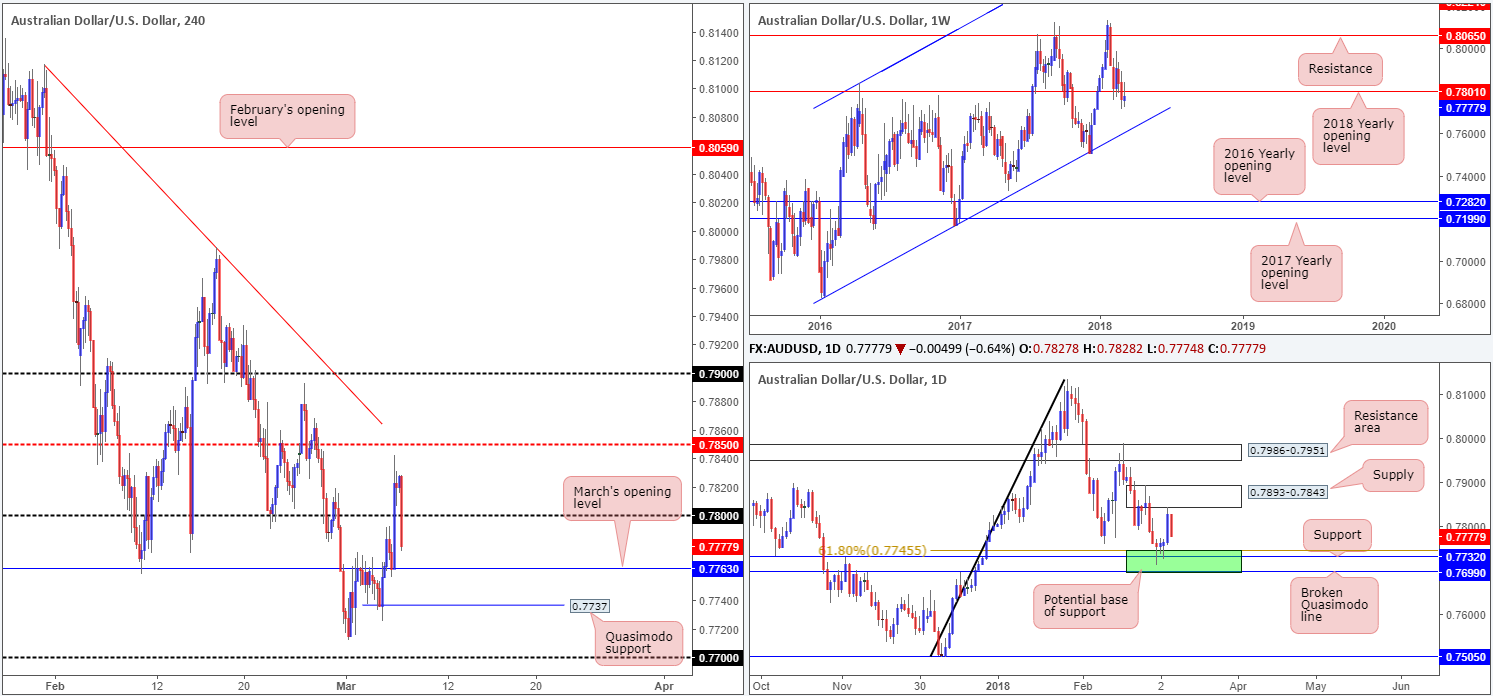
The commodity currency followed the majority of the market on Tuesday, trading higher against its US counterpart. RBA Governor Lowe’s speech offered little insight, with traders now likely poised for upcoming Australian GDP data.
Weekly movement, as you can see, is currently holding beneath the 2018 yearly opening level at 0.7801. Continued selling from this point could potentially see the unit shake hands with a weekly channel support taken from the low 0.6827. A little lower on the curve, we can see that daily price recently came within an inch of connecting with daily supply positioned at 0.7893-0.7843. The selloff thus far has been reasonably abrupt and has the daily support area marked in green at 0.7699/0.7745 to target. In recent hours, H4 price reclaimed the 0.78 handle and is now poised to challenge March’s opening level seen at 0.7763. Beyond this point – apart from a H4 Quasimodo support noted at 0.7737 – we do not see much stopping the piece from reaching the 0.77 neighborhood on this scale.
Potential trading zones:
With high-impacting Australian data just around the corner, it would be chancy to attempt a trade in this market based on technicals. Nevertheless, do keep an eye on the noted higher-timeframe levels during the event (marked in bold).
Data points to consider: AUD GDP q/q at 12.30am; FOMC member Bostic speaks at 1pm; US ADP non-farm employment change at 1.15pm; FOMC member Dudley speaks at 1.20pm GMT.
Areas worthy of attention:
Supports: 0.7699/0.7745; weekly channel support; 0.7763; 0.7737; 0.77 handle.
Resistances: 0.78 handle; 0.7801; 0.7893-0.7843.
USD/JPY:
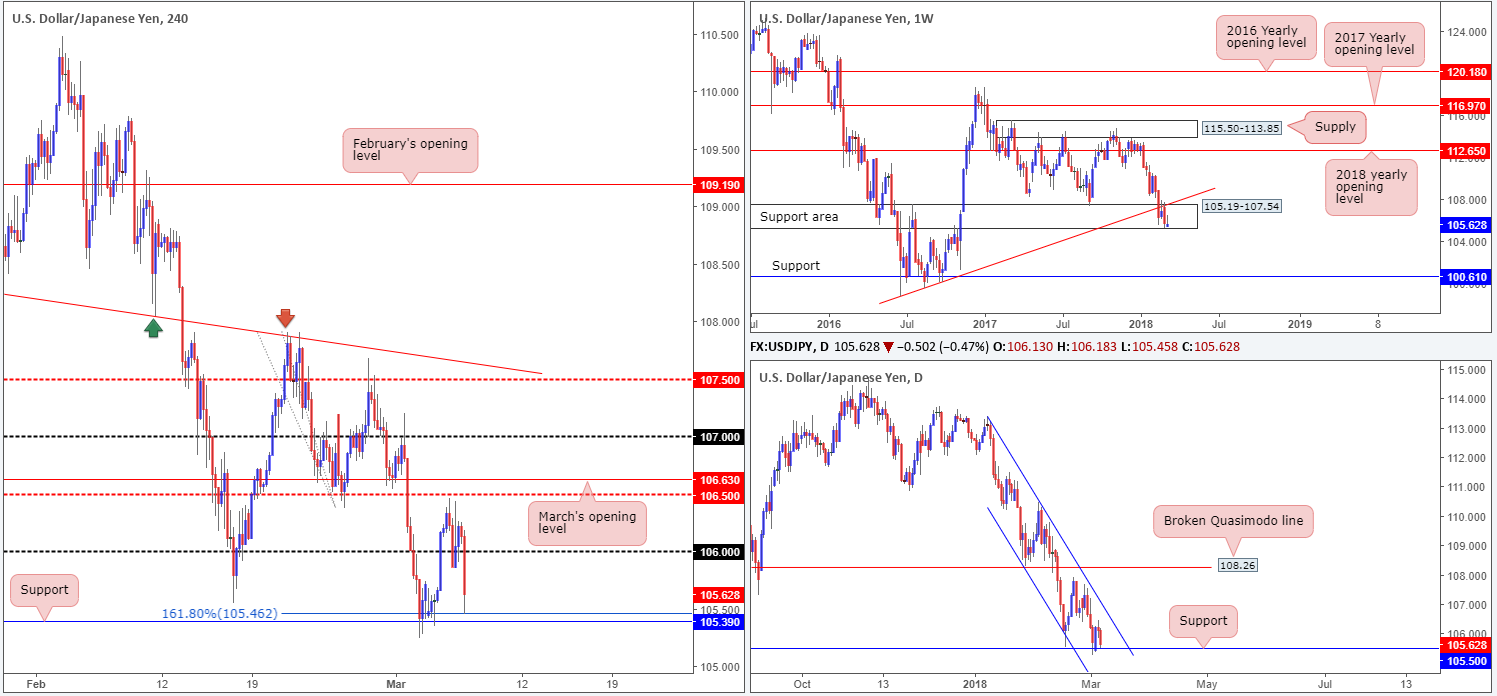
The USD/JPY ended Tuesday’s segment relatively unchanged, following a failed attempt at breaching the 106 handle. Shortly into Asia hours, however, the pair had the floor pulled from beneath it and aggressively plunged lower, taking out the 106 handle and testing the 161.8% H4 Fib ext. at 105.46/H4 support at 105.39. This abrupt selloff was triggered amid fears that Mr. Cohn, President Trump’s top economic advisor, plans to resign. Cohn is said to believe in free trade and argued that the tariffs proposal could put US economic growth in peril.
A mild recovery is currently being seen, which could have something to do with the fact that there are additional higher-timeframe support structures in play. On the weekly picture, we have price trading within the lower limits of a weekly support area coming in at 105.19-107.54. Daily action also shows a support level in the mix at 105.50. It might also be worth noting on this scale that the pair has been entrenched within a daily descending channel formation since the beginning of the year (113.38/108.28).
Potential trading zones:
Although current structure indicates that support is clearly in the mix at the moment, the most we see the pair advancing to is the 106 handle. Downside pressure is just too strong at the moment, in our view. The current weekly support area, while considered a major-league zone, has failed to drive higher – upside has been capped by a weekly trendline support-turned resistance taken from the low 98.78, which is a red flag. Further adding to this, daily price printed a reaction from the aforementioned daily support on Monday, but only managed to print a ONE day gain!
Therefore, from our perspective, this market may be best left on the back burner until it offers something more concrete.
Data points to consider: FOMC member Bostic speaks at 1pm; US ADP non-farm employment change at 1.15pm; FOMC member Dudley speaks at 1.20pm GMT.
Areas worthy of attention:
Supports: 105.39; 105.46; 105.50; 105.19-107.54.
Resistances: 106.50; 106 handle.
USD/CAD:
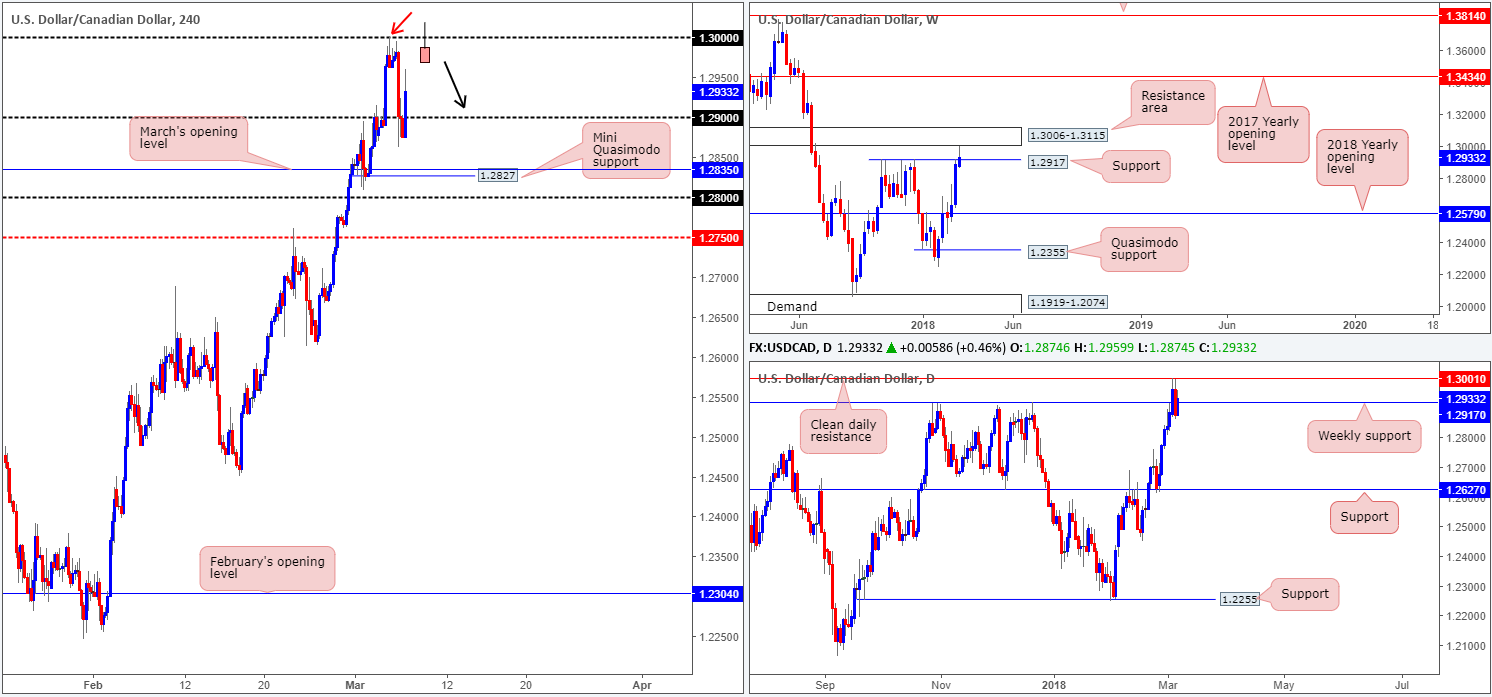
For those who read Tuesday’s morning report you may recall that the team highlighted a possible sell point from the 1.30 handle on the USD/CAD. The initial H4 reaction candle, marked with a red arrow, was, alongside weekly price coming within a few pips of connecting with a weekly resistance area at 1.3006-1.3115, clearly enough to entice traders into the market. Well done to any of our readers who managed to jump aboard this move.
Moving forward, we can see that H4 price failed to sustain its downside pressure sub 1.29 and is now seen trading nearby the mid-level point 1.2950. Weekly price remains above weekly support at 1.2917, but continues to be threatened by the aforementioned weekly resistance area. Daily movement, on the other hand, shows a beautiful daily resistance level pegged at 1.3001. This – coupled with the weekly resistance area – may be enough to halt further buying and eventually push for lower prices.
Potential trading zones:
A retest of 1.30 would be interesting. However, this time, one would need to be prepared for the possibility that a fakeout through this number is likely to be seen, since sellers could very well be weakened here. A clear-cut bearish H4 pin bar printed through this level would likely be sufficient confirmation that a selloff could be on the cards (see chart). Should this come to fruition, traders’ crosshairs will then likely be positioned around the 1.29 handle as an initial take-profit area.
Data points to consider: FOMC member Bostic speaks at 1pm; US ADP non-farm employment change at 1.15pm; FOMC member Dudley speaks at 1.20pm; CAD trade balance and labor productivity q/q at 1.30pm; BoC rate statement and overnight interest-rate decision at 3pm; Crude oil inventories at 3.30pm GMT.
Areas worthy of attention:
Supports: 1.29 handle; 1.2917.
Resistances: 1.30 handle; 1.3006-1.3115; 1.3001.
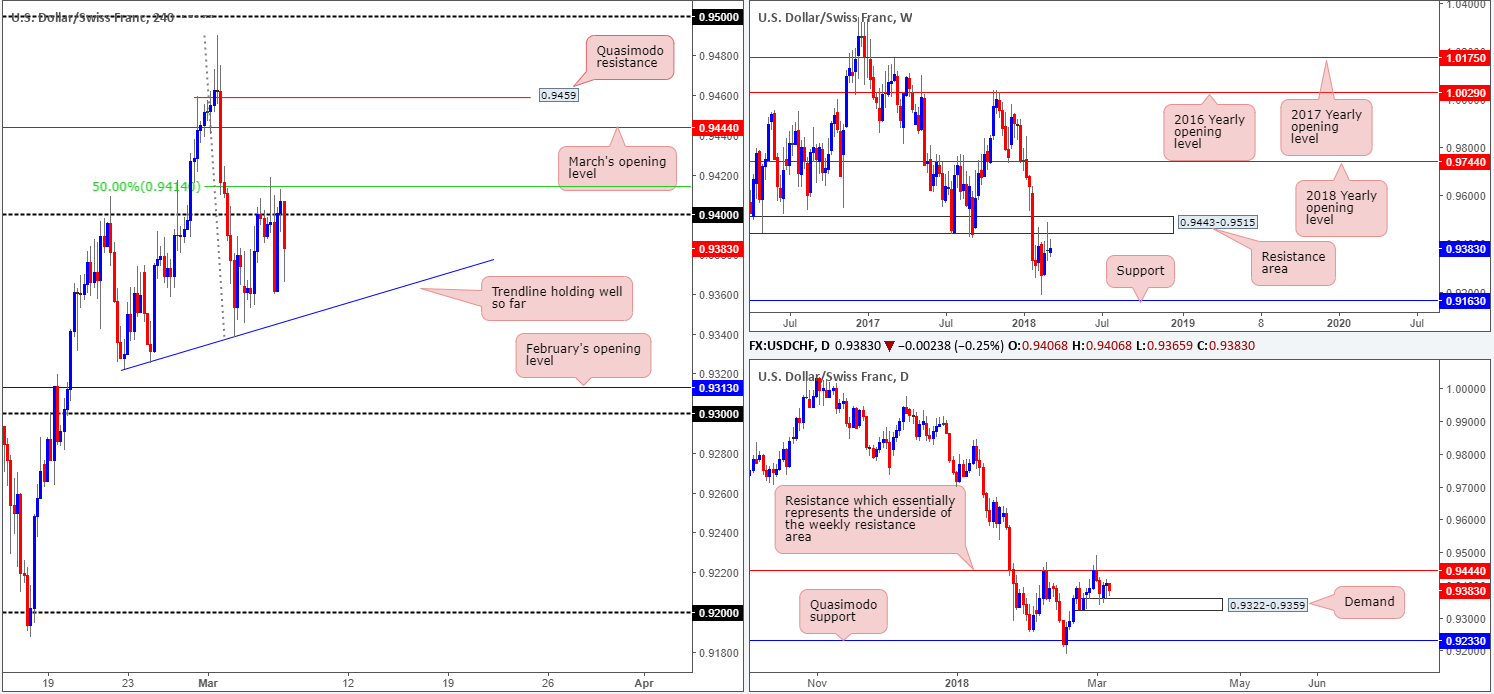
USD/CHF:
Having seen the weekly resistance area at 0.9443-0.9515 hold firm on a number of occasions as support in the past, it is not really a surprise to see the pair respecting the underside of this zone as resistance. Further decline from here could bring the unit down as far south as weekly support marked at 0.9163. The flip side to this, however, is that daily price is currently seen defending a daily demand at 0.9322-0.9359, which could call for a retest of 0.9444: a daily resistance level that essentially represents the underside of the current weekly resistance area.
Over on the H4 timeframe, nonetheless, the 0.94 handle, despite experiencing multiple upside breaches on Tuesday, has remained in the fray (likely thanks to a nearby 50.0% resistance value at 0.9414). The next port of call seen below here comes in the form of a H4 trendline support extended from the low 0.9322. Beyond this line, we have February’s opening level at 0.9313, shadowed closely by the 0.93 handle, on the radar.
Potential trading zones:
Without setups boasting strong confluence, this is a difficult market to trade, in our humble view. Also of note is that a long would have you going up against H4 and weekly selling pressure, whereas short positions places one against possible daily flow from the current demand!
The market is just too restricted for our liking right now, and is therefore a flat market, in our humble view.
Data points to consider: FOMC member Bostic speaks at 1pm; US ADP non-farm employment change at 1.15pm; FOMC member Dudley speaks at 1.20pm GMT.
Areas worthy of attention:
Supports: 0.93 handle; 0.9313; H4 trendline support; 0.9322-0.9359; 0.9163.
Resistances: 0.94 handle; 0.9414; 0.9444; 0.9443-0.9515.
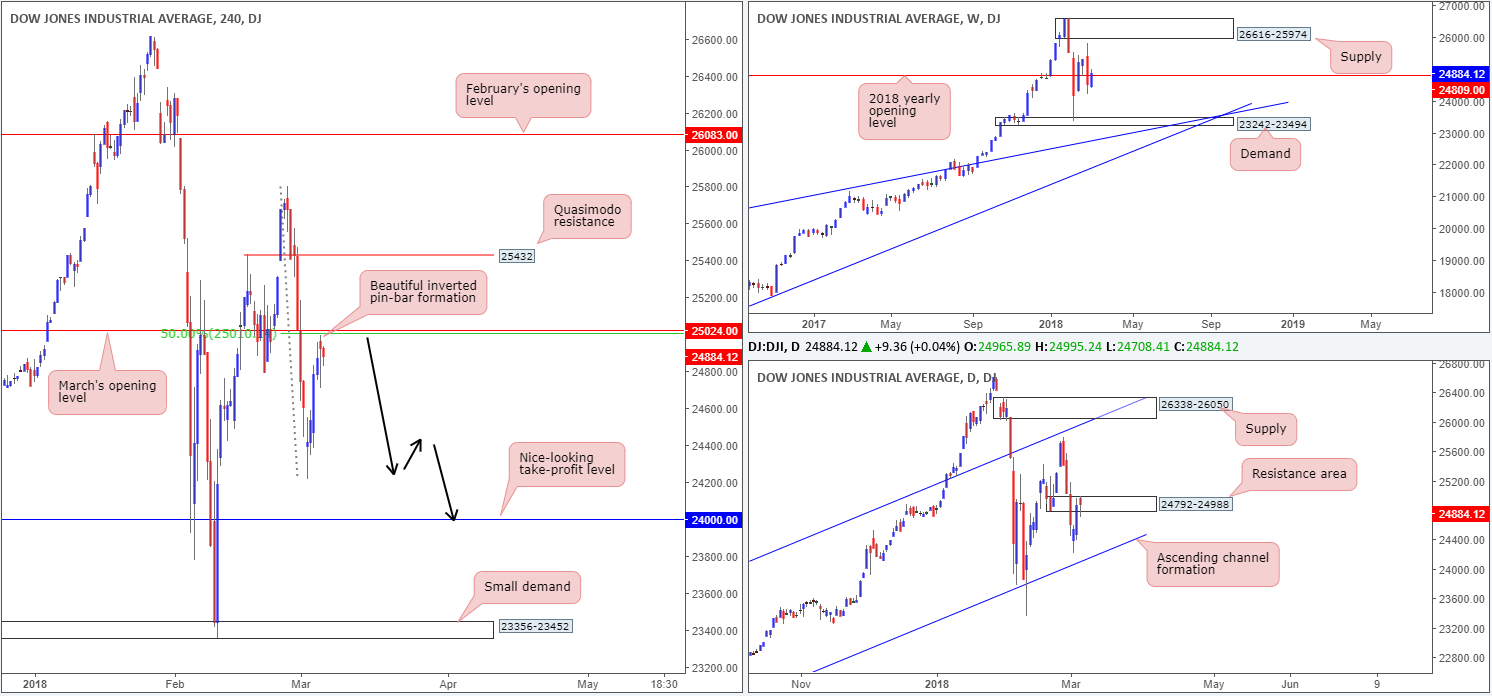
DOW 30:
As you can see from the charts this morning, an upbeat risk tone couldn’t spur US equities on Tuesday, despite opening the session higher. Perhaps equity traders are cognizant of the risks related to possible steel/aluminium tariffs.
From a technical standpoint, H4 price is seen trading within a stone’s throw away from March’s opening level at 25024 and a 50.0% resistance value at 25010. These levels are further reinforced given their position within a daily resistance area printed at 24792-24988. This – alongside the nearby 2018 yearly opening level at 24809 – makes for a potentially strong base of collective resistance.
Potential trading zones:
We really like how H4 candle action has printed a H4 inverted pin-bar formation ahead of the noted H4 resistances. This, through the lens of a simple technical trader, is a high-probability sell, with an ultimate take-profit target sited at the 24k mark/the daily channel support extended from the low 17883.
Data points to consider: FOMC member Bostic speaks at 1pm; US ADP non-farm employment change at 1.15pm; FOMC member Dudley speaks at 1.20pm GMT.
Areas worthy of attention:
Supports: 24000; daily channel support.
Resistances: 25024; 24792-24988; 24809.
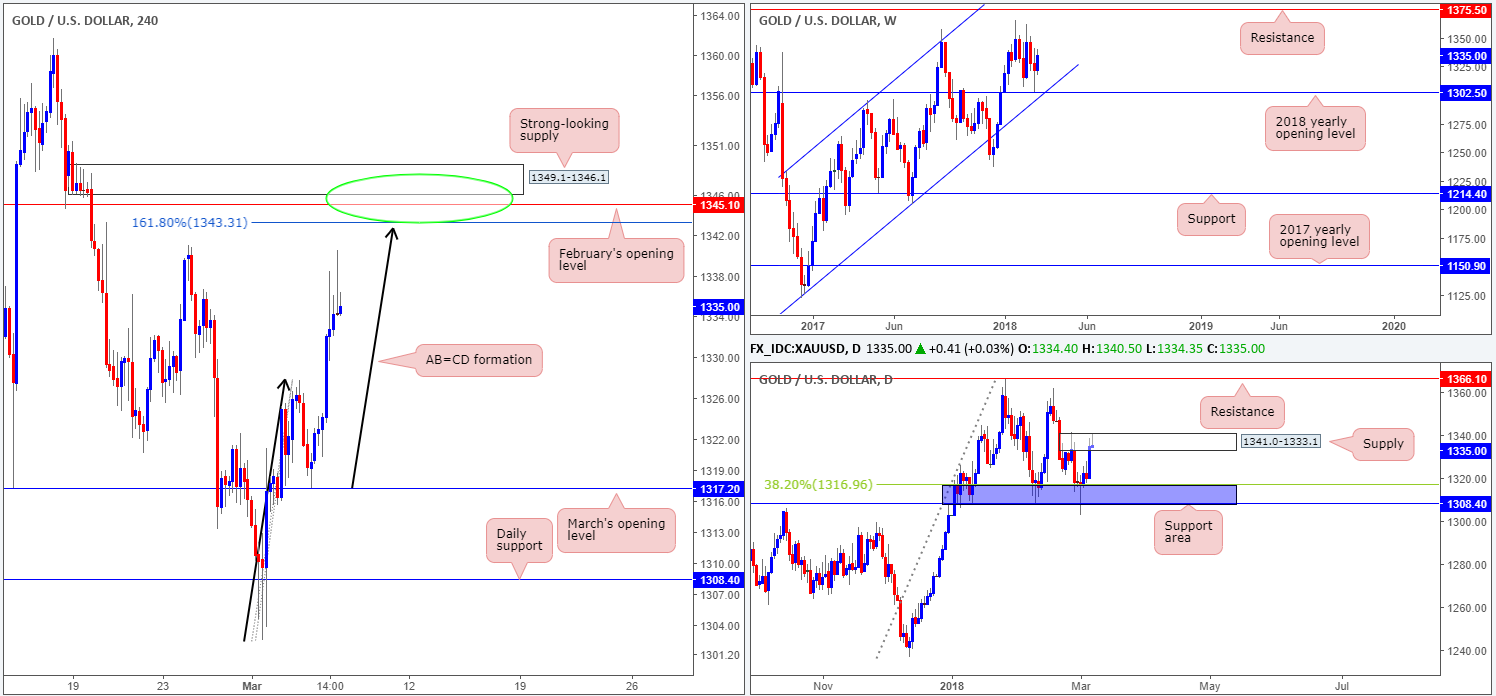
GOLD:
XAU/USD bulls went on the offensive on Tuesday as the US dollar waned.
In recent hours, we’ve seen H4 price mildly pare gains from the 26/02 high 1341.0 and print a strong-looking H4 selling wick (based on candlestick analysis this is considered a sell signal). This is likely influenced by the fact that daily price is seen trading within the walls of a supply zone coming in at 1341.0-1333.1. However, a little higher on the curve, we can see that weekly action, after touching gloves with the 2018 yearly opening level at 1302.5, is looking firm. The next upside target on this scale does not come into view until we reach resistance pegged at 1375.0.
Potential trading zones:
As we hope is demonstrated on the H4 timeframe, there is a potential AB=CD approach forming (see black arrows) that terminates at the 161.8% Fib ext. point drawn from 1343.3. A few pips above this level sits February’s opening level at 1345.1, followed closely by a robust H4 supply base penciled in at 1349.1-1346.1 (green circle).
Although the above noted area is positioned slightly above the current daily supply area, and also against weekly direction, there’s still a healthy chance that we could see a bounce materialize from here, judging by its surrounding H4 structures. Is it enough to consider placing pending orders? No! Remember, we have limited higher-timeframe confirmation here! Therefore, waiting for a full or near-full-bodied H4 bearish candle to form within the noted H4 zone would, in our book, be a far better approach before pulling the trigger.
In regard to take-profit targets it is a little difficult to judge when the approach has yet to complete. Ultimately, though, the team has highlighted March’s opening level at 1317.2 (situated directly above the current daily support area) as the final take-profit base.
Areas worthy of attention:
Supports: 1317.2; 1308.4/1316.9; 1302.5.
Resistances: 1349.1-1346.1; 1345.1; 1343.3; 1341.0-1333.1; 1375.5.
This site has been designed for informational and educational purposes only and does not constitute an offer to sell nor a solicitation of an offer to buy any products which may be referenced upon the site. The services and information provided through this site are for personal, non-commercial, educational use and display. IC Markets does not provide personal trading advice through this site and does not represent that the products or services discussed are suitable for any trader. Traders are advised not to rely on any information contained in the site in the process of making a fully informed decision.
This site may include market analysis. All ideas, opinions, and/or forecasts, expressed or implied herein, information, charts or examples contained in the lessons, are for informational and educational purposes only and should not be construed as a recommendation to invest, trade, and/or speculate in the markets. Any trades, and/or speculations made in light of the ideas, opinions, and/or forecasts, expressed or implied herein, are committed at your own risk, financial or otherwise.
The use of the site is agreement that the site is for informational and educational purposes only and does not constitute advice in any form in the furtherance of any trade or trading decisions.
The accuracy, completeness and timeliness of the information contained on this site cannot be guaranteed. IC Markets does not warranty, guarantee or make any representations, or assume any liability with regard to financial results based on the use of the information in the site.
News, views, opinions, recommendations and other information obtained from sources outside of www.icmarkets.com.au, used in this site are believed to be reliable, but we cannot guarantee their accuracy or completeness. All such information is subject to change at any time without notice. IC Markets assumes no responsibility for the content of any linked site. The fact that such links may exist does not indicate approval or endorsement of any material contained on any linked site.
IC Markets is not liable for any harm caused by the transmission, through accessing the services or information on this site, of a computer virus, or other computer code or programming device that might be used to access, delete, damage, disable, disrupt or otherwise impede in any manner, the operation of the site or of any user’s software, hardware, data or property.


