
DXY:
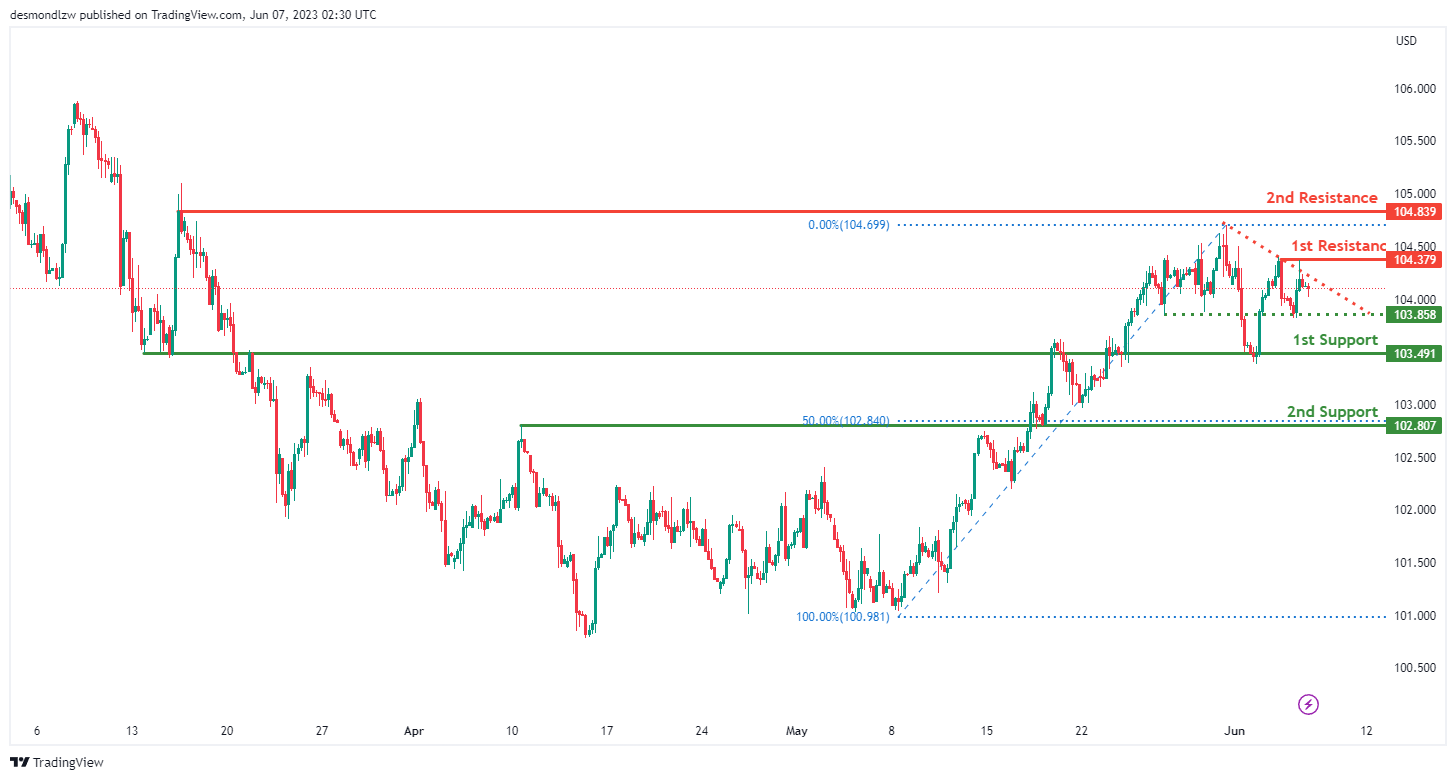
The DXY (Dollar Index) chart currently shows bearish momentum as the price is below a major descending trend line. This suggests a potential continuation of the bearish trend.
Considering this momentum, there is a possibility that the price could continue its bearish movement towards the first support level at 103.49. This level is identified as an overlap support.
The second support level at 102.80 is also an overlap support and aligns with the 50% Fibonacci retracement, further enhancing its significance.
On the other hand, the first resistance at 104.37 is recognized as a multi-swing high resistance, while the second resistance at 104.83 is identified as a swing high resistance.
EUR/USD:
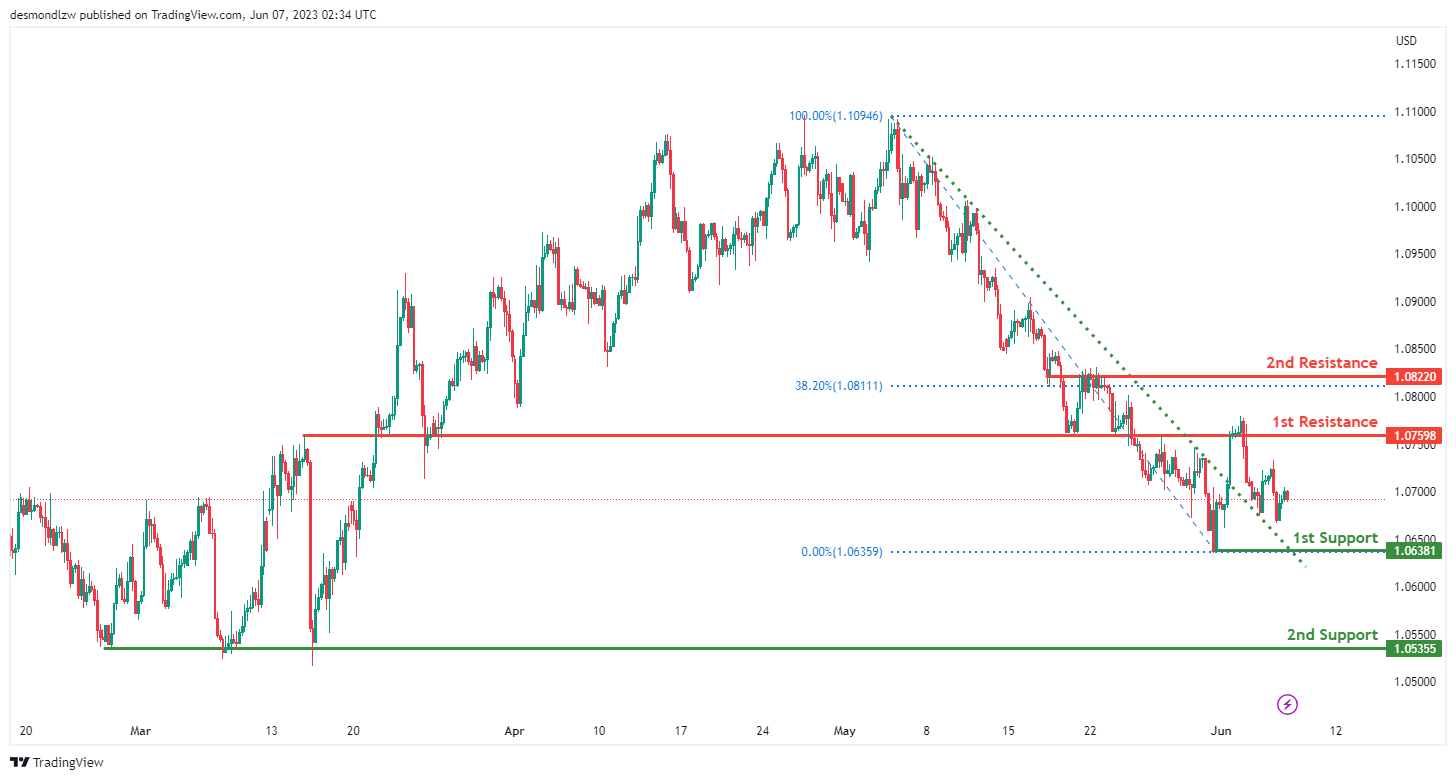
The EUR/USD chart currently shows bullish momentum as the price has broken above a descending resistance line, indicating a potential bullish move.
Considering this momentum, there is a possibility that the price could continue its bullish trend towards the first resistance level at 1.0759. This level is identified as a multi-swing high resistance.
The first support level at 1.0638 is recognized as an overlap support, while the second support level at 1.0535 is a multi-swing low support.
Additionally, the second resistance level at 1.0822 is an overlap resistance and coincides with the 38.20% Fibonacci retracement, further adding to its significance.
GBP/USD:
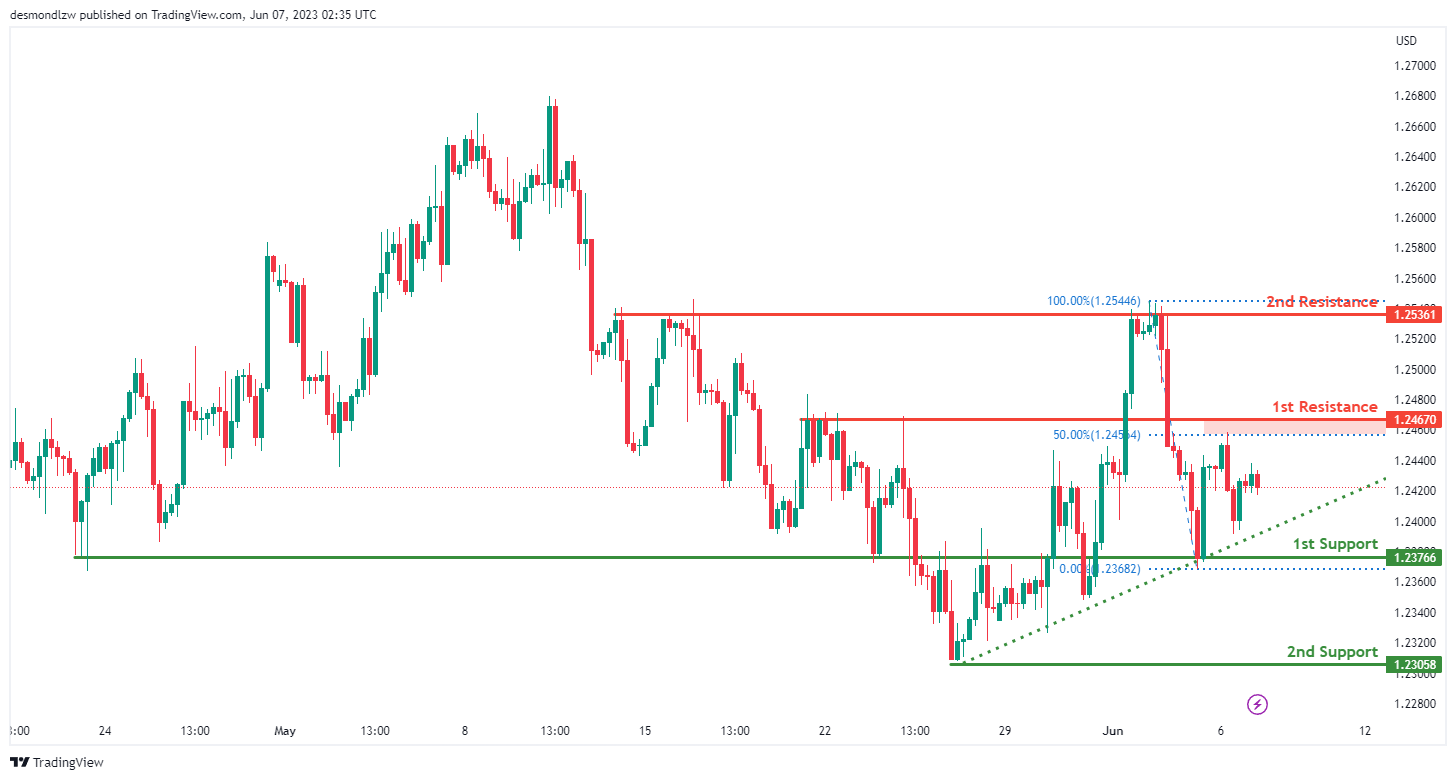
The GBP/USD chart currently demonstrates bullish momentum as the price is above a major ascending trend line, indicating the potential for further upward movement.
Considering this momentum, there is a possibility that the price could continue its bullish trend towards the first resistance level at 1.2467. This level is identified as an overlap resistance and is supported by the 50% Fibonacci retracement.
The first support level at 1.2376 is recognized as an overlap support, while the second support level at 1.2305 is a swing low support.
Additionally, the second resistance level at 1.2536 is a multi-swing high resistance.
USD/CHF:
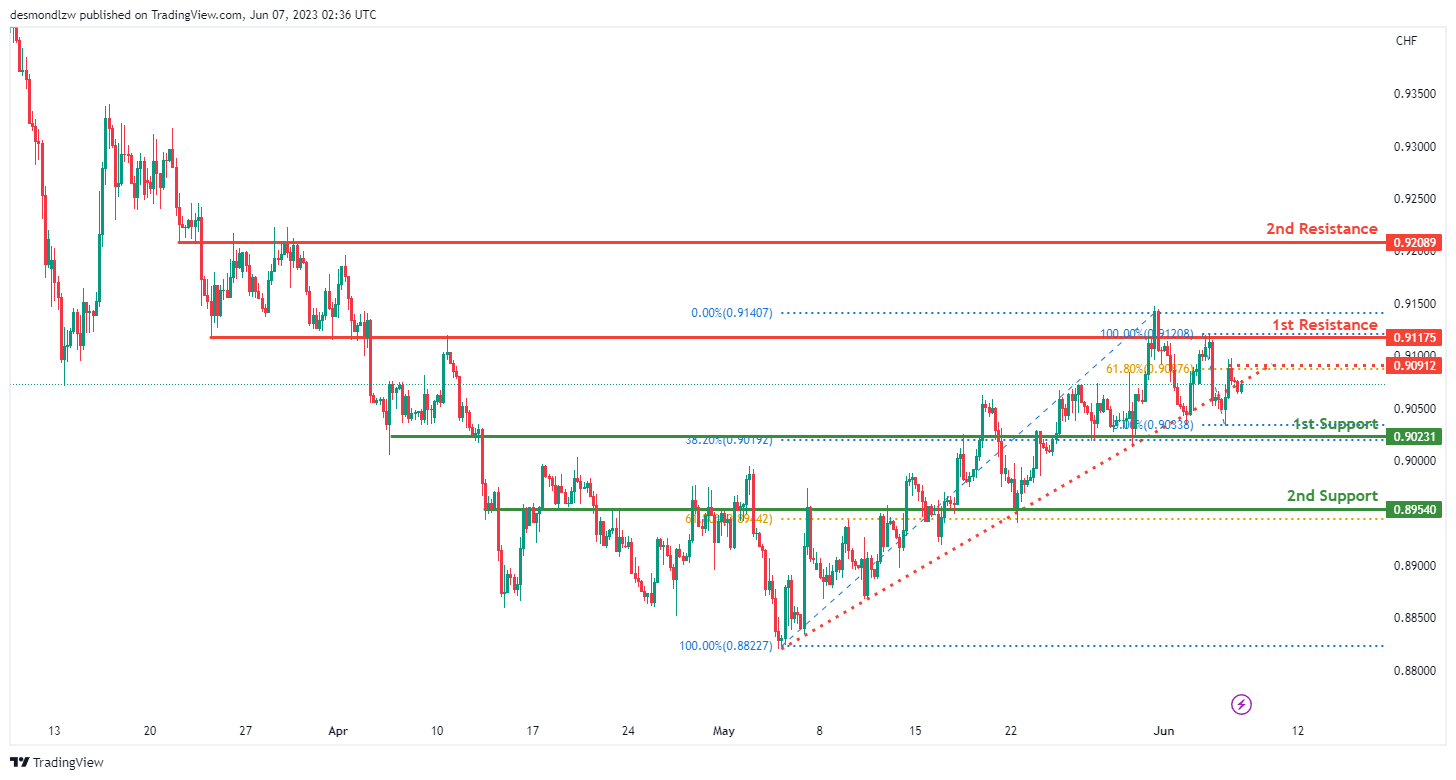
The USD/CHF chart currently exhibits bearish momentum as the price has broken below an ascending support line, indicating the potential for further downward movement.
Considering this bearish momentum, there is a possibility that the price could experience a bearish reaction from the first resistance level at 0.9117 and decline towards the first support level at 0.9023. The first support level is identified as an overlap support and also coincides with the 38.20% Fibonacci retracement. Additionally, the second support level at 0.8954 is an overlap support and aligns with the 61.80% Fibonacci retracement.
On the other hand, the first resistance level at 0.9117 and the second resistance level at 0.9208 are identified as overlap resistances.
USD/JPY:
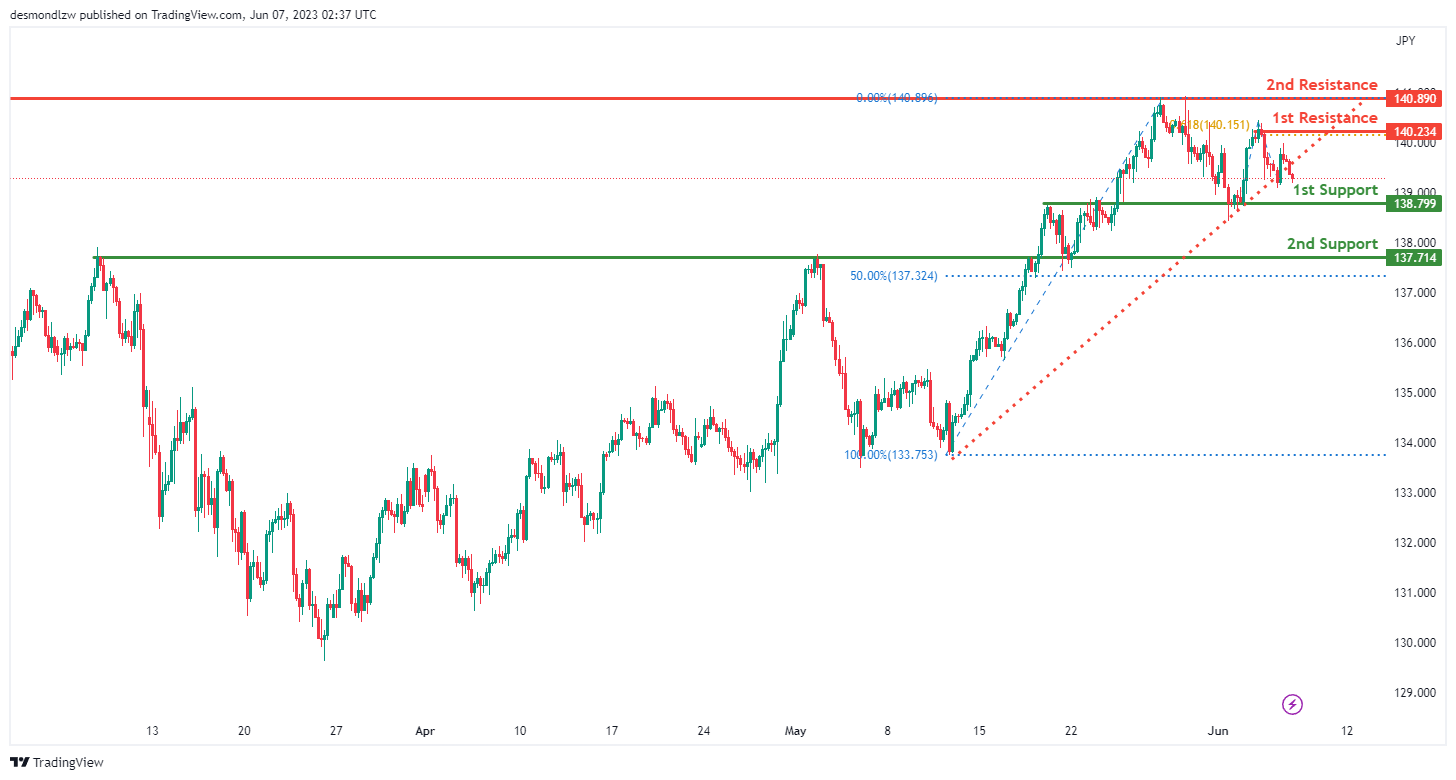
The USD/JPY chart currently exhibits bearish momentum as the price has broken below an ascending support line, suggesting the potential for further downward movement.
Considering this bearish momentum, there is a possibility that the price could continue its bearish trend towards the first support level at 138.79. This level is identified as an overlap support. Additionally, the second support level at 137.71 aligns with the 50% Fibonacci retracement, further reinforcing its significance as a potential support area.
On the other hand, the first resistance level at 140.23 and the second resistance level at 140.89 are identified as swing high and multi-swing high resistances, respectively.
USD/CAD:
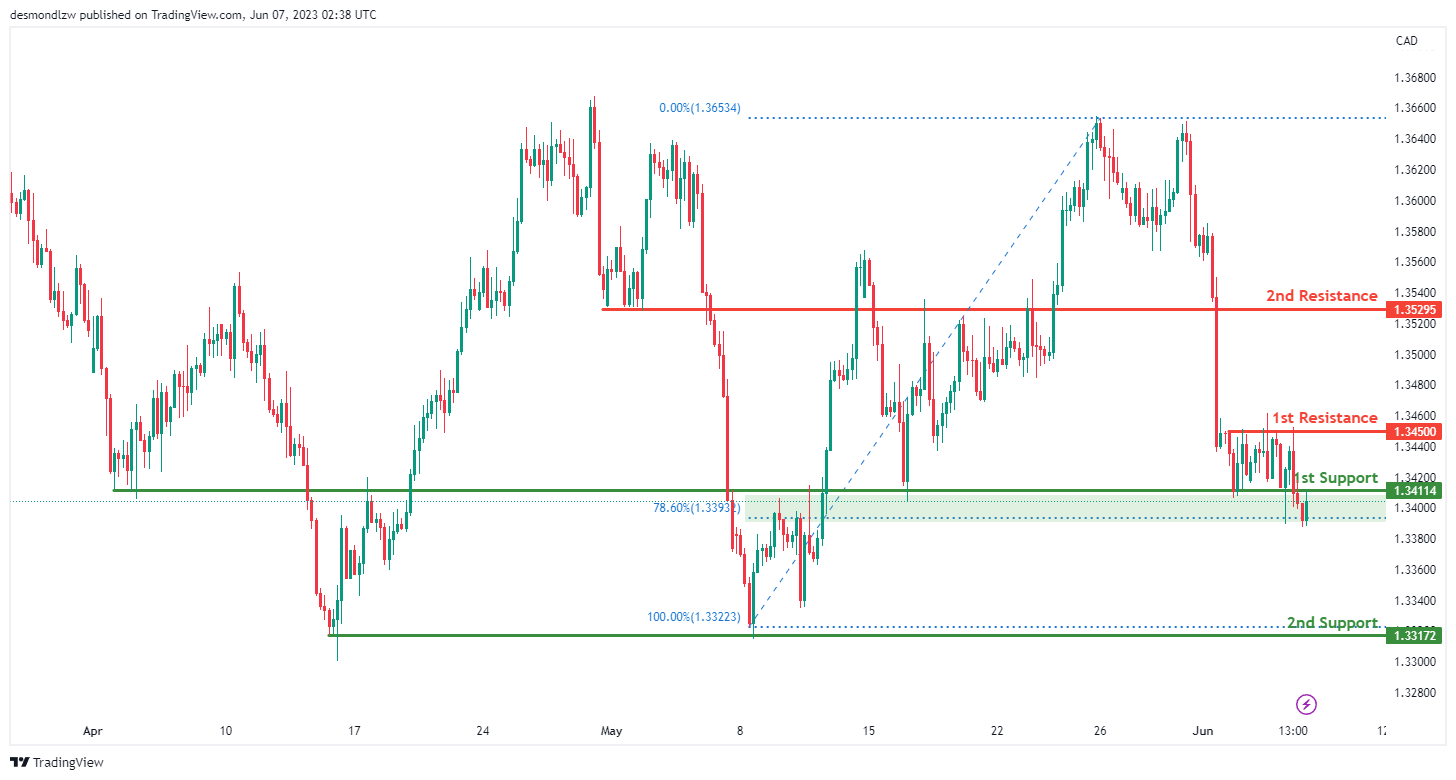
The USD/CAD chart currently exhibits bullish momentum, indicating a potential upward trend in the market.
Based on this bullish momentum, there is a possibility that the price could experience a bullish bounce off the first support level and move towards the first resistance level.
The first support level at 1.3411 is identified as an overlap support, while the second support level at 1.3317 is a multi-swing low support, both serving as potential areas where buyers might enter the market.
On the upside, the first resistance level at 1.3450 is identified as a multi-swing high resistance, and the second resistance level at 1.3529 is a pullback resistance, potentially posing challenges to further upward price movements.
AUD/USD:
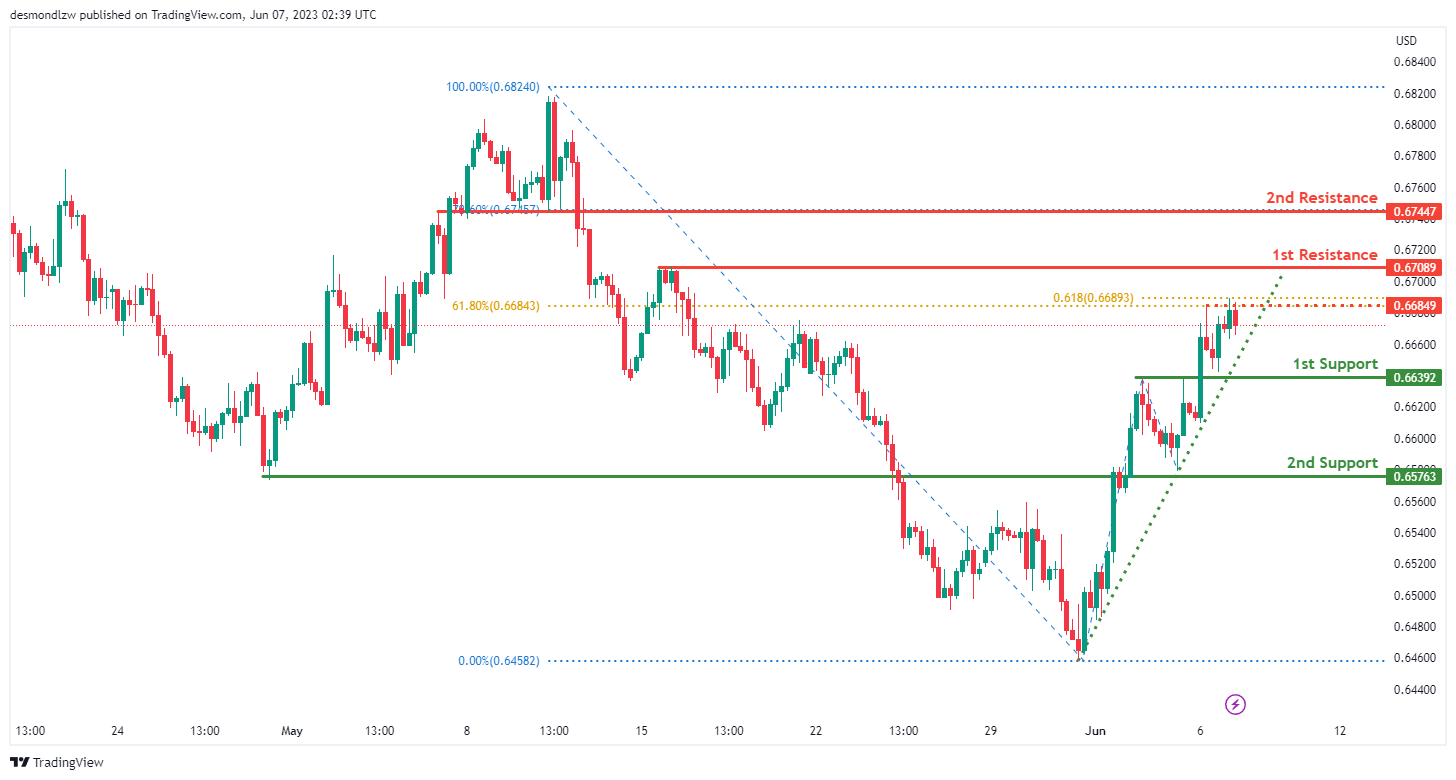
The AUD/USD chart currently demonstrates bullish momentum, indicating a potential upward trend in the market.
Contributing to this momentum is the fact that the price is above a major ascending trend line, suggesting the possibility of further bullish movements.
Considering this bullish context, there is a potential for a bullish continuation towards the first resistance level.
The first support level at 0.6639 is recognized as an overlap support, while the second support level at 0.6576 also serves as an overlap support, adding to their significance as potential areas where buyers might enter the market.
On the upside, the first resistance level at 0.6708 is identified as a multi-swing high resistance, while the second resistance level at 0.6744 is a pullback resistance, coinciding with the 78.60% Fibonacci retracement level. Additionally, the intermediate resistance at 0.6684 is a multi-swing high resistance, aligning with the 61.80% Fibonacci retracement and projection levels.
NZD/USD
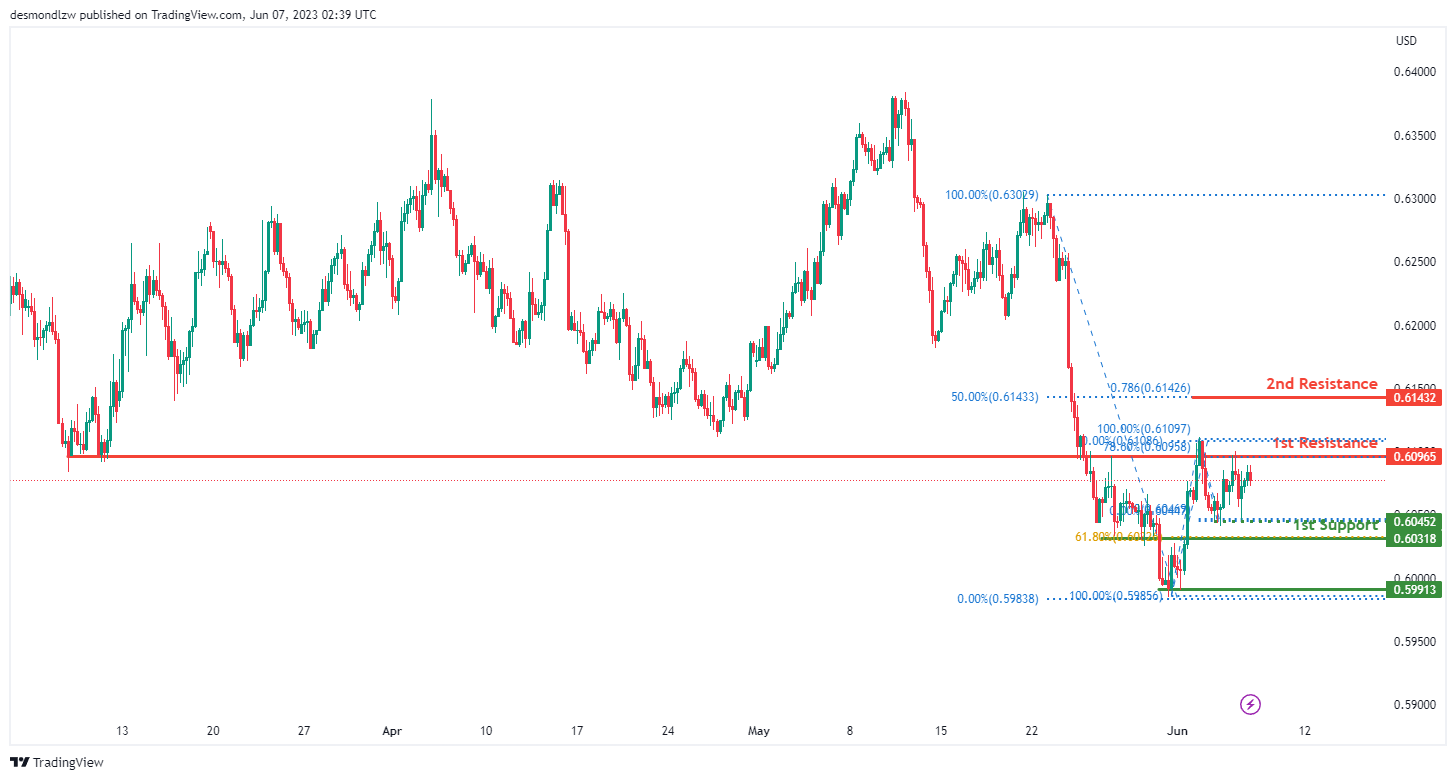
The NZD/USD chart currently shows bearish momentum, indicating a potential downward trend in the market.
Considering this bearish momentum, there is a possibility of a bearish continuation towards the first support level.
The first support at 0.6031 is identified as an overlap support, coinciding with the 61.80% Fibonacci retracement level. The second support at 0.5991 is recognized as a multi-swing low support, adding to its significance.
On the upside, the first resistance at 0.6096 is a multi-swing high resistance, while the second resistance at 0.6143 aligns with the 50% Fibonacci retracement and 78.60% Fibonacci projection levels.
Additionally, the intermediate support at 0.6045 serves as a multi-swing low support.
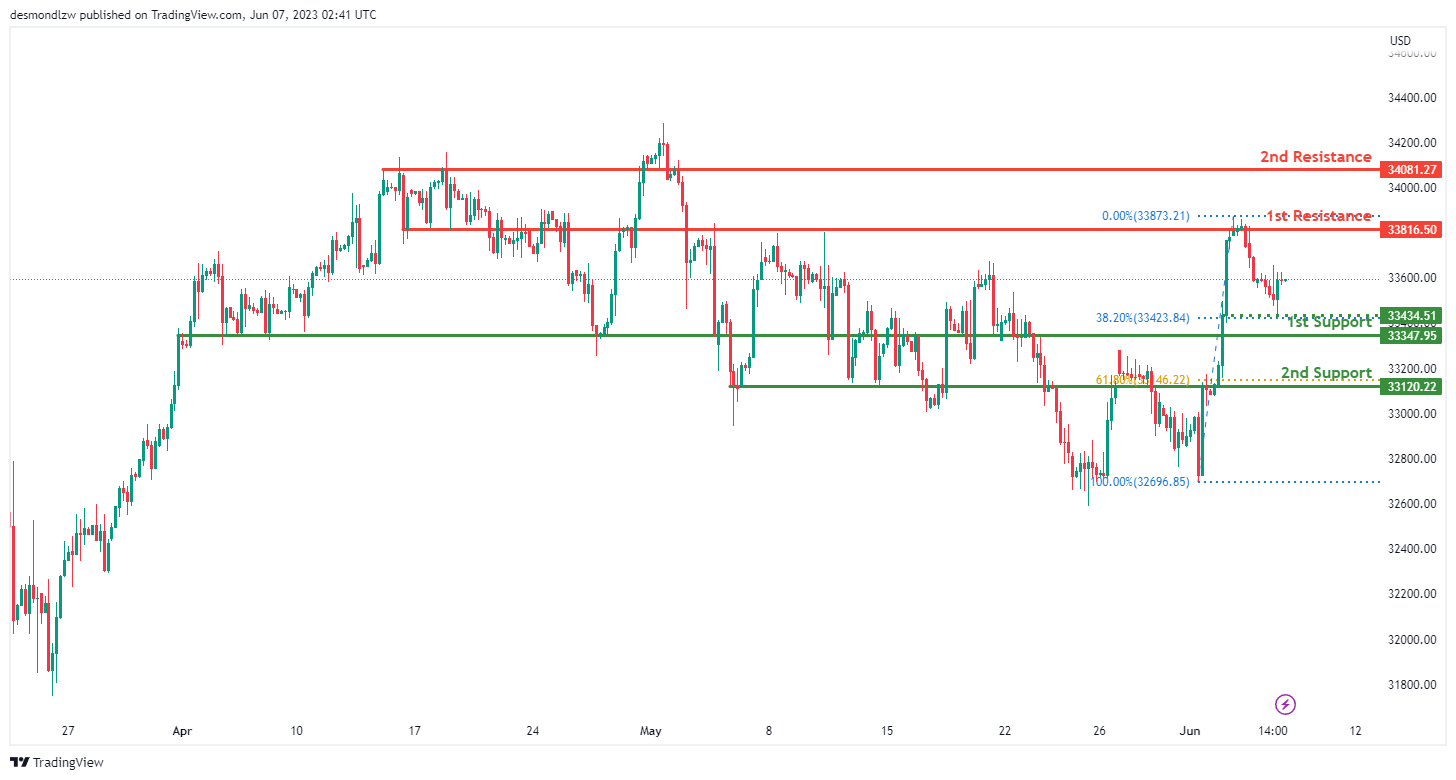
DJ30:
The DJ30 (Dow Jones Industrial Average) chart currently exhibits bullish momentum, indicating a potential upward trend in the market.
Considering this bullish momentum, there is a possibility of a bullish continuation towards the first resistance level.
The first support at 33,347.95 is identified as pullback support, while the second support at 33,120.22 is recognized as an overlap support, coinciding with the 61.80% Fibonacci retracement level.
On the upside, the first resistance at 33,816.50 is an overlap resistance, and the second resistance at 34,081.22 is identified as pullback resistance.
Additionally, the intermediate support at 33,434.51 serves as swing low support.
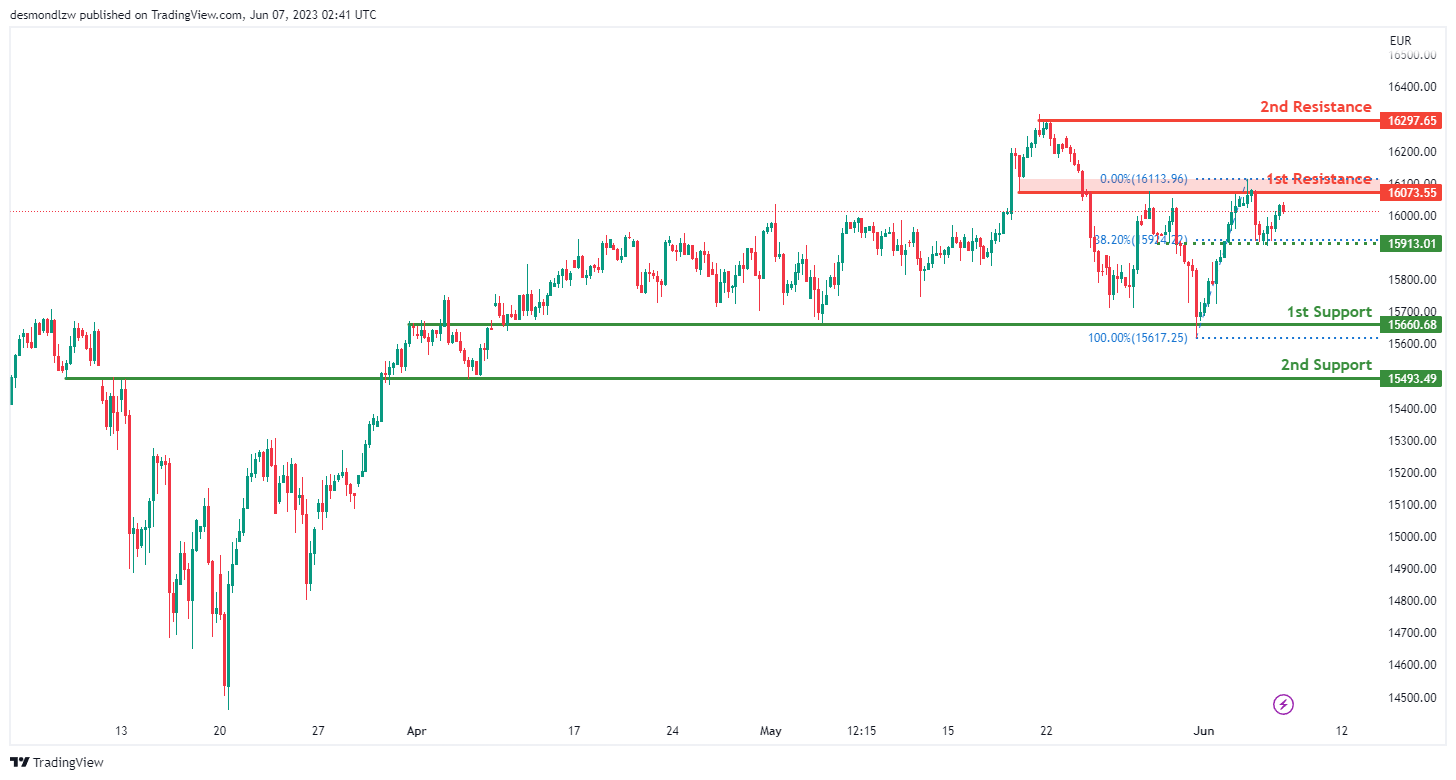
GER30:
The GER30 (DAX) chart currently exhibits a weak bullish momentum with low confidence, suggesting a potential upward trend in the market, although with some uncertainty.
Considering this weak bullish momentum, there is a possibility of a bullish continuation towards the first resistance level.
The first support at 15,660.68 is identified as pullback support, while the second support at 15,493.49 is recognized as an overlap support.
On the upside, the first resistance at 16,023.55 is an overlap resistance, and the second resistance at 16,297.65 is identified as swing high resistance.
Additionally, the intermediate support at 15,913.01 serves as an overlap support and aligns with the 38.20% Fibonacci retracement level.
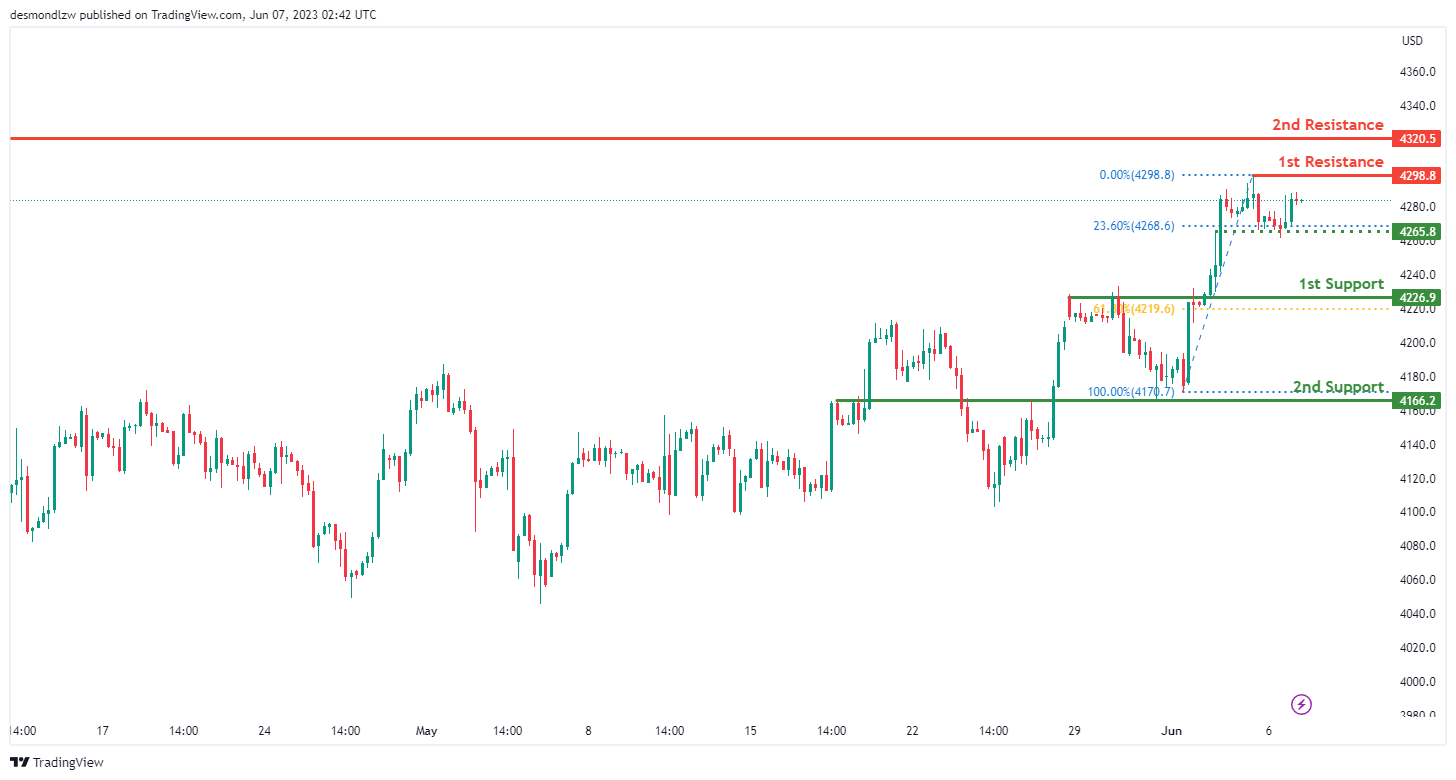
US500
The US500 (S&P 500) chart currently exhibits a weak bullish momentum with low confidence, suggesting a potential upward trend in the market, although with some uncertainty.
Considering this weak bullish momentum, there is a possibility of a bullish continuation towards the first resistance level.
The first support at 4,226.9 is identified as pullback support, and the second support at 4,166.2 is recognized as an overlap support.
On the upside, the first resistance at 4,298.8 is a swing high resistance, and the second resistance at 4,320.5 is also identified as a swing high resistance.
Additionally, the intermediate support at 4,265.8 serves as an overlap support and aligns with the 23.60% Fibonacci retracement level.
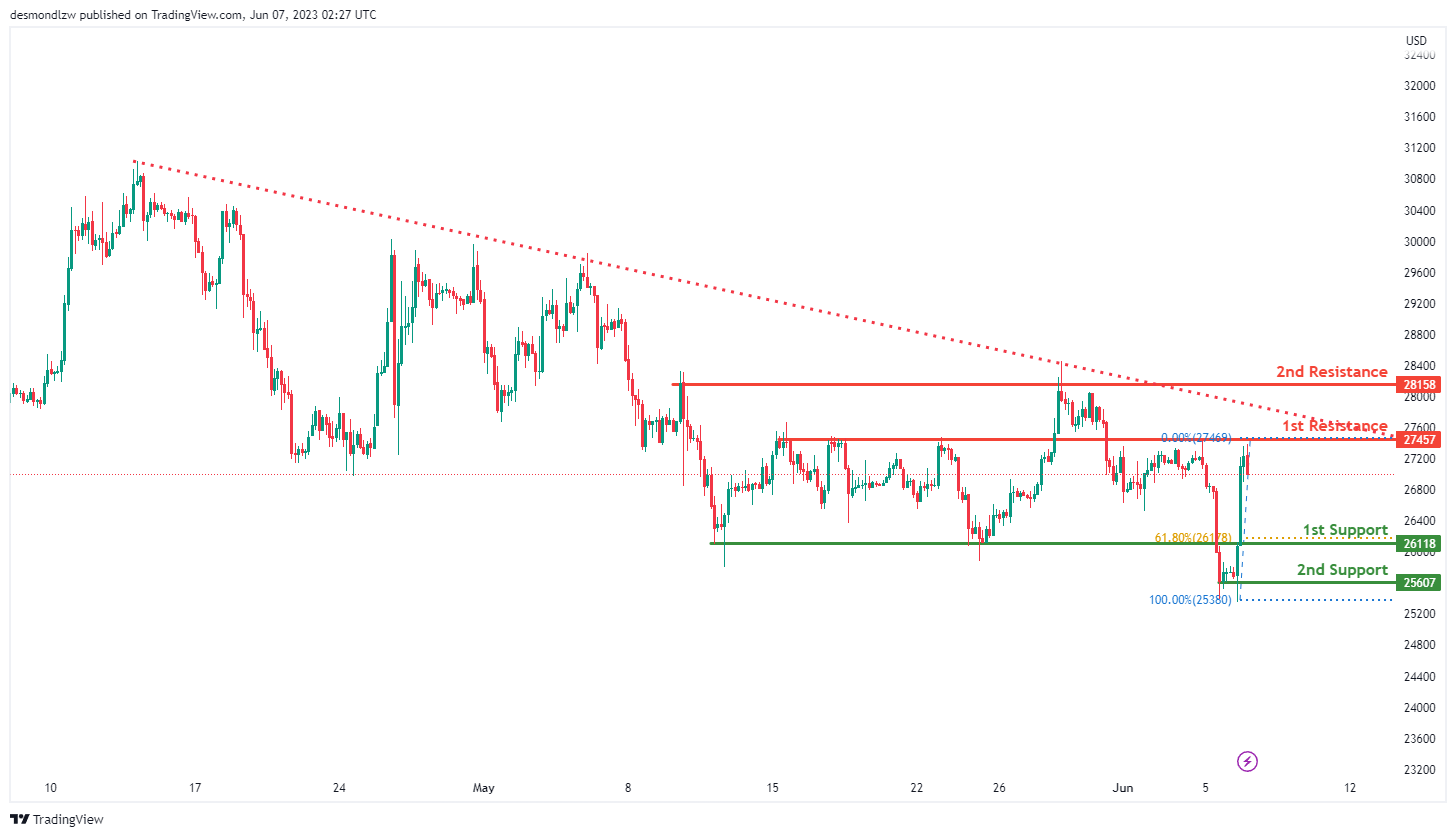
BTC/USD:
The BTC/USD chart currently indicates a bearish momentum, with the price below a significant descending trend line, suggesting a continuation of the bearish trend.
Considering this bearish momentum, there is potential for the price to continue its downward movement towards the first support level at 26118.0. This level is identified as a pullback support, where buyers may show increased interest in entering the market.
Furthermore, the second support level at 25607.0 is recognized as a multi-swing low support, adding to its significance as a potential price level where buyers may provide support.
On the other hand, the first resistance level at 27457.0 is identified as an overlap resistance, potentially acting as a barrier to upward price movements.
Additionally, the second resistance level at 28158.0 is noted as a multi-swing high resistance, suggesting a level where selling pressure has historically been observed.
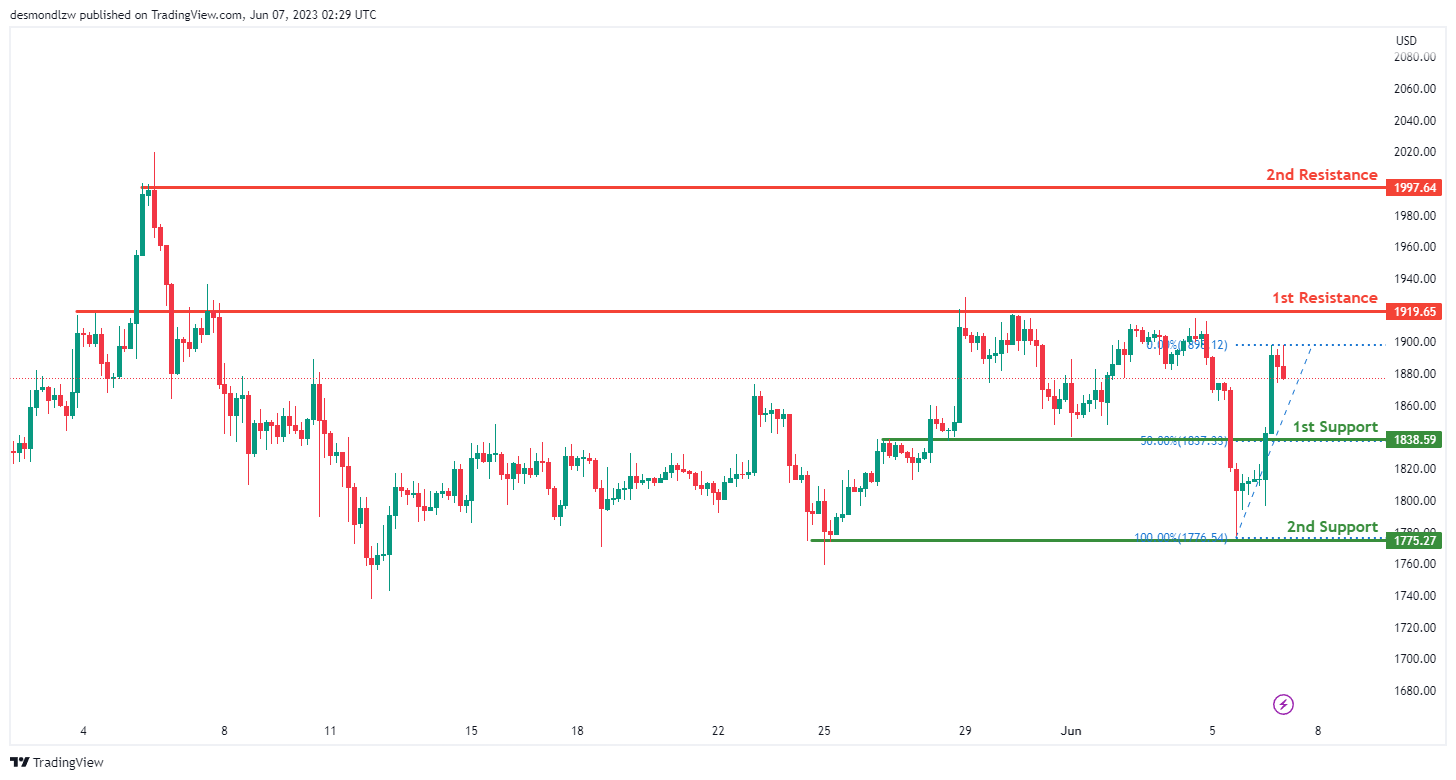
ETH/USD:
The ETH/USD chart currently shows a bearish momentum, indicating a downward trend in the market.
Based on this bearish momentum, there is potential for a continuation of the bearish movement towards the first support level at 1838.59. This level is considered a significant area of pullback support, where buyers may show increased interest in entering the market.
Additionally, the second support level at 1775.27 is recognized as a multi-swing low support, further reinforcing its importance as a potential price level where buyers could potentially enter.
On the other hand, the first resistance level at 1919.65 is identified as an overlap resistance, suggesting it may act as a barrier to upward price movements.
Furthermore, the second resistance level at 1997.65 is noted as a swing high resistance, indicating a level where selling pressure has historically been observed.
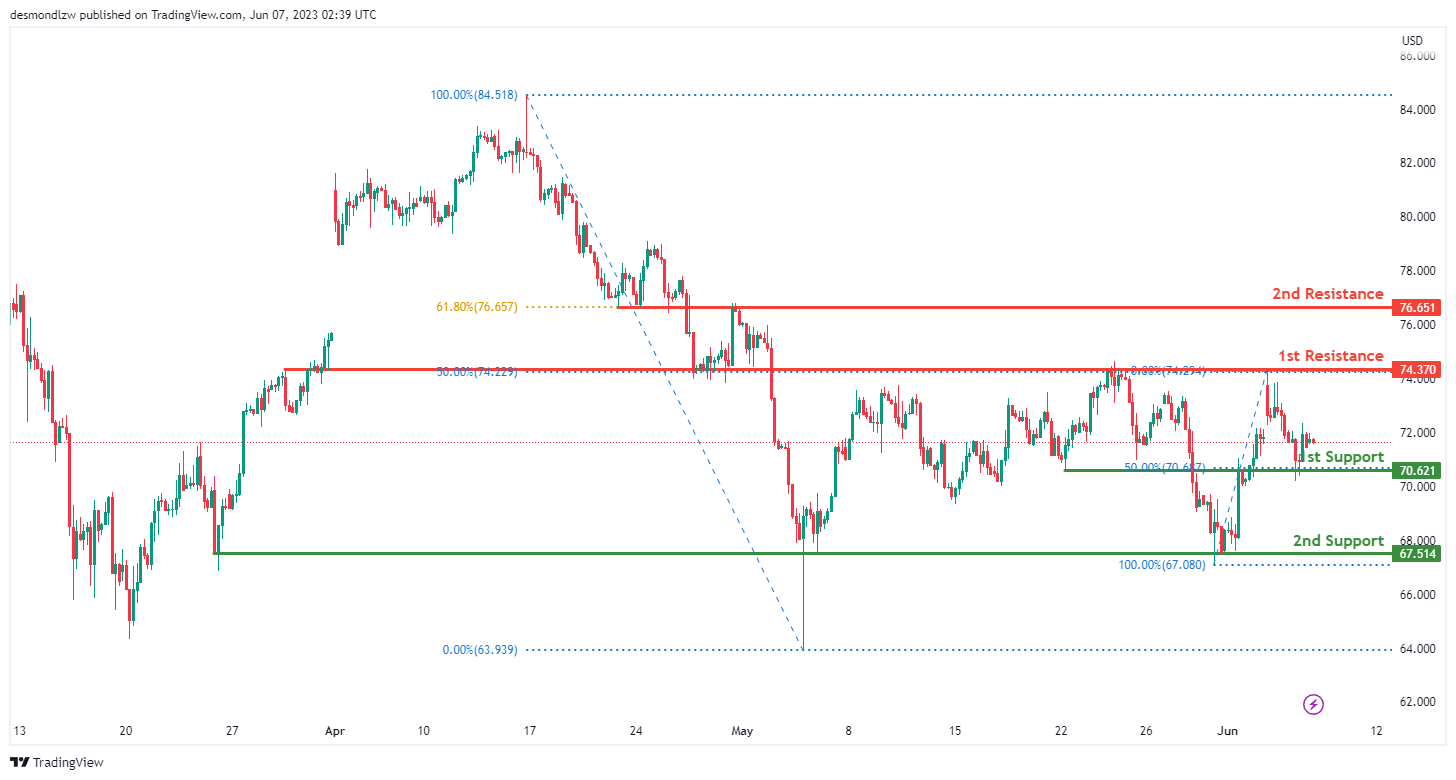
WTI/USD:
The WTI (West Texas Intermediate) chart currently shows a bullish momentum, indicating an upward trend in the market.
In this bullish context, there is a potential for the price to continue its upward movement towards the first resistance level.
The first support level at 70.62 is identified as an overlap support and coincides with the 50% Fibonacci retracement level, adding to its significance as a potential area where buyers may provide support.
Furthermore, the second support level at 67.51 is recognized as a multi-swing low support, further reinforcing its importance as a potential price level where buyers may step in.
On the upside, the first resistance level at 74.37 is identified as an overlap resistance, potentially acting as a barrier to further upward price movements.
Additionally, the second resistance level at 70.65 is noted as a swing high resistance, aligning with the 61.80% Fibonacci retracement level, making it another notable level to monitor.
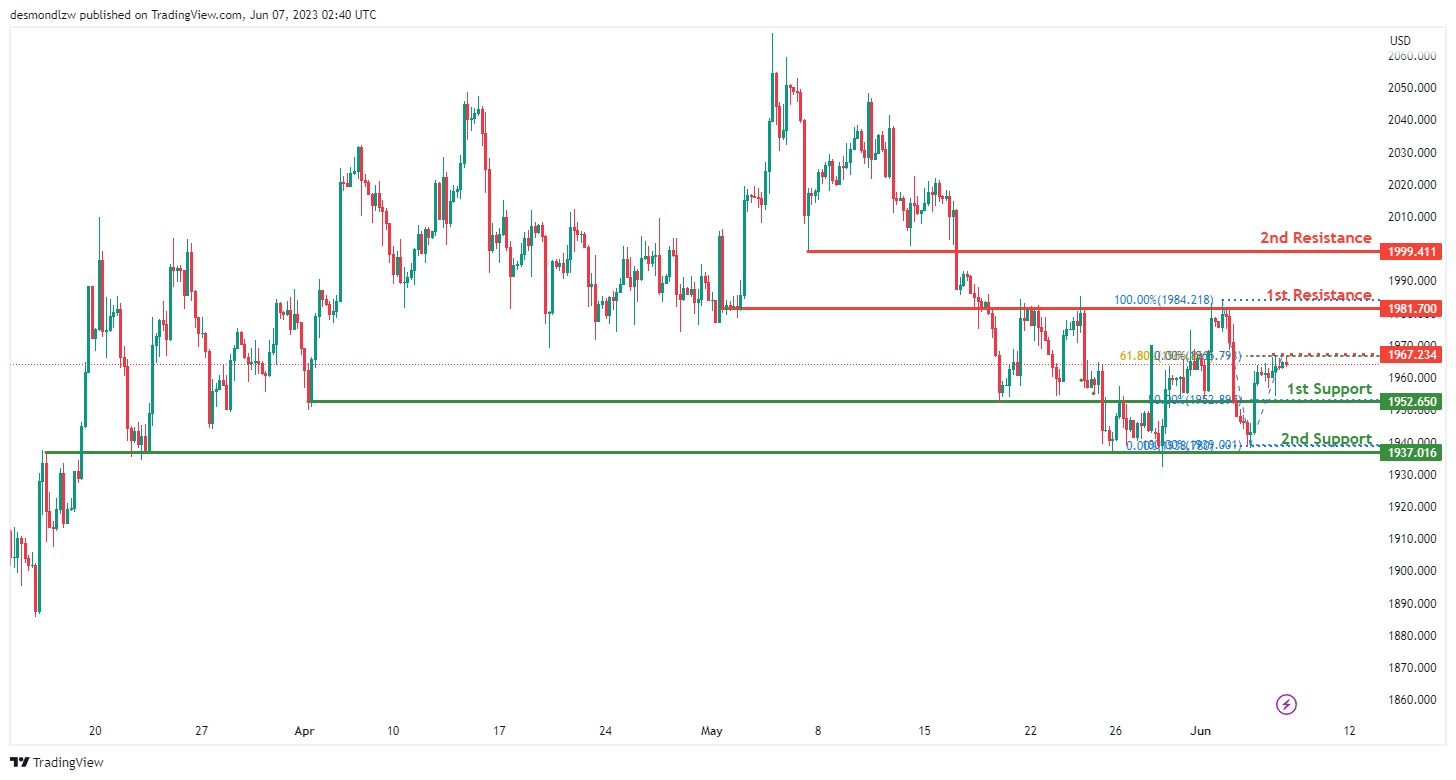
XAU/USD (GOLD):
The XAU/USD (Gold/US Dollar) chart currently demonstrates a bullish momentum, indicating an upward trend in the market.
Considering this bullish momentum, there is a potential for the price to continue its upward movement towards the first resistance level.
The first support level at 1952.65 is identified as an overlap support, serving as a potential area where buyers may provide support.
Furthermore, the second support level at 1937.01 is recognized as a multi-swing low support, reinforcing its significance as a potential price level where buyers may step in.
On the upside, the first resistance level at 1981.70 is identified as an overlap resistance, potentially acting as a barrier to further upward price movements.
Additionally, the second resistance level at 1999.41 is noted as a pullback resistance, indicating potential selling pressure at this level.
An intermediate resistance level at 1967.23 is also identified as a multi-swing high resistance, aligning with the 61.80% Fibonacci retracement level, further adding to its importance.
The accuracy, completeness and timeliness of the information contained on this site cannot be guaranteed. IC Markets does not warranty, guarantee or make any representations, or assume any liability regarding financial results based on the use of the information in the site.
News, views, opinions, recommendations and other information obtained from sources outside of www.icmarkets.com, used in this site are believed to be reliable, but we cannot guarantee their accuracy or completeness. All such information is subject to change at any time without notice. IC Markets assumes no responsibility for the content of any linked site.
The fact that such links may exist does not indicate approval or endorsement of any material contained on any linked site. IC Markets is not liable for any harm caused by the transmission, through accessing the services or information on this site, of a computer virus, or other computer code or programming device that might be used to access, delete, damage, disable, disrupt or otherwise impede in any manner, the operation of the site or of any user’s software, hardware, data or property.


