
A note on lower timeframe confirming price action…
Waiting for lower timeframe confirmation is our main tool to confirm strength within higher timeframe zones, and has really been the key to our trading success. It takes a little time to understand the subtle nuances, however, as each trade is never the same, but once you master the rhythm so to speak, you will be saved from countless unnecessary losing trades. The following is a list of what we look for:
- A break/retest of supply or demand dependent on which way you’re trading.
- A trendline break/retest.
- Buying/selling tails/wicks – essentially we look for a cluster of very obvious spikes off of lower timeframe support and resistance levels within the higher timeframe zone.
- Candlestick patterns. We tend to stick with pin bars and engulfing bars as these have proven to be the most effective.
We search for lower timeframe confirmation between the M15 and H1 timeframes, since most of our higher-timeframe areas begin with the H4. Stops are usually placed 5-10 pips beyond confirming structures.
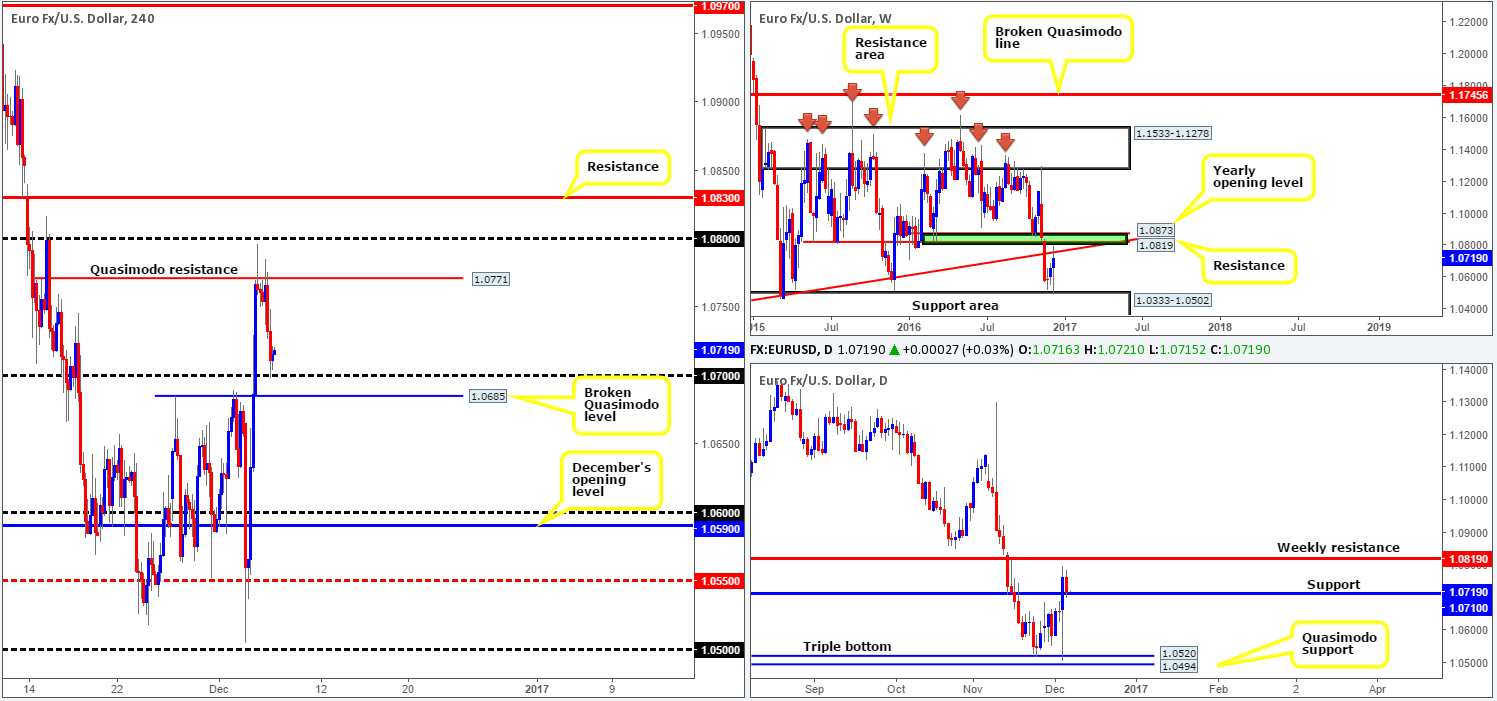
EUR/USD:
During the course of yesterday’s sessions, the single currency tumbled lower from the H4 Quasimodo resistance level at 1.0771, and nudged into the 1.07 boundary going into the later hours of the US segment. The selloff, as far as we can see, was bolstered by a long-term weekly trendline resistance extended from the low 0.8231, and shows that the weekly candles could rotate back down as far as the weekly support area at 1.0333-1.0502.While this may be true, we have to take into account that the 1.07 handle is also seen reinforced by a daily support level coming in at 1.0710. This, according to the daily timeframe, could springboard the unit back up to the aforementioned weekly trendline, or the nearby 2016 yearly opening level at 1.0873/ weekly resistance at 1.0819 lurking just above it.
Our suggestions: With offers seen holding firm at a weekly trendline resistance and bids currently controlling this pressure from a daily support, there is somewhat of a tug-of-war taking place between these two higher-timeframe structures. To confirm a bearish stance in this market, a daily close below the support would be ideal as this would, in our estimation, force the H4 candles to close below not only 1.07, but also the nearby H4 broken Quasimodo line at 1.0685. The space seen below these two levels on the H4 is striking, with little seen standing in the way of the pair from dropping down to at least 1.06.
Although buying from 1.07 is valid according to the daily structure, we remain hesitant. Buying against weekly flow, even with room seen for H4 price to swing back up to the H4 Quasimodo resistance, is not something our team would stamp high probability.
Data points to consider: US JOLTS report at 3pm GMT.
Levels to watch/live orders:
- Buys: Flat (stop loss: N/A).
- Sells: Watch for at least a decisive H4 close below the H4 broken Quasimodo line at 1.0685 before considering selling this market. A retest of 1.0685, followed up by a reasonably sized H4 bear candle would be enough to justify a short entry (stop loss: ideally beyond the trigger candle).
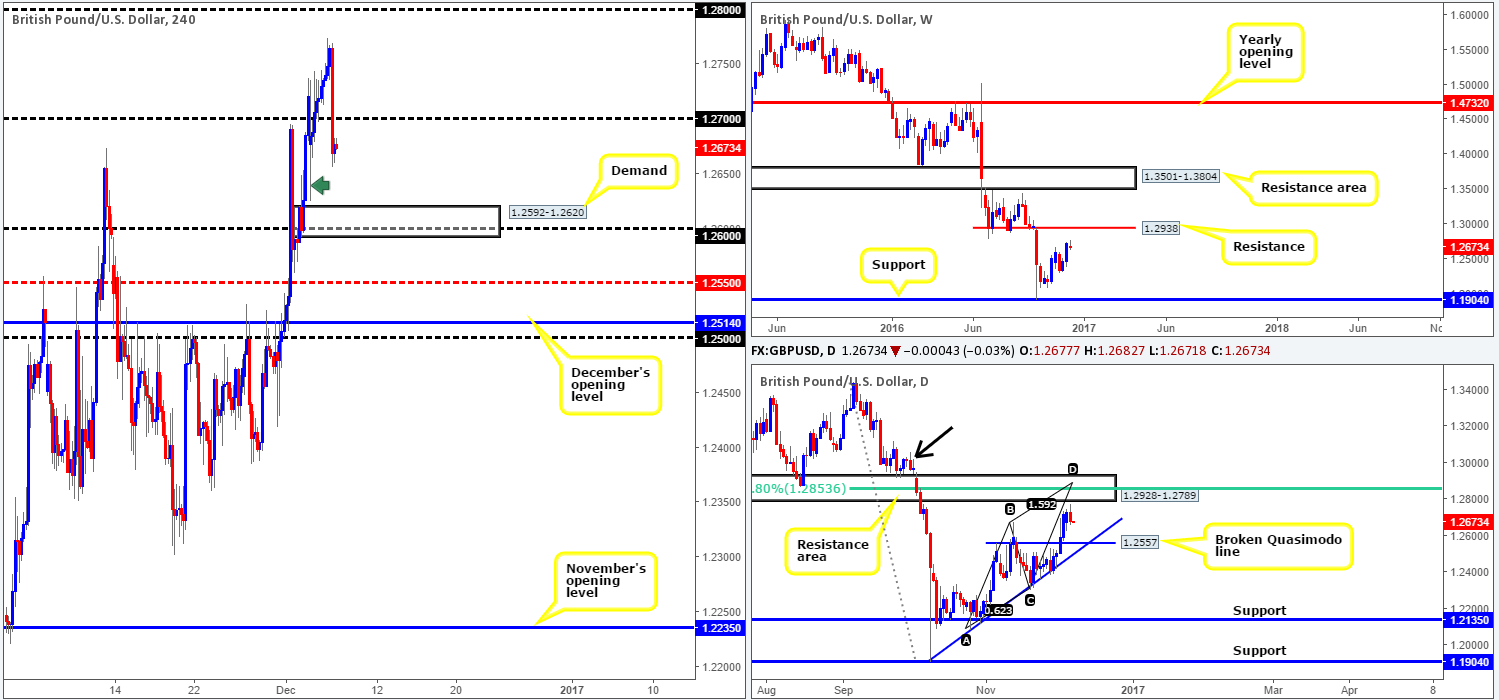
GBP/USD:
Leaving both the 1.28 handle and also the underside of a daily resistance area at 1.2789 unchallenged, the pair put in a top around the 1.2770 range and sold off in one fell swoop amid the early hours of yesterday’s US morning session. The move, aided by the dollar finding support from 100.00 (see the US dollar index), squeezed buyers out from the 1.27 region and ended the day bottoming just ahead of the H4 mid-way point 1.2650.
The H4 chart shows range for further selling today to demand marked at 1.2592-1.2620, as does the daily chart down to 1.2557: a daily broken Quasimodo line. Looking over to the weekly candles, nevertheless, the unit looks poised to extend north to resistance drawn from 1.2938.
Our suggestions: If one is planning to sell the GBP today, 1.27 looks appealing for shorts. We feel there is a high probability that price will achieve the top edge of the aforementioned H4 demand (see the H4 demand consumption tail to the left of current price marked with a green arrow at 1.2624) from this barrier. But as things stand, a sell from 1.27 also places one at risk since let’s not forget that weekly flow shows space to move north! Therefore, a sell from 1.27 would only be considered a valid upon seeing a H4 bearish candle form. Granted, this will not guarantee a winning trade, but what it will show is seller interest!
Data points to consider: UK Factory production at 9.30am. US JOLTS report at 3pm GMT.
Levels to watch/live orders:
- Buys: Flat (stop loss: N/A).
- Sells: 1.27 region ([reasonably sized H4 bearish close required prior to pulling the trigger] stop loss: ideally beyond the trigger candle).
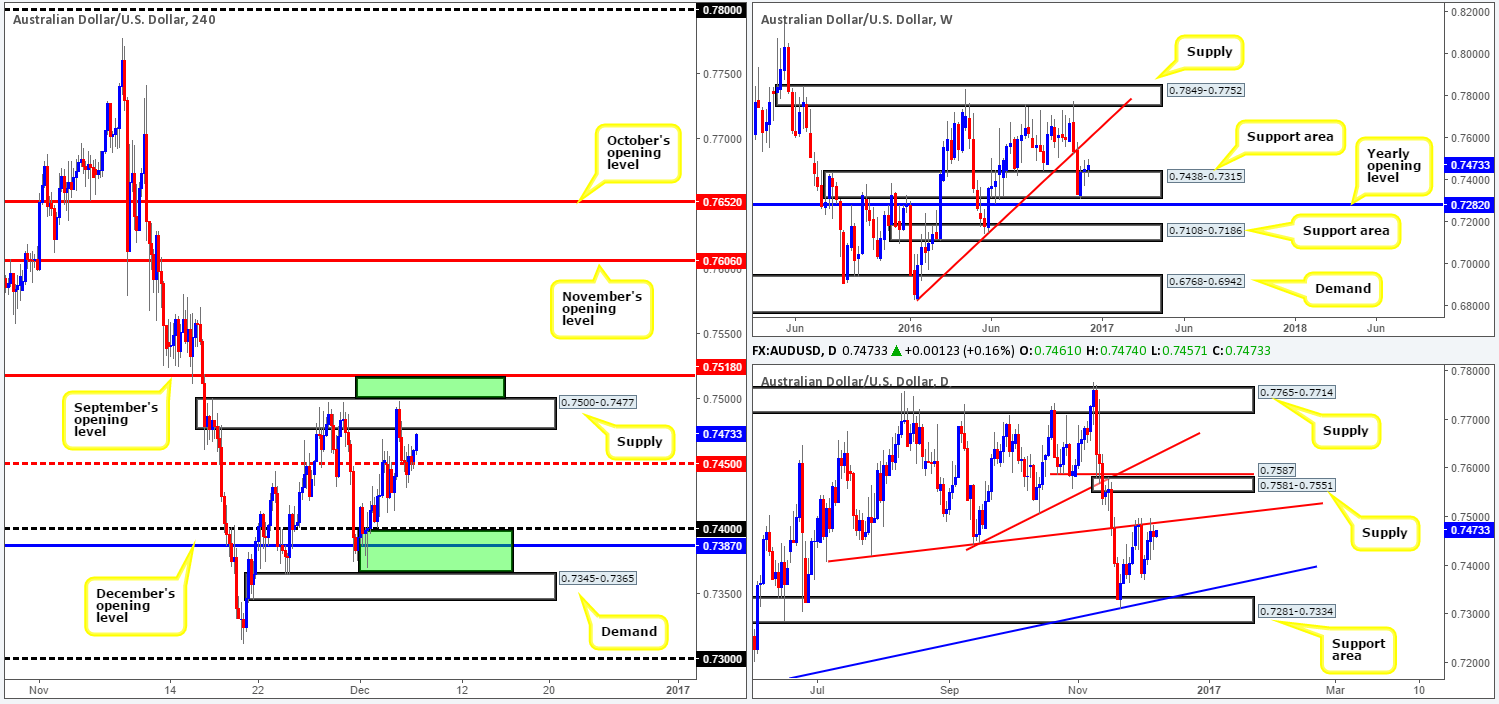
AUD/USD:
As expected, the Aussie Central bank left interest rates unchanged yesterday, consequently sparking a minor rally off H4 mid-way support at 0.7450 (see M30) in early trading. As we write, the commodity currency is seen trading within a hair of the H4 supply zone coming in at 0.7500-0.7477. The main focal point, however, remains between this supply zone and September’s opening level at 0.7518 (upper green zone). The zone is considered, at least by our desk, to be a fakeout area. Our reasoning simply stems from the amount of stops likely positioned above the current H4 supply, hence the expectation of a fakeout/stop run. What’s more, this region intersects beautifully with the daily trendline resistance stretched from the low 0.7407. As tempting as this area is though, one must also acknowledge weekly action currently trading from a support area at 0.7438-0.7315, thus a drive through the H4 sell zone is a possibility.
Our suggestions: As there is risk of weekly bulls pushing this market higher (see above), we would recommend waiting for a H4 bear candle to confirm seller interest at 0.7518/ 0.7500-0.7477 before pressing the sell button. In addition to this, in 30 or so minutes the Australian Bureau of Statistics will release GDP q/q. Therefore, we would advise trading the above noted sell zone with caution during this time!
Data points to consider: Aussie GDP q/q at 12.30am. US JOLTS report at 3pm GMT.
Levels to watch/live orders:
- Buys: Flat (stop loss: N/A).
- Sells: 0.7518/0.75 ([reasonably sized H4 bearish close required prior to pulling the trigger] stop loss: ideally beyond the trigger candle).
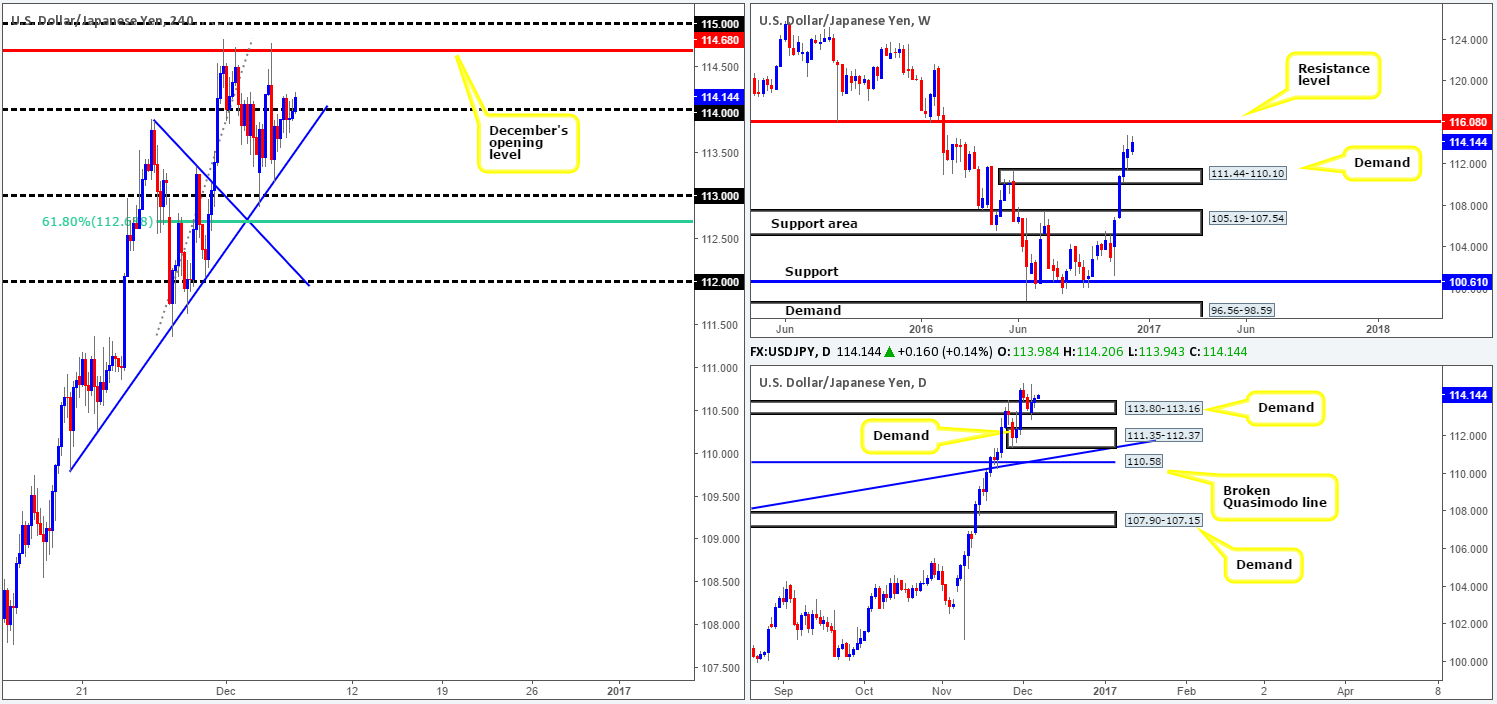
USD/JPY:
Although the pair managed to record a gain, trading was quiet on Tuesday as price spent the majority of the day chewing through orders around the 114 handle. Should a decisive H4 close be seen above this number today followed by a retest, a buy from this neighborhood could be something to consider. Upside targets can be seen at December’s opening level drawn from 114.68, followed closely by the 115 handle.
In support of the above noted setup, the weekly chart displays room to continue advancing this week up to resistance at 116.08 – a level that held beautifully as support throughout 2015. Down on the daily chart, supply-turned demand at 113.80-113.16 continues to hold ground. Providing that the market remains bullish from here, we see absolutely no reason (due to there being little active supply seen to the left of current price) why price cannot reach the aforementioned weekly resistance level.
Our suggestions: Put simply, look to trade the recommended setup above in bold. In the event that price extends beyond 115, as the higher-timeframe structures suggest, the 116 boundary is the next target resistance seen on the hit list, which effectively represents the weekly resistance band mentioned above at 116.08.
Data points to consider today: US JOLTS report at 3pm GMT. Japanese GDP q/q at 11.50pm GMT.
Levels to watch/live orders:
- Buys: Watch for a decisive H4 close above 114 and then look to trade any retest seen thereafter (stop loss: ideally beyond the rejection candle).
- Sells: Flat (stop loss: N/A).
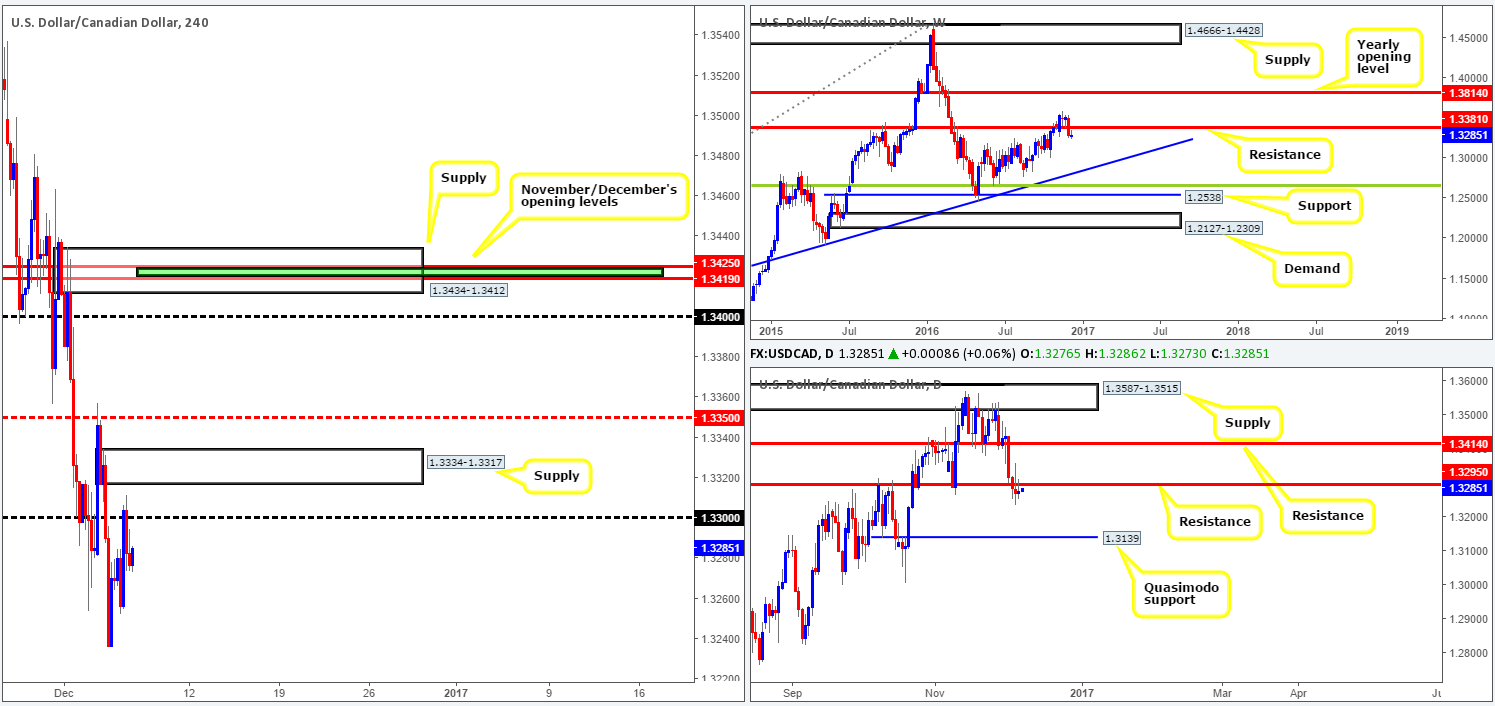
USD/CAD:
Recent action shows that the USD/CAD extended its bounce from lows of 1.3236 up to the 1.33 region yesterday, which, as you can see, held firm as resistance. Looking over to the daily candles, we can also see that price retested resistance at 1.3295 for a second consecutive day, but was unable to chalk in a close below the prior day’s close. Supposing that the bears continue to defend this line, the unit could tumble as far south as the daily Quasimodo support coming in at 1.3139. Meanwhile, up on the weekly chart, the next downside target from current resistance at 1.3381 can be seen much lower at a trendline support taken from the high 1.1278.
Our suggestions: To our way of seeing things at the moment, the pair certainly reflects somewhat of a bearish stance at present. To take advantage of this, our team will be looking to short from the H4 supply seen directly above 1.33 at 1.3334-1.3317. Our rationale behind this approach comes from the belief that there are a truckload of buy stops still positioned above 1.33, thus providing the big players liquidity to sell into. Therefore, we believe that the H4 supply is tradable for a bounce without the need to wait for confirmation. However, we would strongly advise moving stops to breakeven once price has touched base with 1.33, since this level may very well act as support!
Data points to consider today: BoC rate statement at 3pm. US JOLTS report at 3pm GMT.
Levels to watch/live orders:
- Buys: Flat (stop loss: N/A).
- Sells: 1.3334-1.3317 ([shorts at market here are a possibility] stop loss: 1.3336).
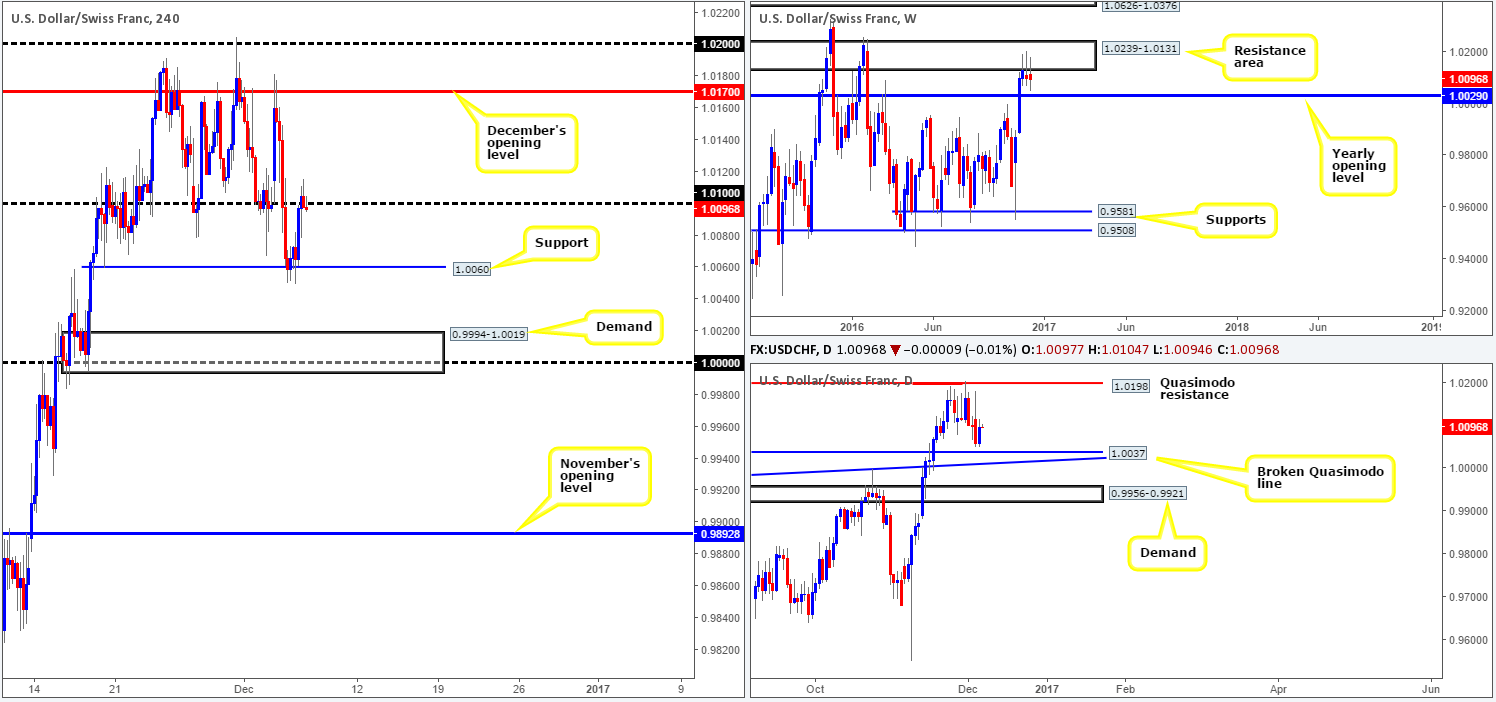
USD/CHF:
Kicking this morning’s analysis off with a quick look at the weekly chart, we can see that although weekly price remains trading from a resistance area at 1.0239-1.0131, the bears appear reluctant to commit at this time. Meanwhile, lower down on the curve, the daily candles recently came within touching distance of connecting with a broken Quasimodo support level at 1.0037. Providing that the bulls extend yesterday’s move, price action could stretch back up to the daily Quasimodo resistance level at 1.0198!
Sweeping over to the H4 chart, the H4 candles managed to catch a bid from the 1.0060 region amid yesterday’s London morning segment. In consequence to this, the pair gravitated up to the 1.01 handle, which, despite a valiant attempt by the bulls to continue beyond this number, appears to be holding ground at the moment.
Our suggestions: According to our analysis, the pair is an awkward beast to trade today. A H4 close above 1.01 followed by a retest and a H4 bull candle would, for us, usually be considered a bullish signal. Not only is the H4 path clear above here to December’s opening level at 1.0170, but we also know that upside is relatively clear on the daily timeframe as well. However, buying above 1.01 unfortunately places you against weekly sellers from the aforementioned resistance area! This is not somewhere we’d feel comfortable trading.
An intraday short from 1.01 on the other hand is a possibility down to the 1.0060 region. Selling from here in line with weekly flow, in our opinion, certainly strengthens the odds of a winning trade. To get in with as tight as stop as possible, however, we’d advise drilling down to the lower timeframes and hunting for a sell setup there. For ideas on how to enter using lower-timeframe structure, see the top of this report.
Data points to consider today: US JOLTS report at 3pm GMT.
Levels to watch/live orders:
- Buys: Flat (stop loss: N/A).
- Sells: 1.01 region ([waiting for a lower timeframe confirmed entry here prior to pulling the trigger is preferred] stop loss: dependent on where one confirms the area, but generally we look to set stops 5 or so pips beyond the confirming structure. This, however, can vary).
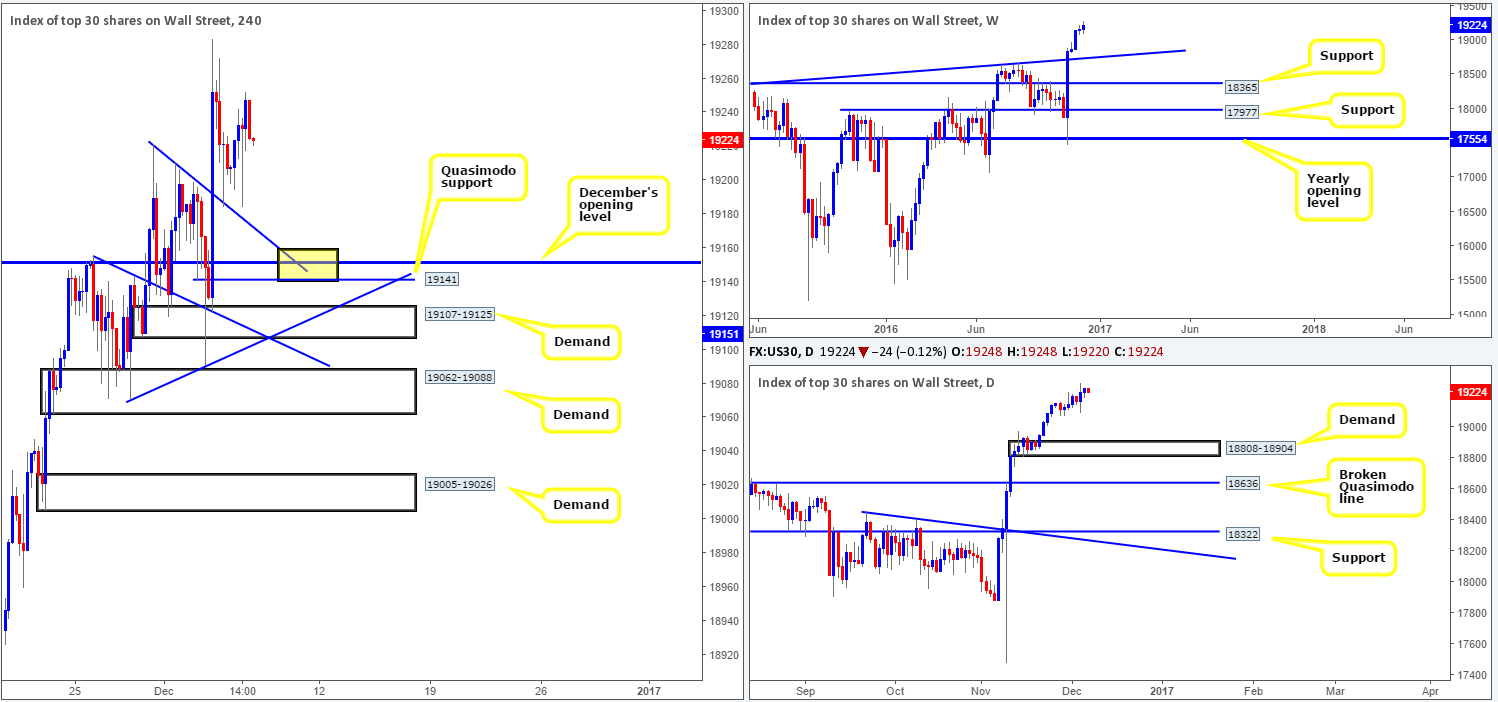
DOW 30:
Although the equity market managed to close higher yesterday, structure is effectively unchanged. The main focus for our desk right now can be seen around the H4 Quasimodo support level at 19141. This level is also strengthened by December’s opening level coming in at 19151 and a H4 trendline support dragged down from the high 19222 (yellow rectangle). Granted, this zone is not bolstered by higher-timeframe structure since the closest, most obvious support, is seen quite a way down at 18808-18904: a daily demand base.
Supporting a bounce from this area, however, is the fact that there’s yet to be a decisive break of significant support on the bigger picture and there is no resistance seen on the horizon, given we’re hitting record highs right now.
Our suggestions: While a long from the H4 buy zone mentioned above (in yellow) is tempting, traders need to be prepared for the possibility of a fakeout down to the nearby H4 demand at 19107-19125, which happens to merge nicely with a H4 trendline support etched from the low 19071. As such, waiting for a H4 bull candle to form off the yellow area prior to pulling the trigger is, at least in our book, the safer route to take.
Data points to consider today: US JOLTS report at 3pm GMT.
Levels to watch/live orders:
- Buys: 19141/19160 ([reasonably sized H4 bullish close required prior to pulling the trigger] stop loss: ideally beyond the trigger candle).
- Sells: Flat (stop loss: N/A).
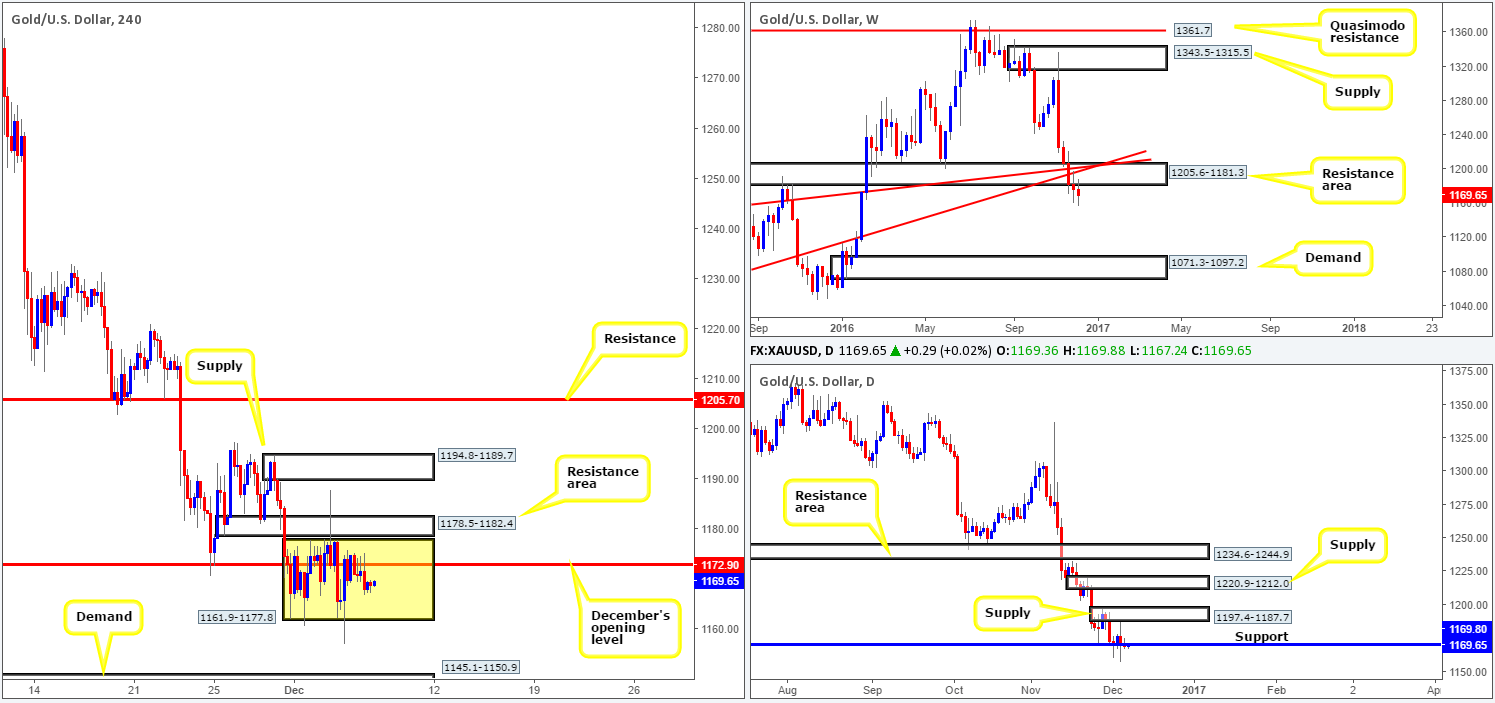
GOLD:
In light of the lackluster performance seen in the gold market yesterday, much of the following report will echo thoughts put forward in our previous analysis.
Since the beginning of the month, the yellow metal has been seen trading within the walls of a H4 consolidation fixed at 1161.9-1177.8. As we hope is clearly demonstrated on the H4 chart, the top edge of this consolidation is bolstered by a H4 resistance area drawn from 1178.5-1182.4, while a break to the downside likely clears the path south for price to test H4 demand at 1145.1-1150.9.
Now, considering that the weekly candles remain beneath the resistance area at 1205.6-1181.3, there’s a chance we may see a continuation move south in the near future. However, to confirm bearish strength from the current weekly resistance area, a DECISIVE daily close below daily support at 1169.8 would be is needed. The close, in our estimation, would likely open up a void down to 1108.2-1117.8: a daily demand.
Our suggestions: Based on the above points, our team is looking for a H4 close to be seen beyond the current H4 consolidation. Should this come into view and is followed up with a retest to the underside of this area as resistance along with a reasonably sized H4 bearish candle, our team would look to short, targeting the H4 demand mentioned above at 1145.1-1150.9 as a first take-profit zone.
Levels to watch/live orders:
- Buys: Flat (stop loss: N/A).
- Sells: Watch for a H4 close to form below the current H4 consolidation zone at 1161.9-1177.8 and then look to trade any retest seen thereafter ([H4 bearish candle close required following the retest] stop loss: ideally beyond the trigger candle).


