
Key risk events today:
German Industrial Production m/m; RBA Assist Gov. Bullock Speaks.
EUR/USD:
Marginally breaching a three-day bullish phase, Tuesday’s session witnessed Europe’s shared currency pare some of its gains, consolidating around the 1.12 figure into the close as traders await further catalysts. Although German industrial orders came in upbeat, questions over the future remain. Overall, there was a more constructive tone yesterday, as the PBoC guided its CNY fixing firmer against the dollar than analysts were expecting, resulting in a stronger USD.
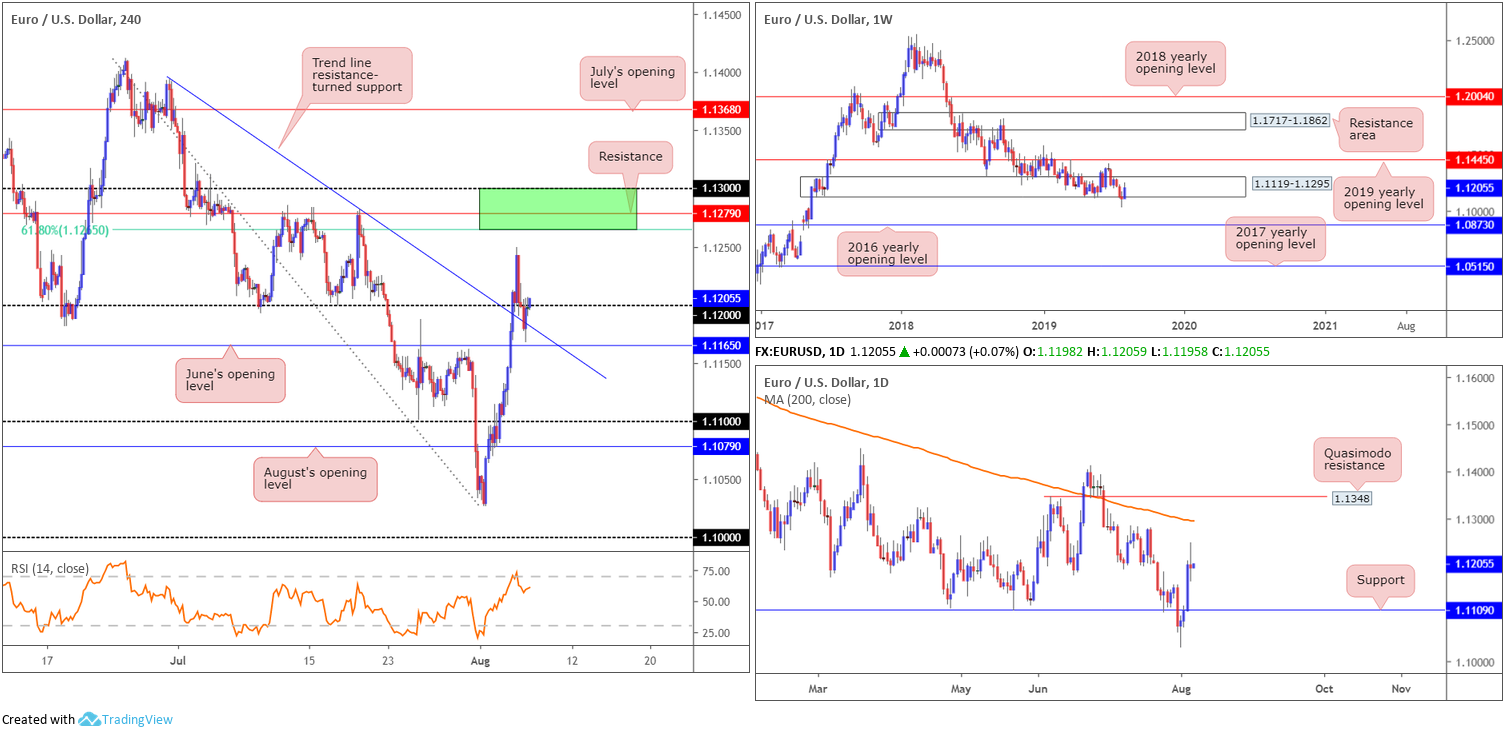
Technically speaking, the EUR/USD’s H4 candles trade marginally above 1.12 in early trade this morning after discovering a bed of support off trendline resistance-turned support etched from the high 1.1393. Similar to Tuesday’s outlook, this has theoretically set the stage for further upside towards resistance coming in at 1.1279, closely followed by 1.13. It might also be worth noting we have a 61.8% Fibonacci resistance value lurking just beneath the two levels at 1.1265 (green).
Expanding our perspective to higher-timeframe terrain, we can see weekly price remains trading within the parapets of long-standing demand at 1.1119-1.1295, despite clocking multi-year lows of 1.1026 last week. Continued bidding from this region has the 2019 yearly opening level at 1.1445 to target. Daily action, on the other hand, is seen fast approaching its 200-day SMA (orange), currently circulating around the 1.1297 level.
Areas of consideration:
Assuming the candles remain above 1.12, longs could be the order of the day, targeting the green H4 resistance area mentioned above at 1.13/1.1265. Note the 200-day SMA also merges with this H4 zone, too. Traders are urged to consider waiting for price to cover additional ground above 1.12 before pulling the trigger. Ideally, a long on a retest of 1.12 is eyed, formed in the shape of a H4 bullish candlestick configuration (entry/risk can be determined according to its framework).
Traders can also expect sellers to make an appearance within the green H4 zone at 1.13/1.1265. Whether this is sufficient to send prices back to 1.12 is difficult to judge, given weekly price trades inside demand. For that reason, it’s worth seeing if H4 price chalks up some form of bearish candlestick signal before committing funds.
GBP/USD:
Although GBP news flow focused on the risks of a no-deal Brexit, sterling eked out marginal gains against its US counterpart Tuesday. The Telegraph reported that between 20-30 Labour lawmakers would vote for a Brexit deal if UK PM Johnson secured further concessions from the EU.
Considering the week’s lacklustre performance thus far, much of the following analysis will air similar thoughts put forward in Monday’s weekly briefing.
From the weekly timeframe:
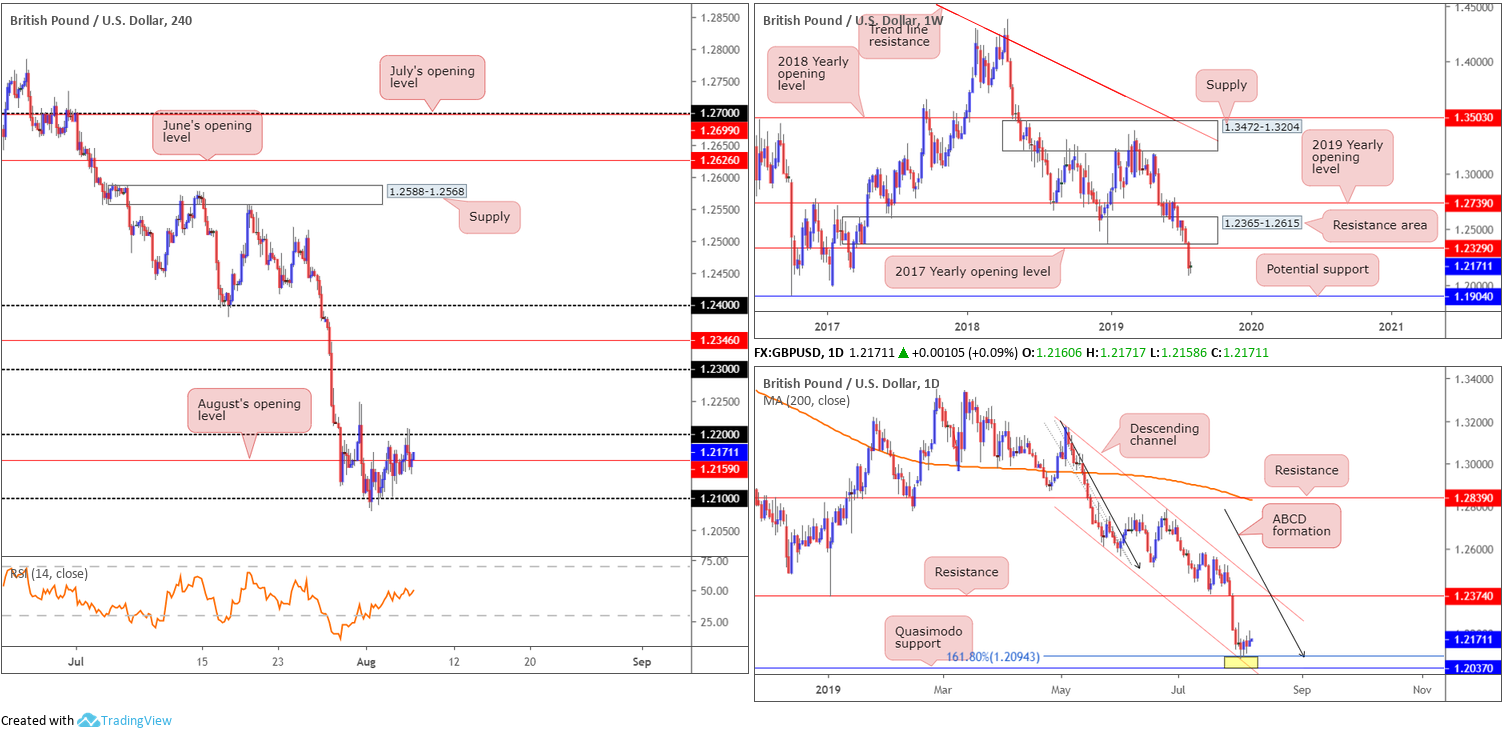
Since retesting the underside of the 2019 yearly opening level at 1.2739 in May, the British pound has been grinding lower against its US counterpart. Tunnelling through bids residing within long-standing demand at 1.2365-1.2615 and eventually overthrowing the 2017 yearly opening level at 1.2329, longer-term flow is exposed to further downside this week, targeting potential support from 1.1904: a standout low clocked in early October 2016.
The daily timeframe:
Contrary to the weekly timeframe’s estimation, daily movement is bottoming around the top edge of a rather interesting support zone between 1.2037/1.2094. Comprised of a 161.8% ABCD (black arrows) pattern at 1.2094, a channel support extended from the low 1.2605 and a Quasimodo support at 1.2037, does this area possess enough oomph to send price towards resistance at 1.2374 this week?
The H4 timeframe:
As of current price, the H4 candles are ranging between psychological marks 1.22 and 1.21, with the RSI indicator touching the underside of its mid-point value (50.0). What’s also notable is in between the two round numbers we have August’s opening level at 1.2159.
Areas of consideration:
Weekly price portends further downside this week, while daily price reveals a clear-cut support area at 1.2037/1.2094. In cases such as this, it’s always best to plot the H4 position for directional cues. For example, a break of 1.22 to the upside confirms bullish strength not only on the H4 timeframe, but also on the daily timeframe, and, therefore, may make a run to 1.23. As such, a long entry either on the breakout or retest at 1.22 is an option.
A break of 1.21, nonetheless, implies weakness within the daily support area and strength on the weekly timeframe. This implies a possible run towards 1.1904 on the weekly scale.
For traders still long from 1.21, specifically the H4 bullish engulfing candle, there’s little you can do at the moment except wait for a move to take shape. Ultimately, you’ll need a H4 close above 1.22 before reducing risk to breakeven.
AUD/USD:
Recent sessions witnessed the Australian dollar eke out marginal gains vs. the US dollar, consequently breaking a twelve-day losing streak. With limited directional cues of late, however, except receding trade tensions and comments concerning the Fed, the pair is likely to struggle around multi-month lows.
For those who read Tuesday’s briefing you may recall the following:
Should the H4 candles retest 0.68 (H4) for a second time and produce a bearish candlestick signal (entry/risk parameters can be sited according to the candlestick structure), this could be an opportunity to take advantage of the weakening Aussie dollar.
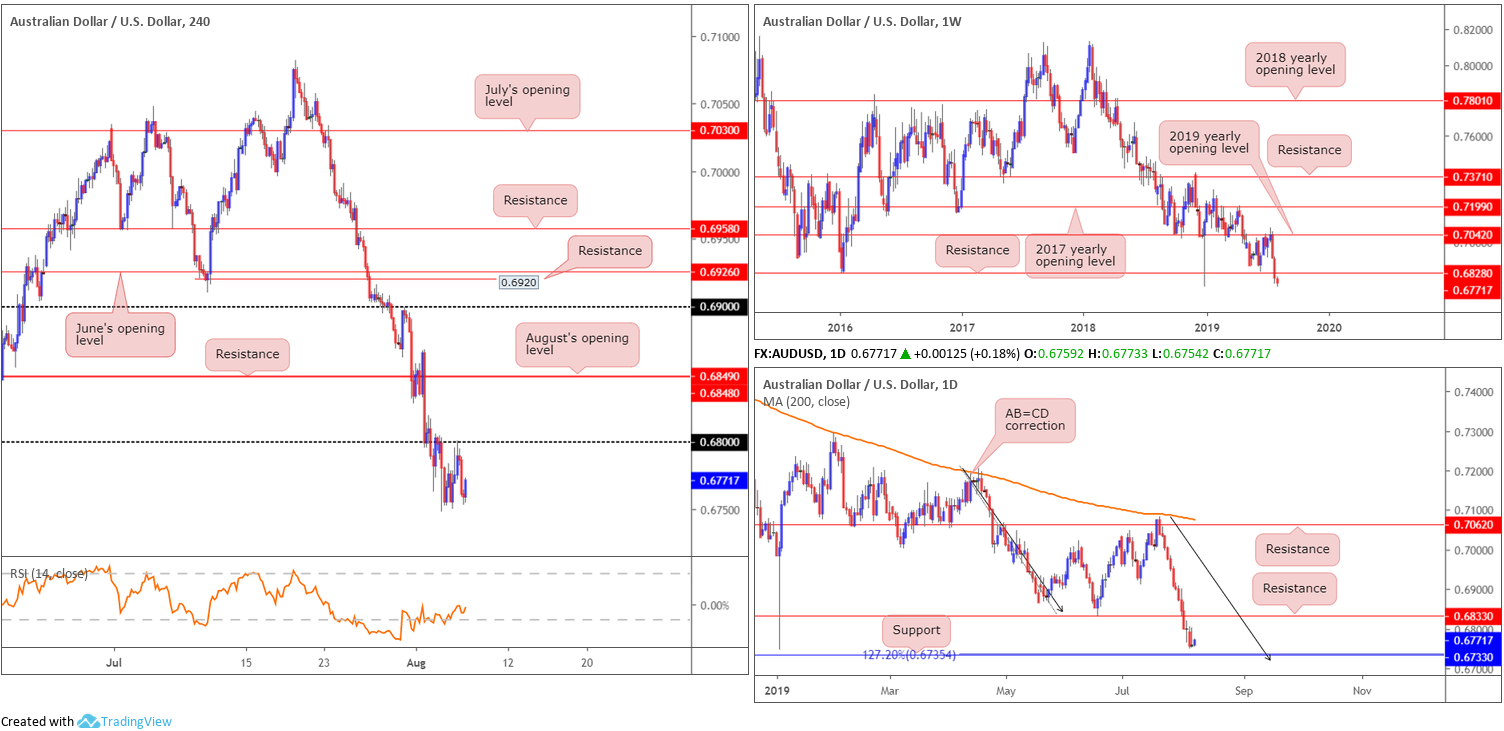
As is evident from the H4 timeframe this morning, the candles retested the underside of 0.68 to the point, and receded lower following a bearish inside candlestick pattern. Well done to any of our readers who managed to jump aboard this move.
At this point, it’s worth reminding ourselves where we’re positioned on the bigger picture:
From the weekly timeframe this morning, price action remains languishing beneath notable support at 0.6828 (now potentially serving as resistance), extending the pullback from the 2019 yearly opening level (resistance) at 0.7042. The next support is not visible until 0.6395 on this timeframe (not seen on the screen).
In tandem with weekly price, daily flow engulfed the 0.6833 June 18 low last Thursday (now acting resistance), though is seen closing in on the next support target at 0.6733, which happens to merge with a 127.2% AB=CD (black arrows) formation at 0.6735.
Areas of consideration:
For those short this market, the next port of call to the downside falls in around daily support at 0.6733, closely followed by the 0.67 handle on the H4 timeframe.
USD/JPY:
The recovery in risk appetite Tuesday helped safe havens unwind, with the Japanese yen and Swiss franc lower on the day, though US Treasuries and XAU concluded in positive territory.
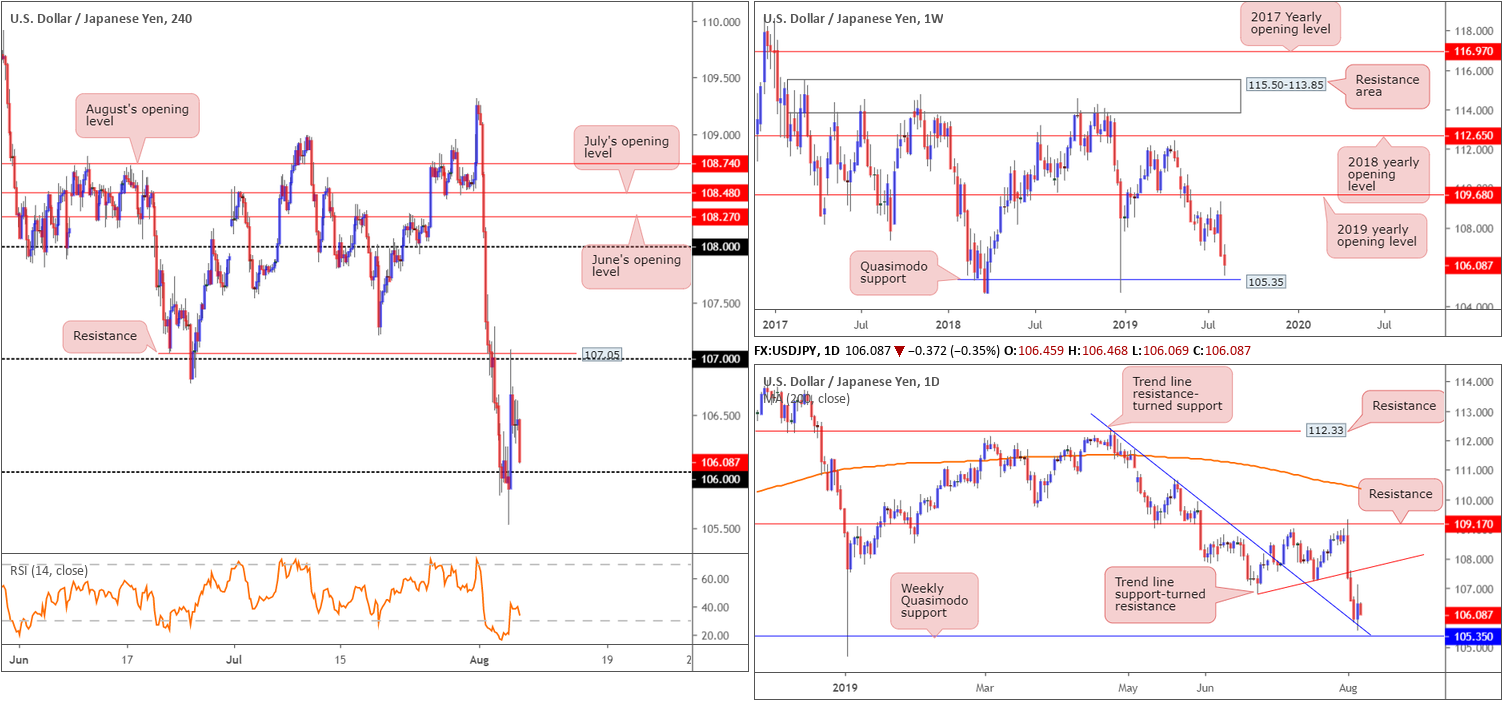
The USD/JPY rose to a session high of 107.09, unable to penetrate through the 107 handle on the H4 timeframe and its merging resistance at 107.05. This was a beautiful shorting opportunity in hindsight, though chancy given we were coming off daily trend line resistance-turned support (extended from the high 112.40).
As we enter Asia hours, the H4 candles are fast approaching 106 as the RSI indicator pops back above oversold terrain. In terms of where we stand on the weekly timeframe, limited support is visible until shaking hands with a Quasimodo formation at 105.35, sited just south of the noted daily trend line support.
Areas of consideration:
The possibility of selling beyond 106 is present on the weekly timeframe, and having seen the daily trend line support now merge closely with weekly support at 105.35, shorts beyond 106 are an option today. Traders have the choice of entering based on the breakout candle structure, or seeing if price action retests 106 as resistance before continuing to explore lower ground (traders can enter on the back of the rejecting candlestick structure). The latter is the favoured route, targeting weekly support mentioned above at 105.35.
USD/CAD:
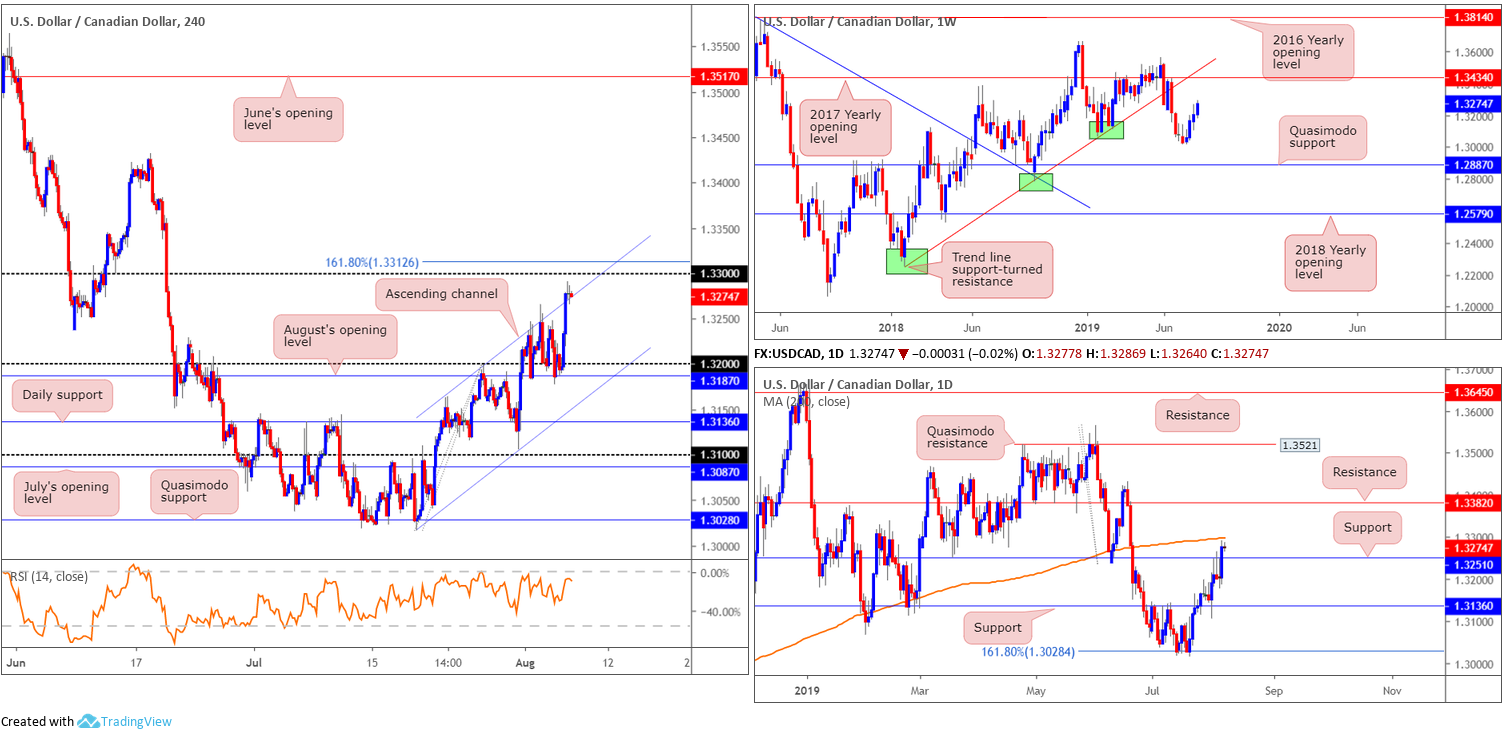
Having seen oil markets explore a southerly trajectory Tuesday as well as the US dollar index reclaim a portion of Monday’s lost ground, the USD/CAD market caught a strong bid off 1.32 and overthrew H4 channel resistance (extended from the high 1.3199). As can be seen from the H4 timeframe, the next upside hurdle falls in around the 1.33 handle, closely shadowed by a 161.8% Fibonacci ext. point at 1.3312.
Recent buying also lifted the daily candles above resistance at 1.3251 (now acting support), potentially clearing the pathway to the 200-day SMA plotted nearby at 1.3298.
Areas of consideration:
Keeping it simple this morning, the area between the 161.8% Fibonacci ext. point at 1.3312 on the H4 timeframe and the 200-day SMA at 1.3298 is likely to inhabit active sellers. Therefore, should a H4 bearish candlestick form from this area, a short on the back of this structure is worthy of consideration. Ideally, you’ll want to see the unit climb back below the H4 channel resistance before reducing risk to breakeven, with daily support at 1.3251 set as the next downside target.
USD/CHF:
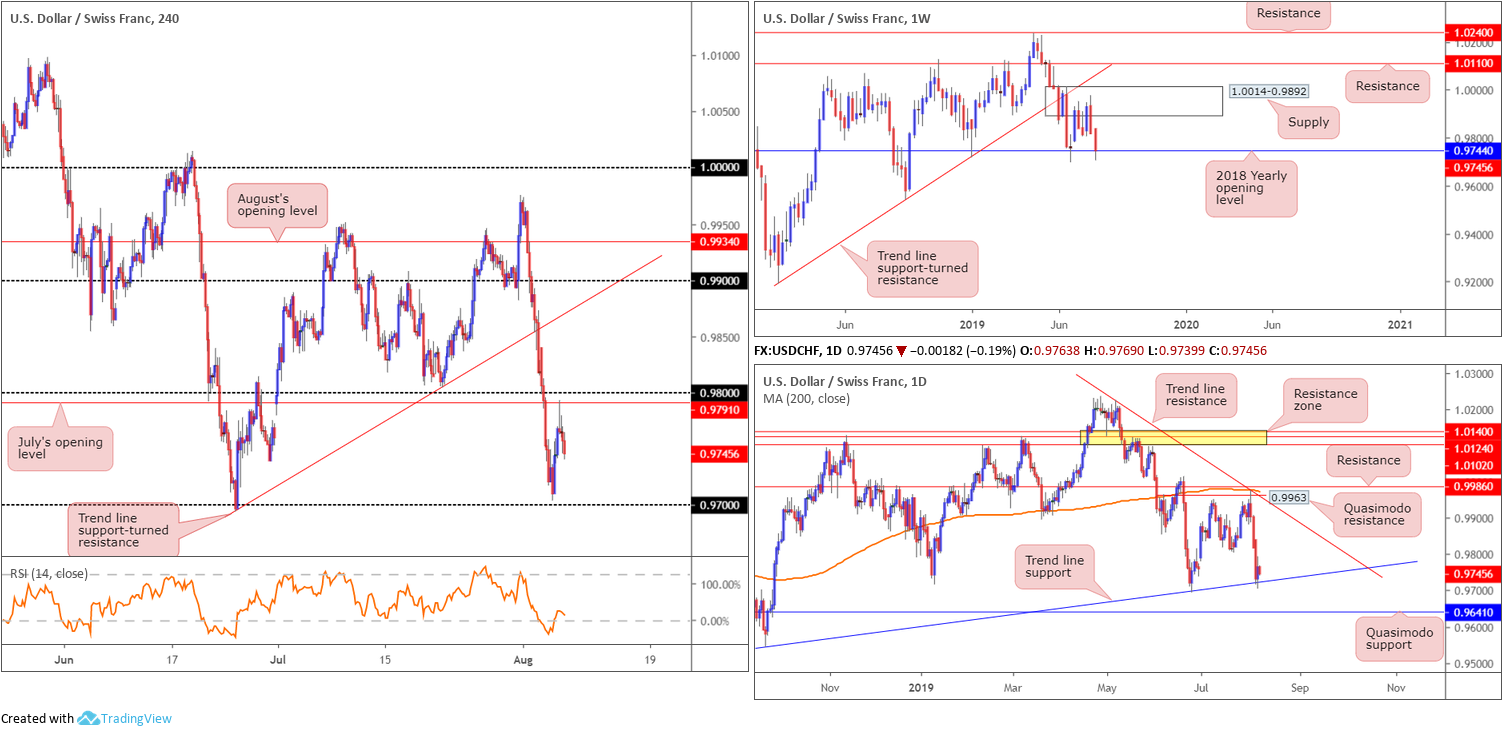
Improved risk sentiment Tuesday weighed on the Swiss franc’s safe-haven status, lifting the USD/CHF higher and snapping a three-day losing streak. Gains, despite being bolstered by daily trend line support (etched from the low 0.9542), however, were swiftly contained by July’s opening level on the H4 timeframe at 0.9791, closely shadowed by the 0.98 handle. Continued selling from this point may bring the candles towards the 0.97 neighbourhood.
On more of a broader outlook, weekly price overthrew the 2018 yearly opening level at 0.9744 in recent trade, though is showing signs of recovery. A move higher from here could lead to a revisit of supply at 1.0014-0.9892, whereas a close beneath 0.9744 may prompt a move towards the September 17 low 0.9542.
Areas of consideration:
Having seen weekly support at 0.9744 remain in the fold, and daily price respect trend line support, buyers are beginning to show some signs of life. The only grumble is H4 price offers limited support to take advantage of any up move at this time.
Logically, the H4 candles need to engulf 0.98 to the upside, consequently unlocking the door to trend line support-turned resistance (take from the low 0.9693), before serious longs will likely look to get involved. Until that time, opting to remain on the sidelines may be the better path to take, traders…
Dow Jones Industrial Average:
Driven by optimism that currency tensions between the United States and China would ease, the Dow Jones Industrial Average and the broader US stock market rebounded Tuesday. The Dow added 311.78 points, or 1.21%; the S&P 500 also added 37.03 points, or 1.30% and the Nasdaq advanced 105.63 points, or 1.42%.
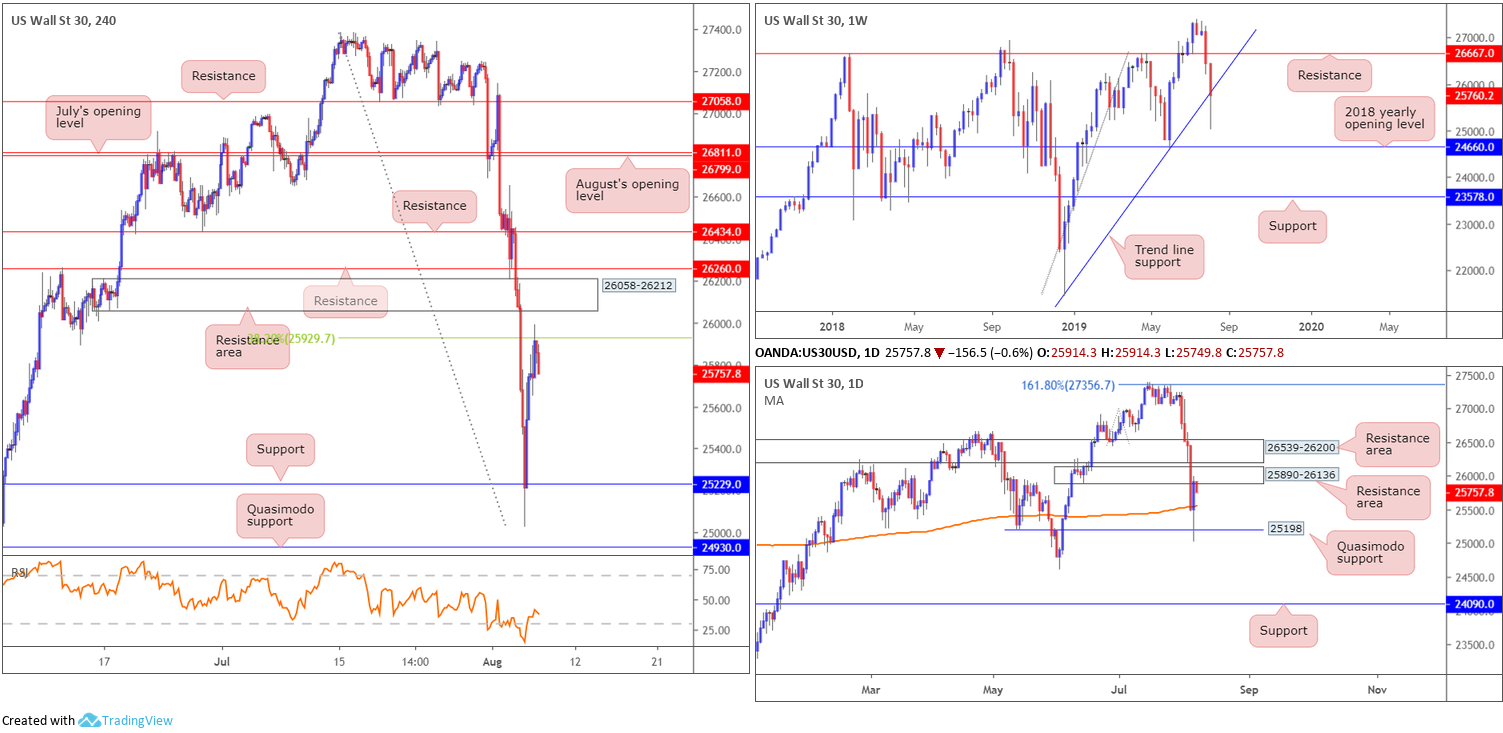
Viewing the Dow’s technical charts, the research team notes weekly price attempting to hold trend line support (etched from the low 21452) following a sharp move to lows of 25024. Contrary to the weekly timeframe’s structure, daily movement recently crossed swords with a resistance area at 25890-26136 after rebounding from Quasimodo support at 25198. A rejection from here, however, may struggle to overcome the 200-day SMA currently circulating around the 25571 mark. Traders may also want to acknowledge that there’s another layer of resistance sited just north at 26539-26200.
A closer reading of price action on the H4 timeframe reveals support at 25229 held ground, permitting an advance towards the 38.2% Fibonacci retracement at 25929. Note just north of this barrier, we also have a resistance area in place at 26058-26212.
Areas of consideration:
As the 38.2% Fibonacci retracement at 25929 on the H4 timeframe converges with the underside of the daily resistance area at 25890-26136, additional downside may be on the cards. However, traders may also want to pencil in the possibility of a move to the H4 resistance area at 26058-26212 today, having seen this zone shadow the top edge of the current daily resistance zone. In fact, the noted H4 resistance area is also actually glued to the underside of the next layer of daily resistance at 26539-26200.
Should the H4 candle close as is, this is a strong cue sellers may want to take things lower, targeting at least the 200-day SMA at 25571 – entry can be found at the close of the candle, with a protective stop-loss order positioned above its high.
XAU/USD (GOLD):
Despite a recovery in risk appetite Tuesday, bullion concluded the day in positive territory vs. the dollar.
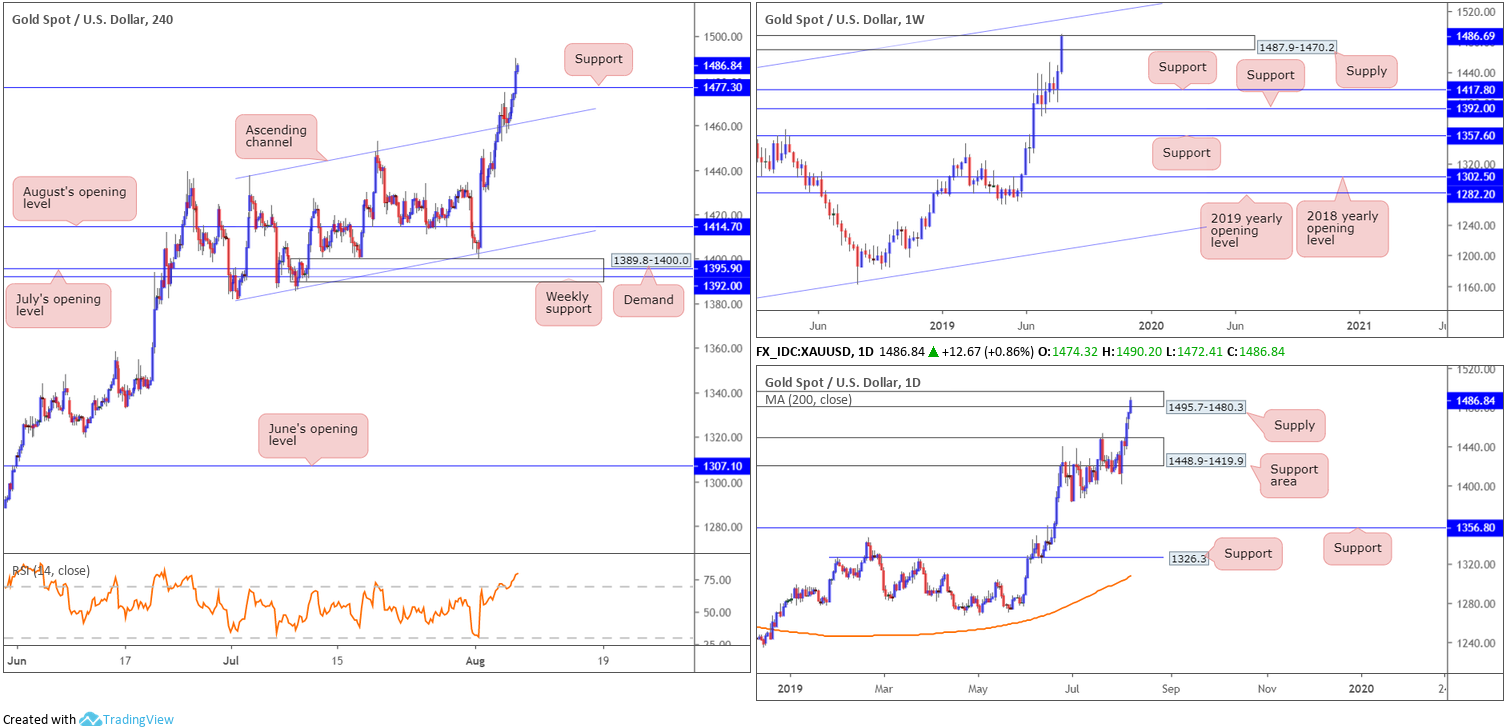
From a technical perspective, weekly supply at 1487.9-1470.2 is under pressure thanks to recent buying, with the top edge of its base suffering a mild breach. Further buying here could eventually land the yellow metal at long-term channel resistance taken from the high 1375.1. The story on the daily timeframe, nevertheless, shows the unit crossed paths with supply at 1495.7-1480.3, after engulfing supply at 1448.9-1419.9 (now acting support area). This area, therefore, could help save the aforementioned weekly supply from total annihilation.
In terms of the H4 timeframe, we can see the candles brushed aside resistance at 1477.3 with relative ease yesterday (now acting support), testing highs of 1490.2. Indicator-based traders may also want to take into account the RSI is seen driving deeper into overbought territory.
Areas of consideration:
Traders focusing on the H4 timeframe likely have eyes on a potential retest play off 1477.3 today, as a simple buy-the-dip scenario within the current uptrend. A fakeout through 1477.3 to H4 channel resistance-turned support (extended from the high 1437.7 is a possibility, however, given we are coming from daily supply at 1495.7-1480.3, so do bear that in mind if entering without additional trade confirmation.
The accuracy, completeness and timeliness of the information contained on this site cannot be guaranteed. IC Markets does not warranty, guarantee or make any representations, or assume any liability regarding financial results based on the use of the information in the site.
News, views, opinions, recommendations and other information obtained from sources outside of www.icmarkets.com.au, used in this site are believed to be reliable, but we cannot guarantee their accuracy or completeness. All such information is subject to change at any time without notice. IC Markets assumes no responsibility for the content of any linked site.
The fact that such links may exist does not indicate approval or endorsement of any material contained on any linked site. IC Markets is not liable for any harm caused by the transmission, through accessing the services or information on this site, of a computer virus, or other computer code or programming device that might be used to access, delete, damage, disable, disrupt or otherwise impede in any manner, the operation of the site or of any user’s software, hardware, data or property.


