
Waiting for lower timeframe confirmation is our main tool to confirm strength within higher timeframe zones, and has really been the key to our trading success. It takes a little time to understand the subtle nuances, however, as each trade is never the same, but once you master the rhythm so to speak, you will be saved from countless unnecessary losing trades. The following is a list of what we look for:
- A break/retest of supply or demand dependent on which way you’re trading.
- A trendline break/retest.
- Buying/selling tails/wicks – essentially we look for a cluster of very obvious spikes off of lower timeframe support and resistance levels within the higher timeframe zone.
We typically search for lower-timeframe confirmation between the M15 and H1 timeframes, since most of our higher-timeframe areas begin with the H4. Stops are usually placed 1-3 pips beyond confirming structures.
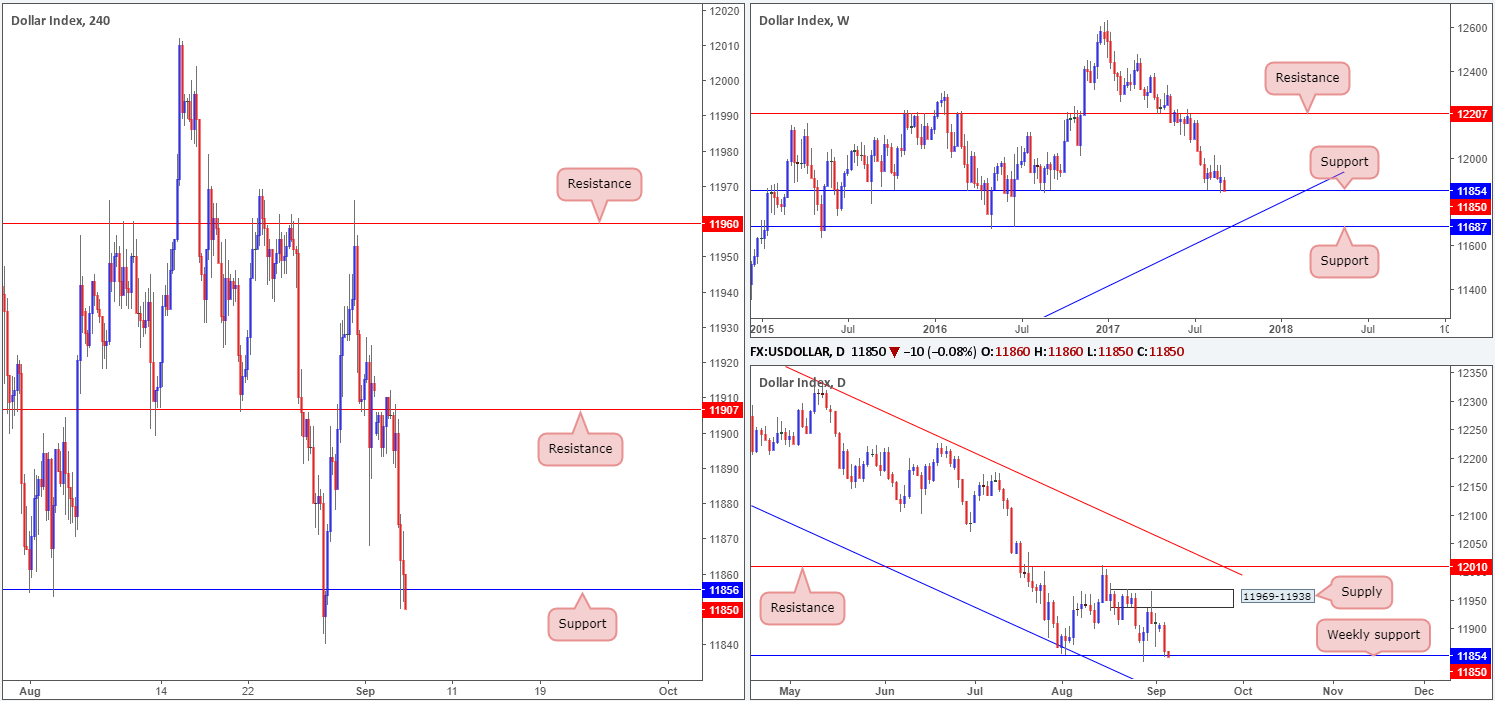
US dollar index (USDX):
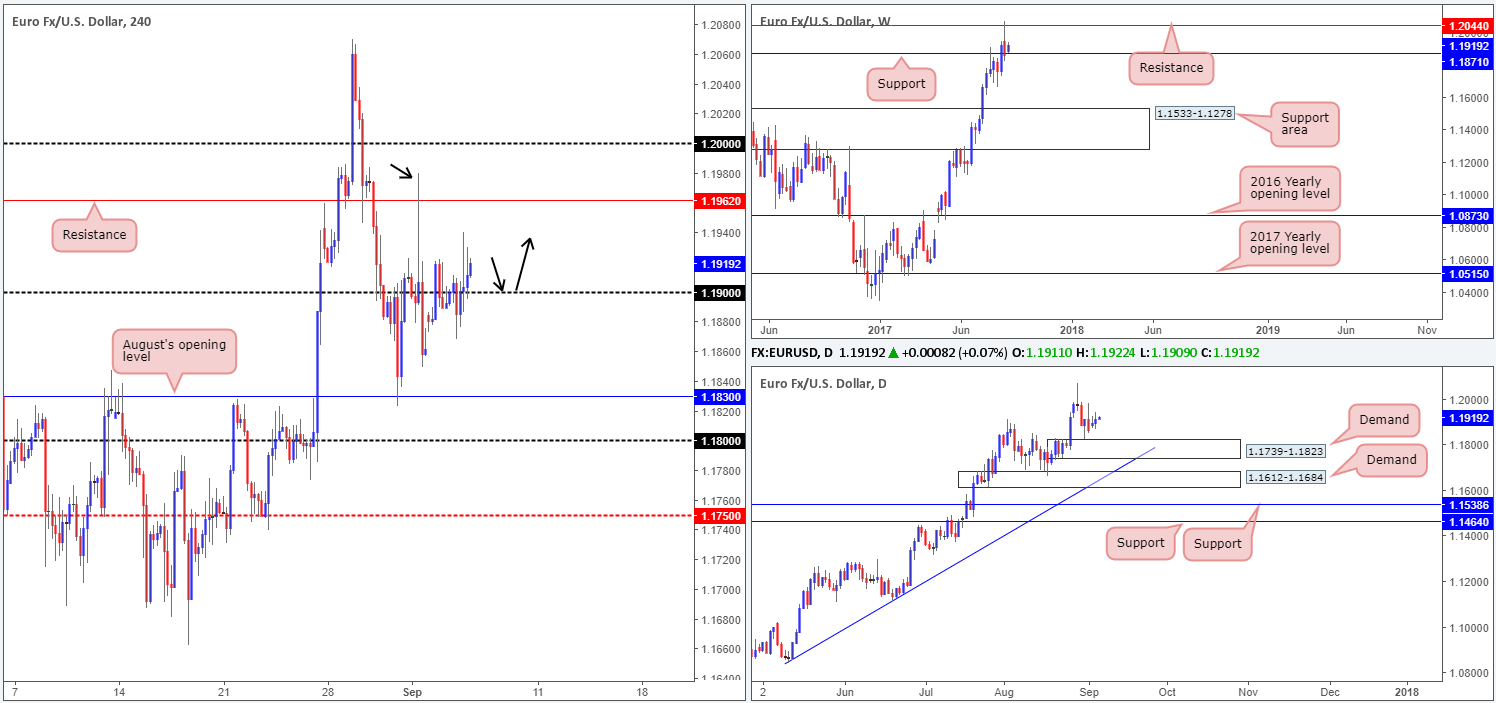
EUR/USD:
Across the board, the greenback plummeted on Tuesday following dovish comments from Fed Governor Brainard, consequently forcing the single currency above the 1.19 handle amid early US trading. Technically speaking, this move should have been expected. Weekly action shows price shaking hands with a support level pegged at 1.1871, and daily price recently bounced nicely from demand coming in at 1.1739-1.1823.
As of current price, however, the tide may be changing as the USDX is seen trading from a weekly support at 11854, which boasts strong historical history. Therefore, the EUR may struggle to reach its next upside H4 target: resistance at 1.1962.
Suggestions: Although all three timeframes on the EUR suggest further buying may take place up to at least H4 resistance at 1.1962 (H4 consumption wick marked with a black arrow at 1.1979 shows that offers may be weak here), and quite possibly the large psychological boundary 1.20, we’re still wary due to where price is trading on the USDX!
Given the above factors, we would want to see H4 price retest 1.19 as support (see black arrows) and hold firm in the shape of a full, or near-full-bodied bullish candle, before looking to buy this market and targeting 1.1962/1.20.
Data points to consider: US ISM non-manufacturing PMI at 3pm GMT+1.
Levels to watch/live orders:
- Buys: 1.19 region ([waiting for a reasonably sized H4 bullish candle to form – preferably a full, or near-full-bodied candle – is advised] stop loss: ideally beyond the candle’s tail).
- Sells: Flat (stop loss: N/A).
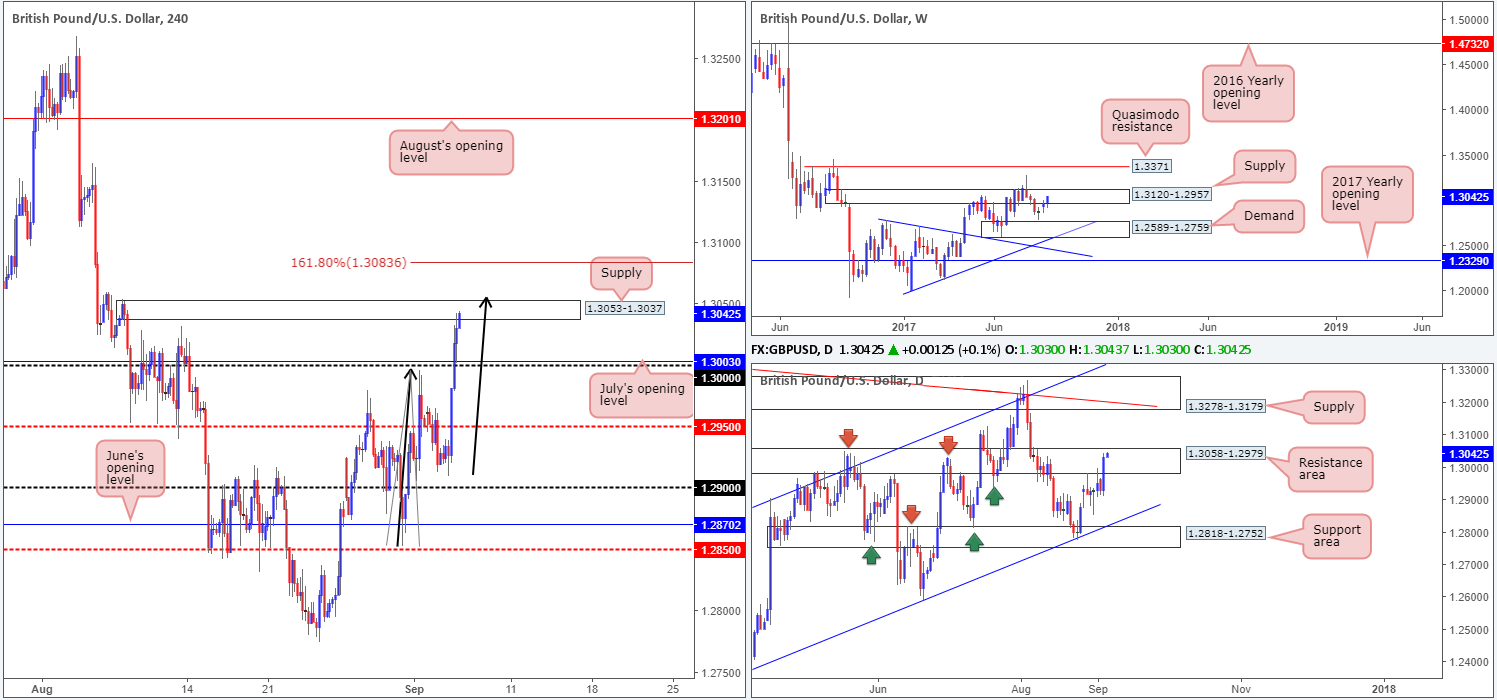
GBP/USD:
A spineless greenback helped GBP bulls find their feet early on in yesterday’s London morning segment. The advance, shaped by a number of strong consecutive H4 bull candles, ran through multiple tech resistances and ended the day kissing the underside of a supply penciled in at 1.3053-1.3037. Despite this, we may see this area faked before sellers step into the fray, since there is a potential AB=CD formation (see black arrows) seen just above at 1.3057.
Looking over to the bigger picture, weekly price remains teasing the underside of a supply base coming in at 1.3120-1.2957. Should the USDX weekly support at 11854 hold ground, this could bolster weekly sellers from the current supply zone and eventually send the unit back down to demand penciled in at 1.2589-1.2759. In conjunction with the weekly timeframe, daily price recently drove high into the walls of a resistance area at 1.3058-1.2979. Given its strong history dating back to mid-May, we feel this zone will likely provide resistance and ultimately push cable down to the support area seen below at 1.2818-1.2752 that converges with a channel support line taken from the low 1.2365.
Suggestions: A short from the H4 AB=CD completion point at 1.3057, with stops planted above its 161.8% Fib ext. level at 1.3083, could be an option today. First take-profit target, for us, would be the 1.30 region.
Data points to consider: US ISM non-manufacturing PMI at 3pm GMT+1.
Levels to watch/live orders:
- Buys: Flat (stop loss: N/A).
- Sells: 1.3057 (stop loss: 1.3086).
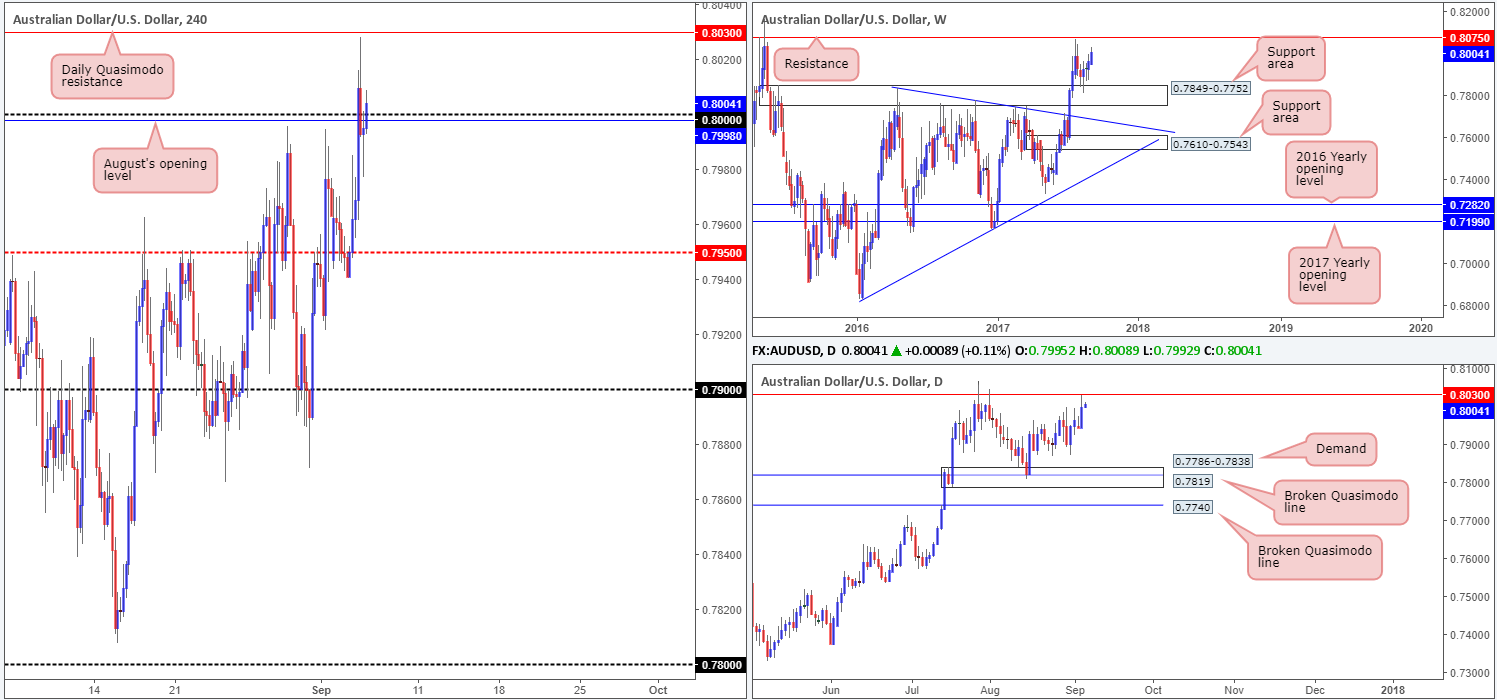
AUD/USD:
Bolstered by a fading US dollar, the commodity currency shifted northbound on Tuesday. The move saw price aggressively break through the 0.80 psychological boundary and come within a few pips of testing a daily Quasimodo resistance level at 0.8030. As of current price, the unit remains above 0.80, despite an earnest attempt from sellers to push lower during the US morning segment.
With 0.80 likely being a sensitive point in this market, let’s see how land lies on the higher timeframes. Since weekly price linked with the support area at 0.7849-0.7752 three weeks ago, the unit has remained reasonably well-bid. The next objective, assuming that price continues to push north, can be seen around resistance drawn from 0.8075. Before weekly action can reach the noted resistance, however, let’s not forget that daily action must first consume the Quasimodo resistance mentioned above at 0.8030.
Suggestions: In light of the above, we would not want to be a seller at 0.80 given the room seen to move higher on the bigger picture. Similarly, we would be uncomfortable buying above 0.80 seeing how close the daily Quasimodo resistance is located. In addition to this, a sell from the daily Quasimodo opens one up to the possibility of being faked up to the weekly resistance at 0.8075. Therefore, the only place of interest right now, in our opinion, is the said weekly resistance level, which happens to stretch as far back as 1997! Whether or not this will turn to be a valid sell zone will depend entirely on how H4 price action responds. Ideally, we’d want a strong bearish candle to form from here in the shape of a full, or near-full-bodied candle.
Data points to consider: Australian growth figures at 2.30am. US ISM non-manufacturing PMI at 3pm GMT+1.
Levels to watch/live orders:
- Buys: Flat (stop loss: N/A).
- Sells: 0.8075 region ([waiting for a reasonably sized H4 bearish candle to form – preferably a full, or near-full-bodied candle – is advised] stop loss: ideally beyond the candle’s wick).
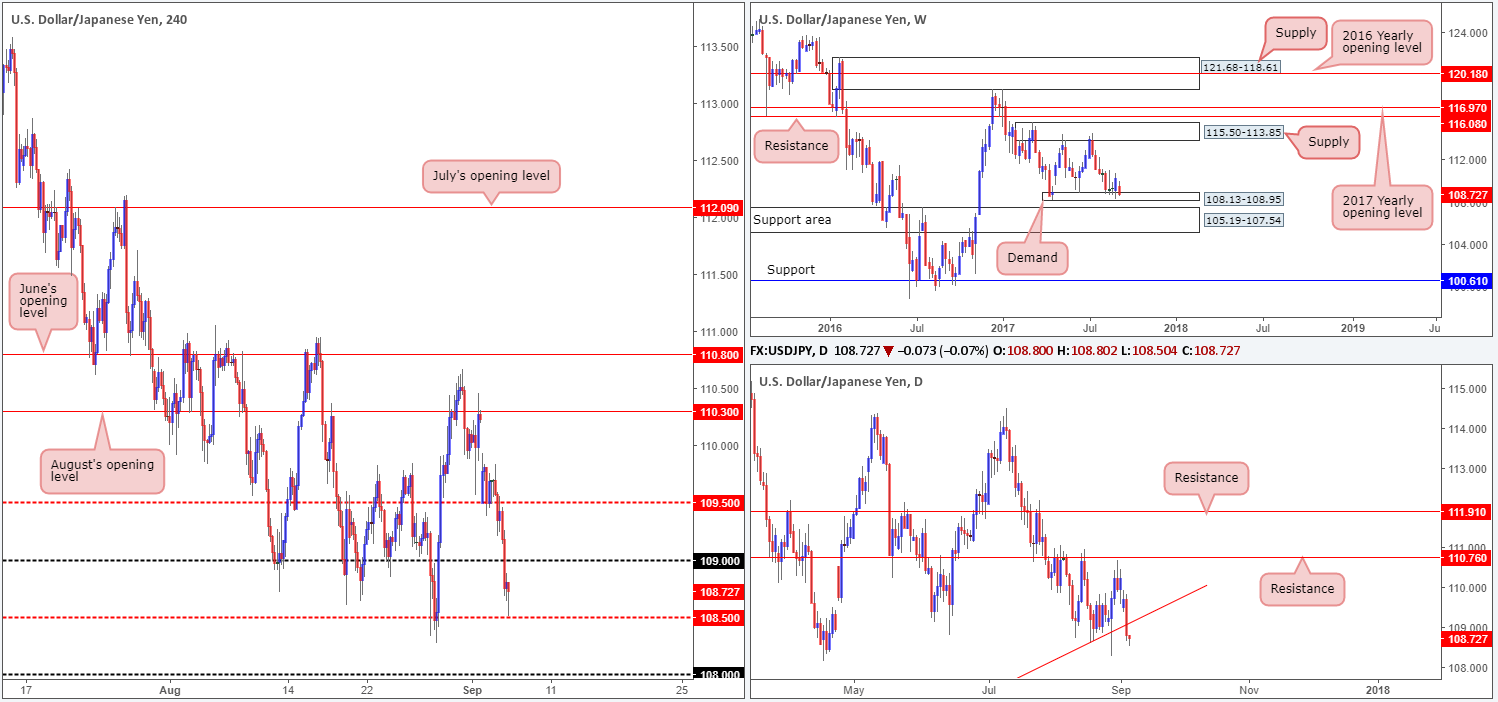
USD/JPY:
According to weekly structure, demand at 108.13-108.95 is struggling to hold firm at the moment. A violation of this zone could see the pair sink into a nearby support area fixed at 105.19-107.54. Recent action on the daily timeframe reveals that price crossed below a trendline support extended from the low 100.08, thus further confirming weakness within the said weekly demand area. The story on the H4 timeframe, however, shows that yesterday’s dollar selloff dragged price below the 109 handle and eventually into the jaws of a mid-level support drawn from 108.50.
Suggestions: A buy from 108.50, considering the weakness being seen on the higher timeframes right now, would not be a trade we’d label high probability. Similarly, a short below 108.50 would also be an uncomfortable short, given that price remains within a weekly demand area, although weak looking at this time.
With the above points in mind, our team’s position will remain flat going into today’s sessions.
Data points to consider: US ISM non-manufacturing PMI at 3pm GMT+1.
Levels to watch/live orders:
- Buys: Flat (stop loss: N/A).
- Sells: Flat (stop loss: N/A).
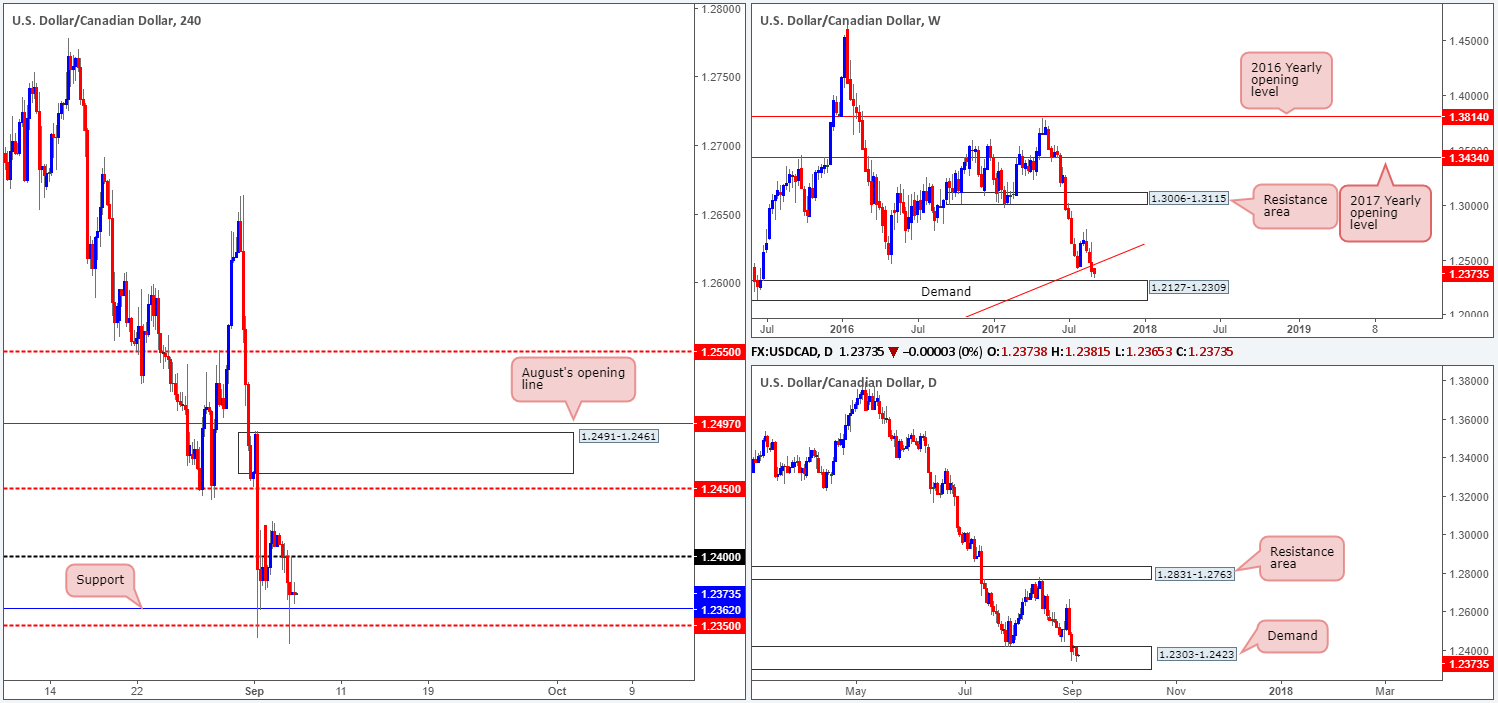
USD/CAD:
During the course of yesterday’s sessions, the pair failed to sustain gains above the 1.24 handle and proceeded to drive lower and retest H4 mid-level support at 1.2350/H4 support at 1.2362. Despite a second bounce being seen from this area, the bulls are not registering much intent to push higher.
Last week, weekly price hammered its way through a long-term weekly trendline support extended from the low 0.9633, which, technically speaking, has likely set the stage for further selling this week down to demand penciled in at 1.2127-1.2309. On the other side of the field, nevertheless, daily price remains trading within the walls of a demand area at 1.2303-1.2423 drawn from as far back as June 2015.
Suggestions: To our way of seeing things right now, the bears look to have the upper hand in this market right now, even though daily action is sited within demand.
Preferably, we would love to be sellers in this market given the pair’s underlying trend. However, selling into daily demand and H4 support is just too risky for our liking. In regard to longs, we would not feel comfortable buying this market above 1.24 due to weekly price showing room to drive lower. To that end, the only place of interest is the 1.23 handle due to its location on the higher timeframes (positioned just three pips below daily demand, and sited within the top edge of weekly demand). For us, we would look to place stops below the H4 low @ 1.2276 formed on the 24thJune 2015, and target 1.2350 as an initial take-profit level.
Data points to consider: US ISM non-manufacturing PMI at 3pm. Canadian trade balance at 1.30pm, BOC meeting at 3pm GMT+1.
Levels to watch/live orders:
- Buys: 1.23 region (stop loss: 1.2274).
- Sells: Flat (stop loss: N/A).
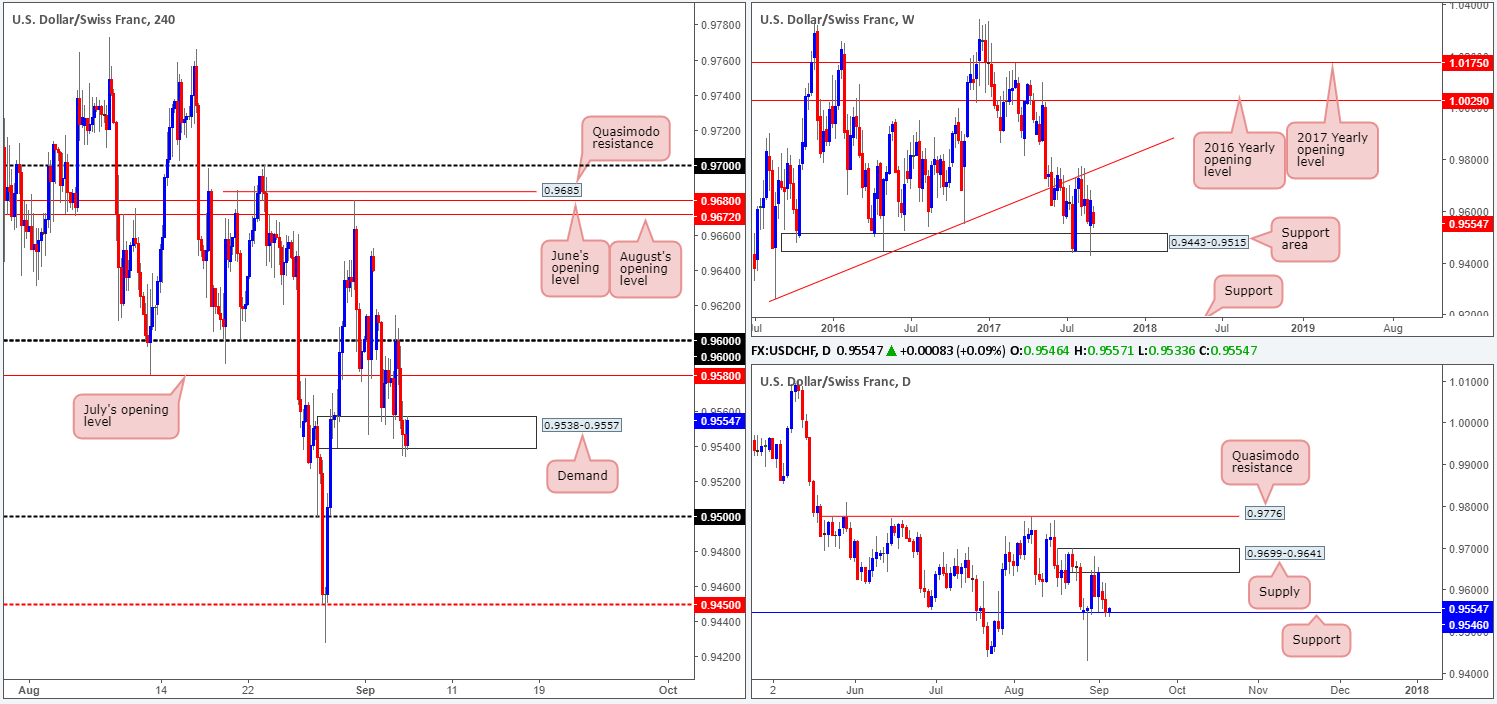
USD/CHF:
Going into the early hours of yesterday’s London segment, the pair continued to retrace after failing to sustain gains beyond the 0.96 mark. The day ended with the unit marginally breaching the lower edge of a H4 demand zone at 0.9538-0.9557, which, as you can probably see, intersects nicely with daily support at 0.9546.
Despite recent developments, this is still a tricky market to trade at the moment. A long from the current demand is unfortunately clouded by nearby resistance: July’s opening level planted at 0.9580, followed closely by the 0.96 line. A close below H4 demand on the other hand opens up downside to 0.95 according to H4 structure. However, price could potentially halt before we reach this barrier seeing as the top edge of the weekly support area is lodged at 0.9515.
Suggestions: Owing to the above notes, there’s very little to hang our hat on at this time. Therefore, remaining on the sidelines and awaiting further developments is the route we’ve chosen to take.
Data points to consider: US ISM non-manufacturing PMI at 3pm GMT+1.
Levels to watch/live orders:
- Buys: Flat (stop loss: N/A).
- Sells: Flat (stop loss: N/A).
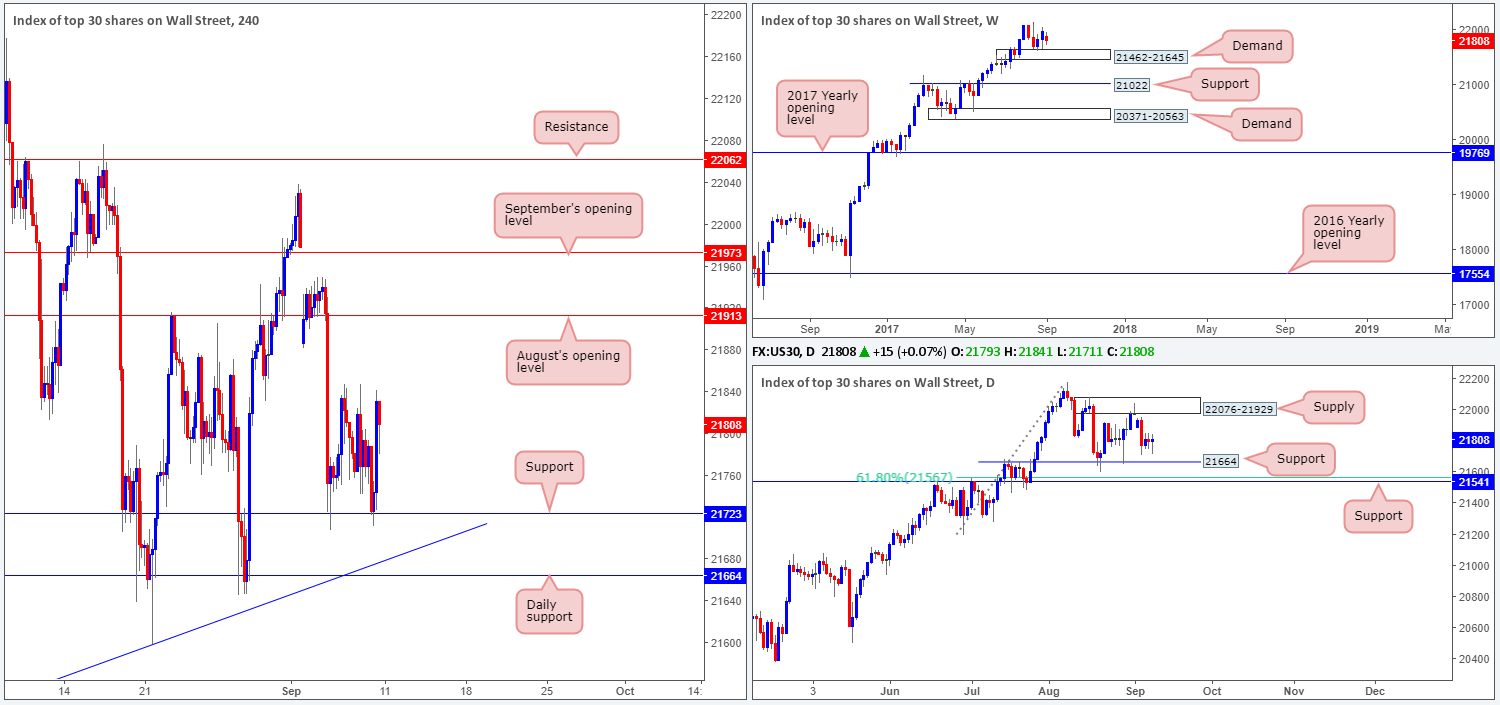
DOW 30:
August’s opening level at 21913 maintained support for the majority of yesterday’s London segment. It wasn’t until the early hours of US trade did the index turn red and aggressively dive lower. H4 price, as you can see, settled for the day beneath resistance at 21771, potentially opening up the possibility for further selling down to daily support etched out at 21664 (fuses nicely with H4 trendline support taken from the low 21484). Also of particular interest here is the top edge of the weekly demand at 21462-21645 is seen located only a few points below the said daily support.
Our suggestions: Despite the recent moves south, the US equity market is still entrenched within an incredibly strong uptrend. This – coupled with daily support, the top edge of a weekly demand and a H4 trendline support, makes for a nice-looking area to consider buying from (yellow rectangle). For aggressive traders, stops could be placed around the 21633 mark. For conservative traders, however, waiting for H4 price to prove buyer intent exists here in the shape of a full, or near-full-bodied bullish candle, may be the path to take.
Data points to consider: US ISM non-manufacturing PMI at 3pm GMT+1.
Levels to watch/live orders:
- Buys: 21664 region ([waiting for a reasonably sized H4 bullish candle to form – preferably a full, or near-full-bodied candle – is advised] stop loss: ideally beyond the candle’s tail).
- Sells: Flat (stop loss: N/A).
GOLD:
In recent trading, the yellow metal advanced higher following a beautiful to-the-pip retest of H4 support at 1325.9. The move from this line lifted the unit above weekly resistance at 1337.3, but has since formed little bullish intention. In fact, we would say, judging by the H4 candles (bearish wicks), that the bears are now in control for the time being. Therefore, we do not, even though daily price also closed above the weekly resistance level, consider this to be a bullish signal as of yet.
Our suggestions: Let price action unfold. What we mean by this is to wait and see if the H4 candles push back below the weekly resistance level. This, to us, would be considered a bearish signal and one worth trading back down to daily support at 1308.4. Also something you may want to consider is a H4 close beyond H4 support at 1325.9 could be used as a respectable trigger to reduce risk to breakeven.
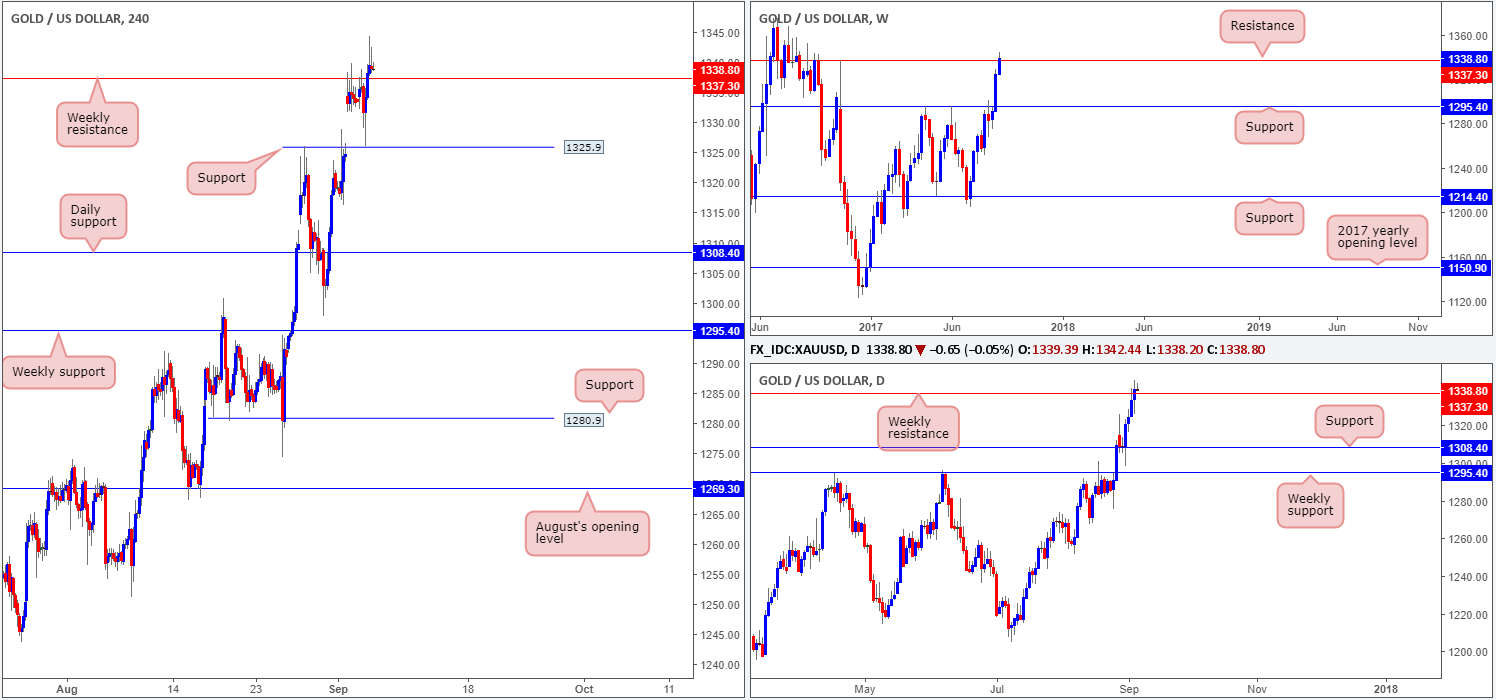
Levels to watch/live orders:
- Buys: Flat (stop loss: N/A).
- Sells: Watch for H4 price to close back below 1337.3 and then consider entering short (stop loss: 1355.9.


