
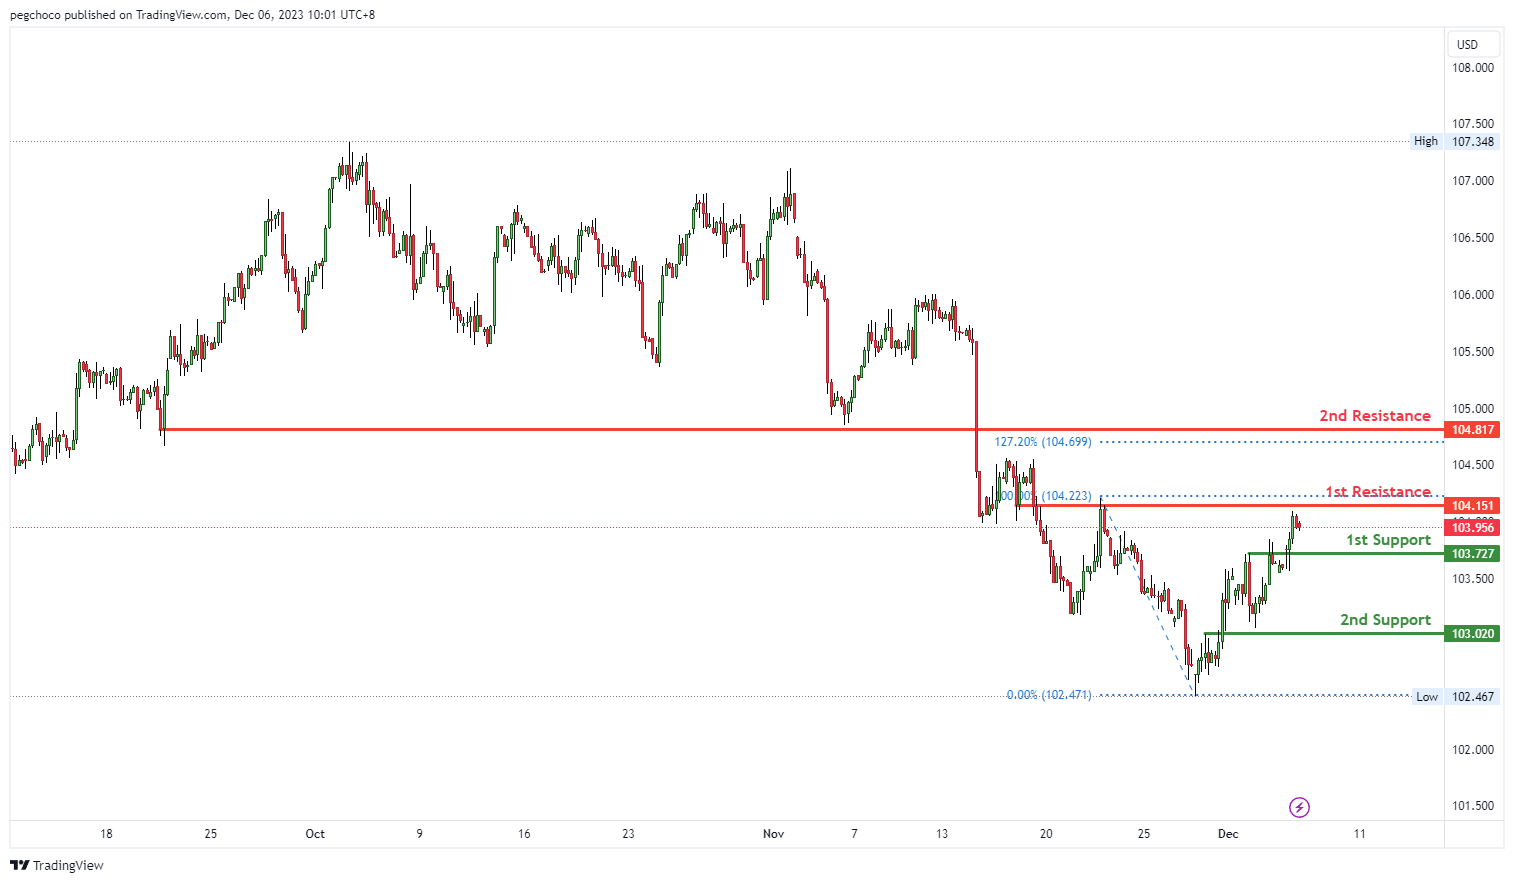
DXY:
The DXY (US Dollar Index) chart currently has a bearish overall momentum, and there’s potential for a bearish continuation towards the 1st support level.
The 1st support at 103.72 is categorized as a pullback support, suggesting that it could be a significant level where buying interest may emerge, potentially providing support for the DXY.
Further down, there is a 2nd support at 103.02, also identified as an overlap support. This reinforces the significance of this support level, suggesting it as a potential area where buyers might become active.
On the resistance side, the 1st resistance at 104.15 is noted as an overlap resistance. This implies that it’s a substantial barrier where selling interest could intensify, potentially triggering a bearish continuation.
The 2nd resistance at 104.81 is identified as a pullback resistance, further reinforcing the potential resistance factors for the DXY.
EUR/USD:
The EUR/USD chart currently has a bearish overall momentum, and there’s potential for a bearish reaction off the 1st resistance level.
On the support side, the 1st support at 1.0759 is identified as a pullback support, indicating that it could be a significant level where buying interest may emerge, potentially providing support for the EUR/USD pair.
Further down, there is a 2nd support at 1.0712, also noted as a pullback support. This reinforces the significance of this support level, suggesting it as a potential area where buyers might become active.
On the resistance side, the 1st resistance at 1.0880 is categorized as a pullback resistance. This implies that it’s a substantial barrier where selling interest could intensify, potentially triggering a bearish reaction.
The 2nd resistance at 1.0878 is identified as an overlap resistance, further reinforcing the potential resistance factors for the EUR/USD.

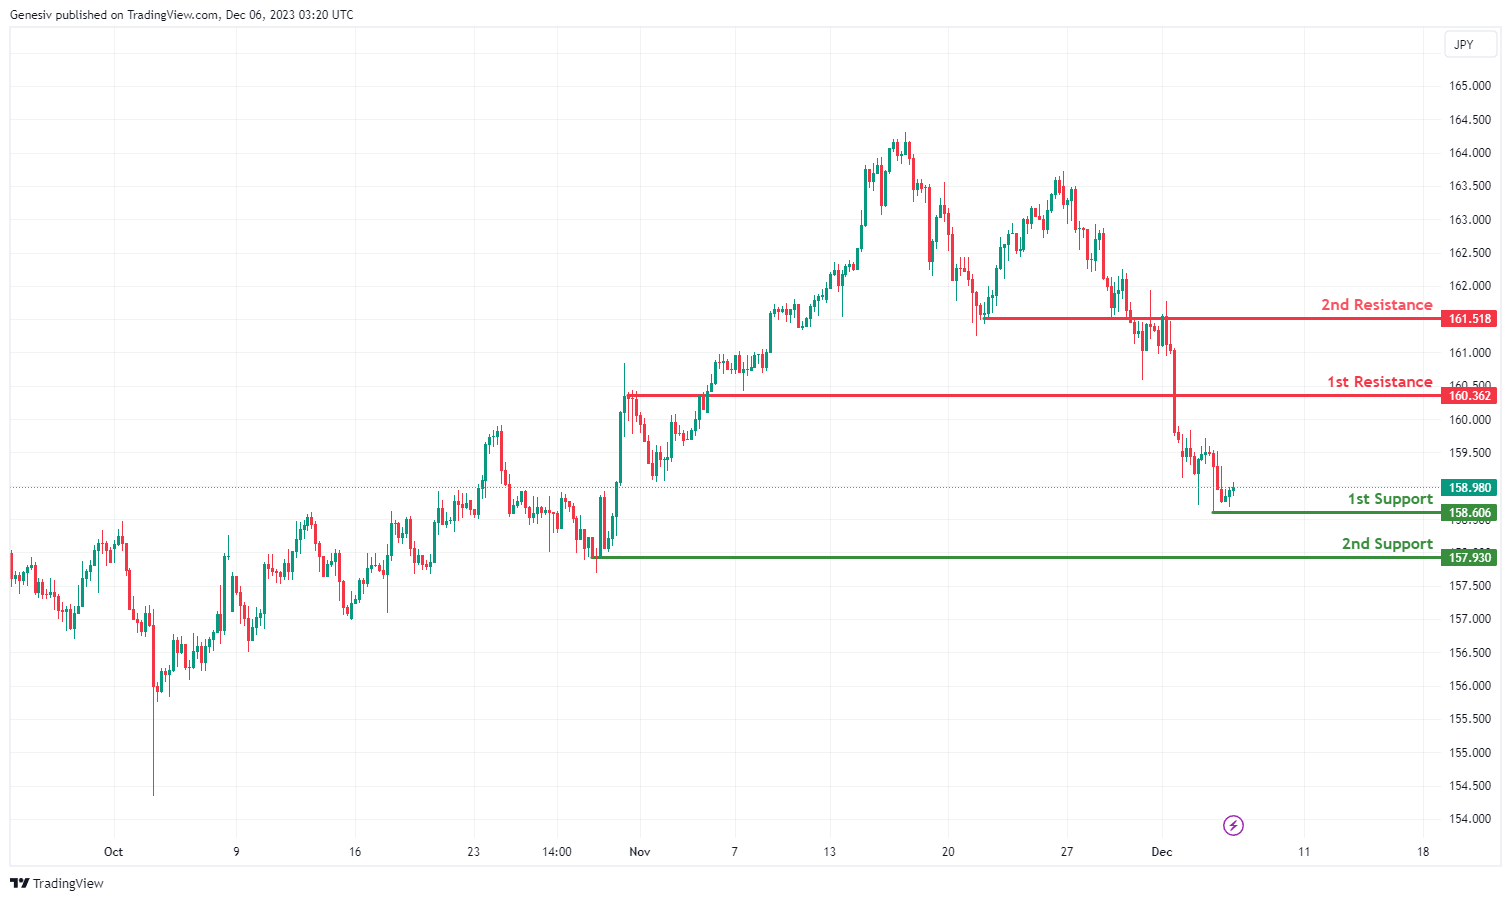
EUR/JPY:
The EUR/JPY chart currently has bullish overall momentum, indicating a prevailing upward trend.
1st Support at 158.61: This support level is at 158.61 and is considered strong because it’s based on a swing low support. Swing lows are significant points where the price has previously found buying interest and reversed its downward movement.
2nd Support at 157.93:The second support level is at 157.93 and is also based on a swing low support. This suggests that there is confluence in support around this area, making it a potentially robust support level.
1st Resistance at 160.36:The first resistance level at 160.36 is considered strong as it’s based on pullback resistance. A pullback resistance level is where the price has previously encountered selling pressure after a retracement from a previous move.
2nd Resistance at 161.52:The second resistance level is at 161.52 and is based on an overlap resistance. An overlap resistance occurs when multiple price movements have historically converged around a specific level, creating resistance.
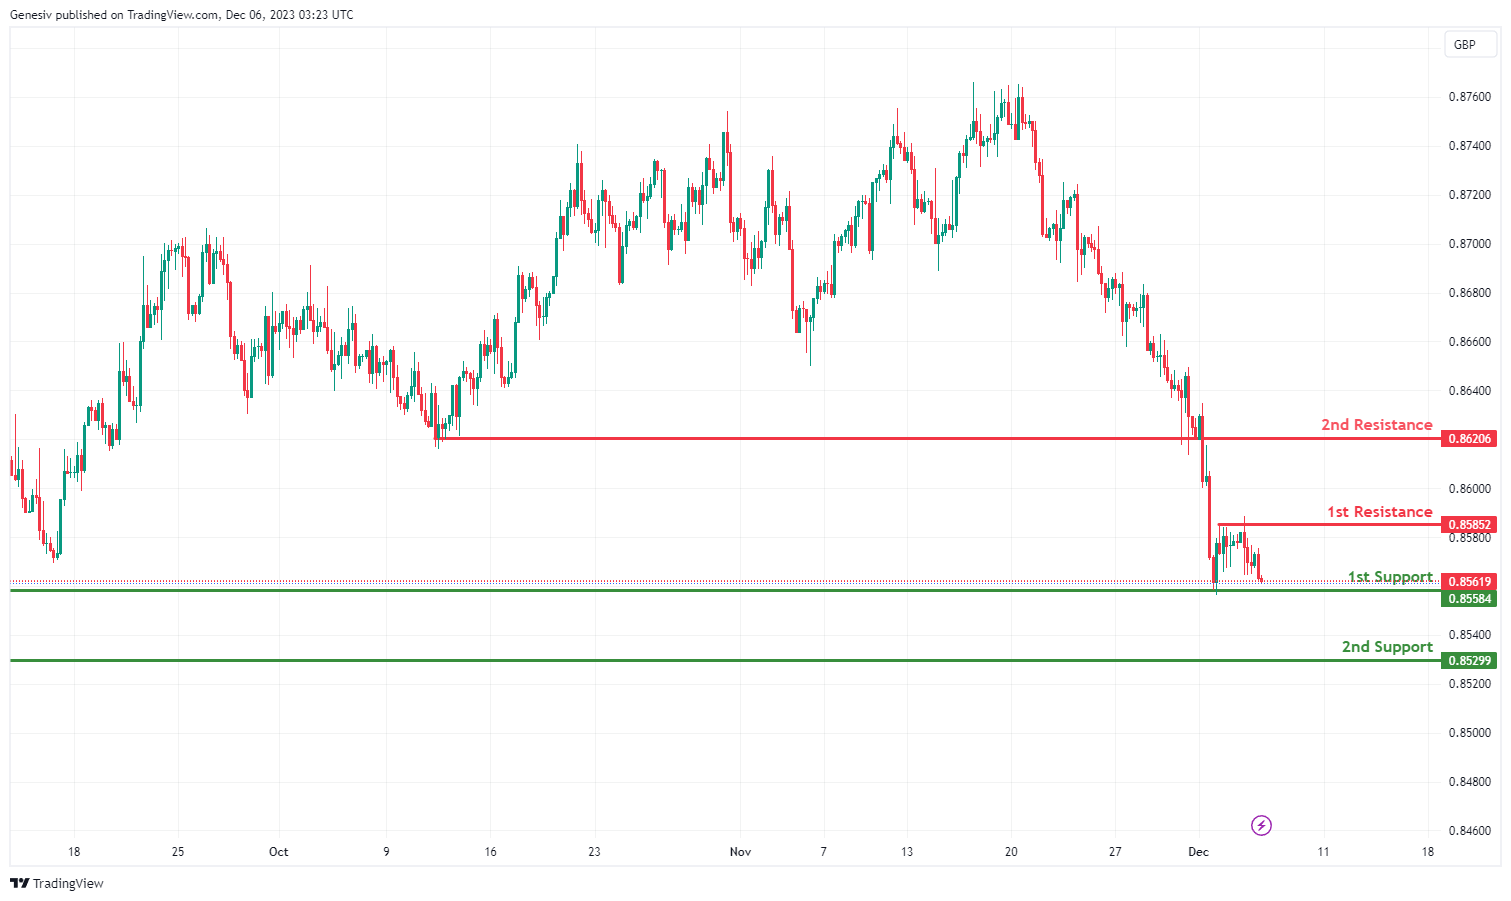
EUR/GBP:
The EUR/GBP chart currently has a bearish overall momentum, indicating a prevailing downward trend.
1st Support at 0.8558: This support level is at 0.8558 and is considered strong because it’s based on multi-swing low support. Multi-swing lows represent price levels where the currency pair has previously found support and reversed its downward movement.
2nd Support at 0.8530: The second support level is at 0.8530 and is based on a swing low support. This level also represents a point where the price has historically found support.Swing lows are important because they indicate potential areas where buyers might step in.
1st Resistance at 0.8585: The first resistance level at 0.8585 is considered strong as it’s based on pullback resistance. Pullback resistance levels are where the price has previously encountered selling pressure after a retracement from a previous decline.
2nd Resistance at 0.8621: The second resistance level is at 0.8621 and is based on an overlap resistance. An overlap resistance occurs when multiple price movements have historically converged around a specific level, creating resistance.
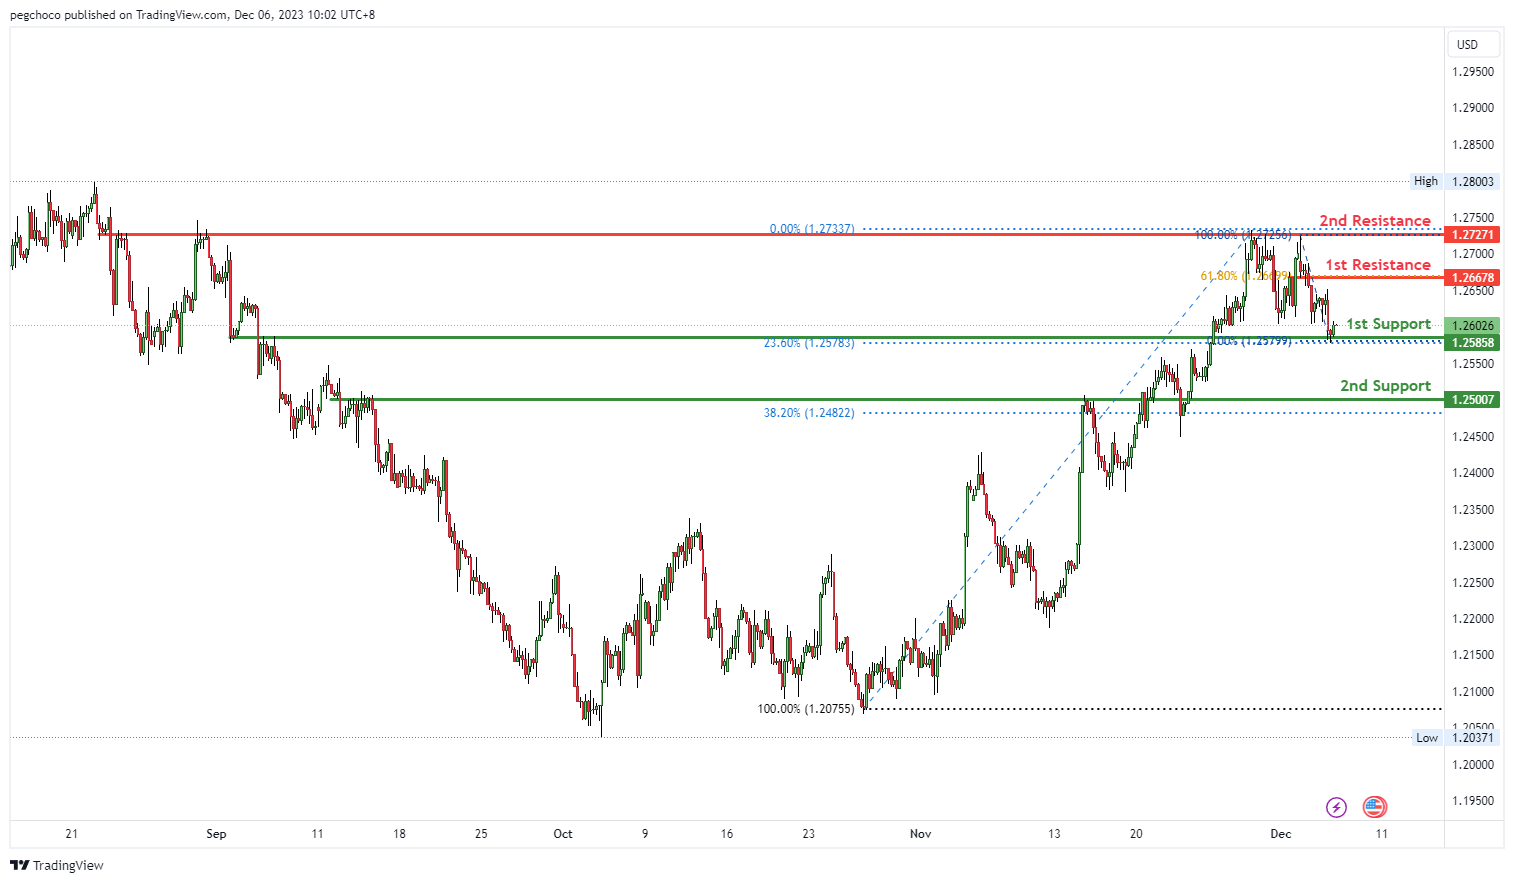
GBP/USD:
The GBP/USD chart currently has a bullish overall momentum, and there’s potential for a bullish bounce off the 1st support level.
On the support side, the 1st support at 1.2585 is identified as an overlap support, indicating that it could be a significant level where buying interest may emerge, potentially providing support for the GBP/USD pair.
Further down, there is a 2nd support at 1.2500, noted as a pullback support. This reinforces the significance of this support level, suggesting it as another potential area where buyers might become active.
On the resistance side, the 1st resistance at 1.2667 is categorized as a pullback resistance. This implies that it’s a substantial barrier where selling interest could intensify, potentially triggering a bearish reaction.
The 2nd resistance at 1.2727 is identified as an overlap resistance, further reinforcing the potential resistance factors for the GBP/USD.
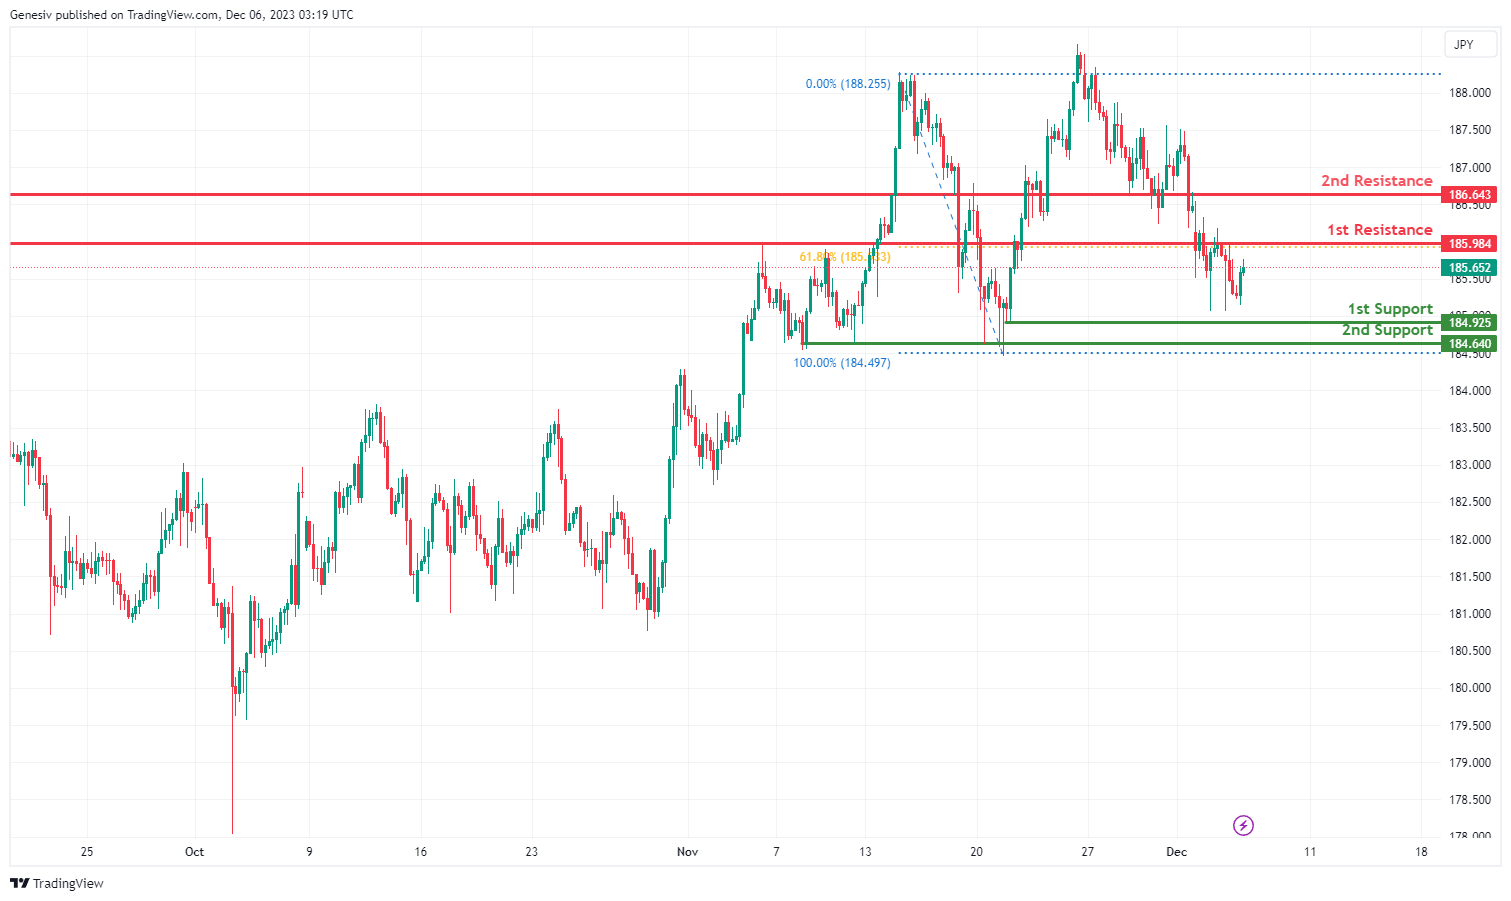
GBP/JPY:
The overall momentum of GBP/JPY is weak bearish with low confidence. This suggests that there is a modest inclination towards bearishness in the market, but it’s not very strong or certain.
1st Support at 184.93: This support level is at 184.93 and is considered good because it’s based on a swing low support. A swing low is a point where the price has previously found buying interest and reversed its downward movement.
2nd Support at 184.64: The second support level is at 184.64 and is also considered good because it’s based on multi-swing low support. This means that there have been multiple instances in the past where the price has bounced or found support around this level.
1st Resistance at 185.98: The first resistance level is at 185.98, and it’s considered good because it’s based on pullback resistance. A pullback resistance level is where the price has previously encountered selling pressure after a pullback from a previous move. Furthermore, this level aligns with the 61.80% Fibonacci Retracement, which adds significance to it.
2nd Resistance at 186.64: The second resistance level is at 186.64 and is based on pullback resistance as well. This level has acted as a barrier to price advancement in the past.
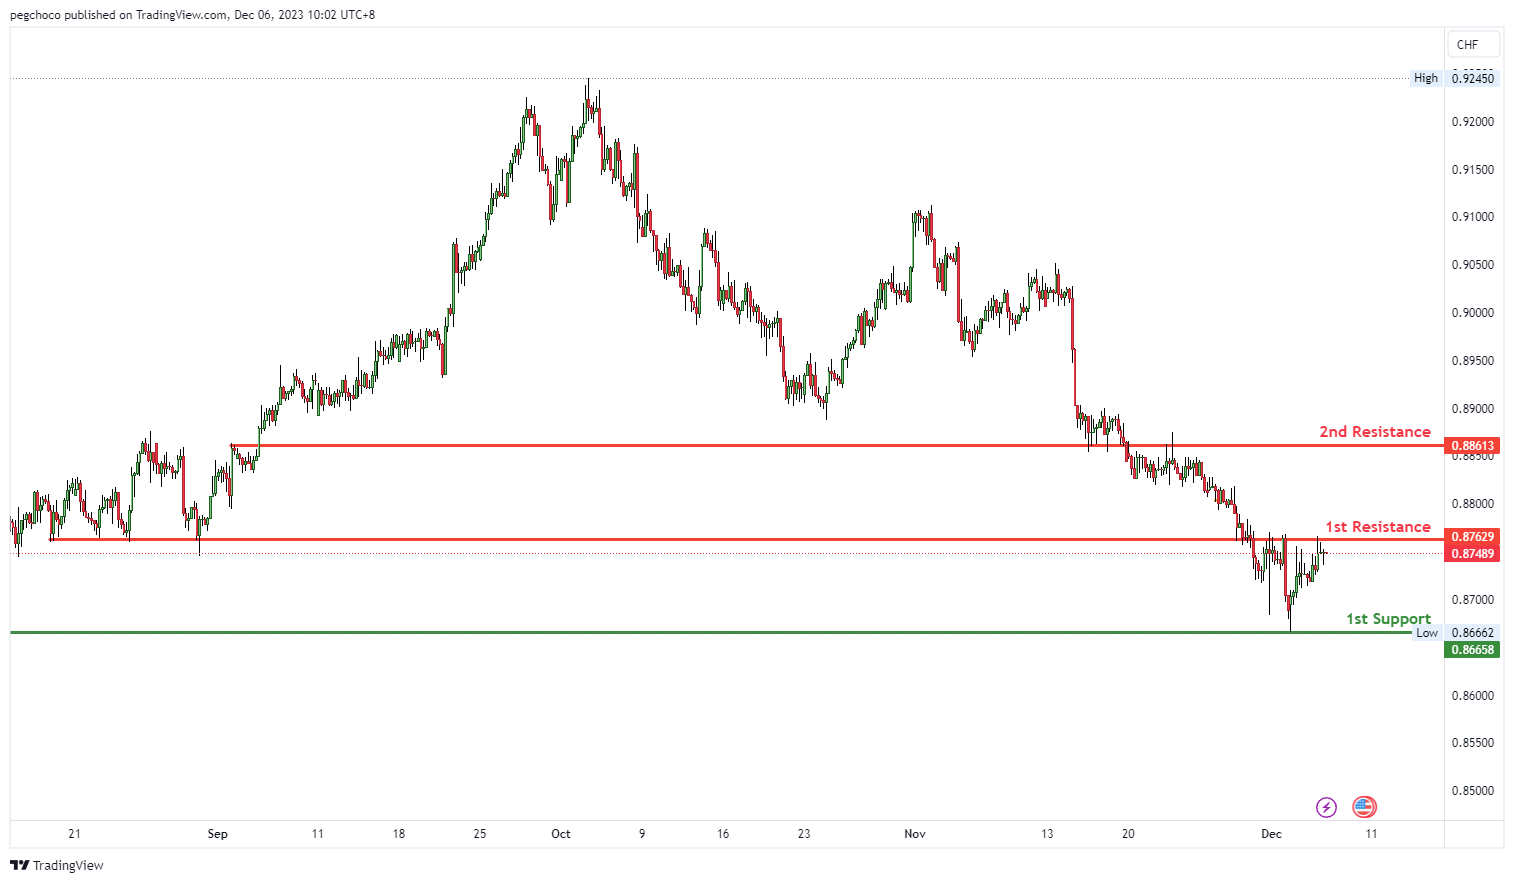
USD/CHF:
The USD/CHF chart currently has a bearish overall momentum, and there’s potential for a bearish reaction off the 1st resistance level.
On the support side, the 1st support at 0.8665 is categorized as a multi-swing low support. This indicates that it could be a significant level where buying interest may emerge, potentially providing support for the USD/CHF pair.
On the resistance side, the 1st resistance at 0.8762 is identified as an overlap resistance. This implies that it’s a substantial barrier where selling interest could intensify, potentially triggering a bearish reaction.
Further up, there is a 2nd resistance at 0.8861, also noted as an overlap resistance, further reinforcing the potential resistance factors for the USD/CHF.
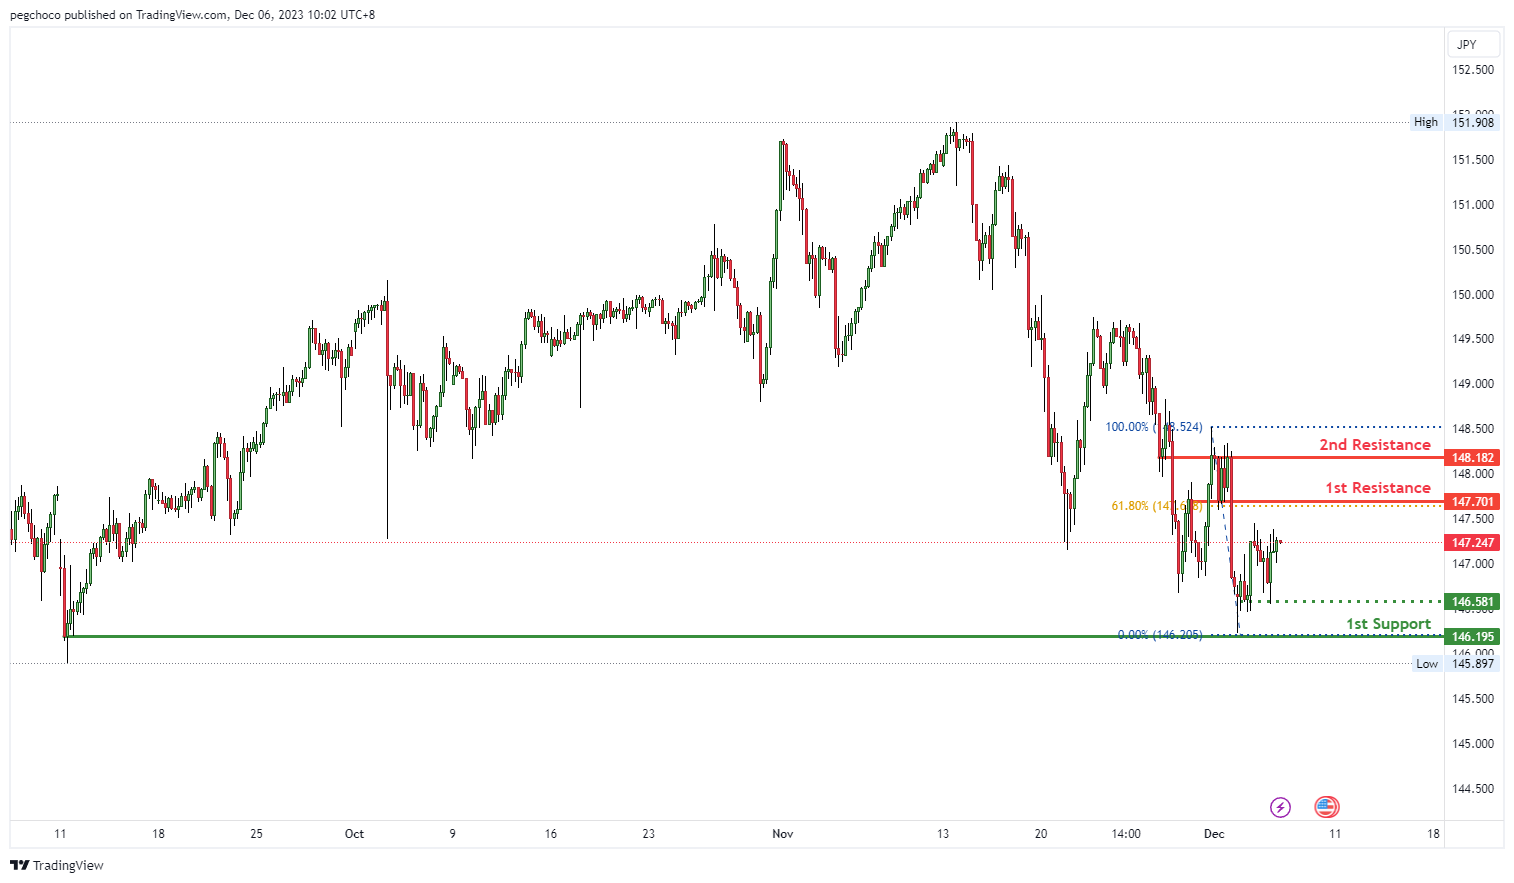
USD/JPY:
The USD/JPY chart currently exhibits a bearish overall momentum, and there’s potential for a bearish reaction off the 1st resistance level.
On the support side, the 1st support at 146.19 is categorized as a swing low support, indicating it’s a level where buying interest may emerge, potentially providing support for the USD/JPY pair. Further reinforcing this support, there is an intermediate support at 146.58, identified as a multi-swing low support.
On the resistance side, the 1st resistance at 147.70 is noted as a pullback resistance, implying it’s a significant barrier where selling interest could intensify, potentially leading to a bearish reaction. The 2nd resistance at 148.18 is identified as an overlap resistance, further strengthening the potential resistance factors for USD/JPY.
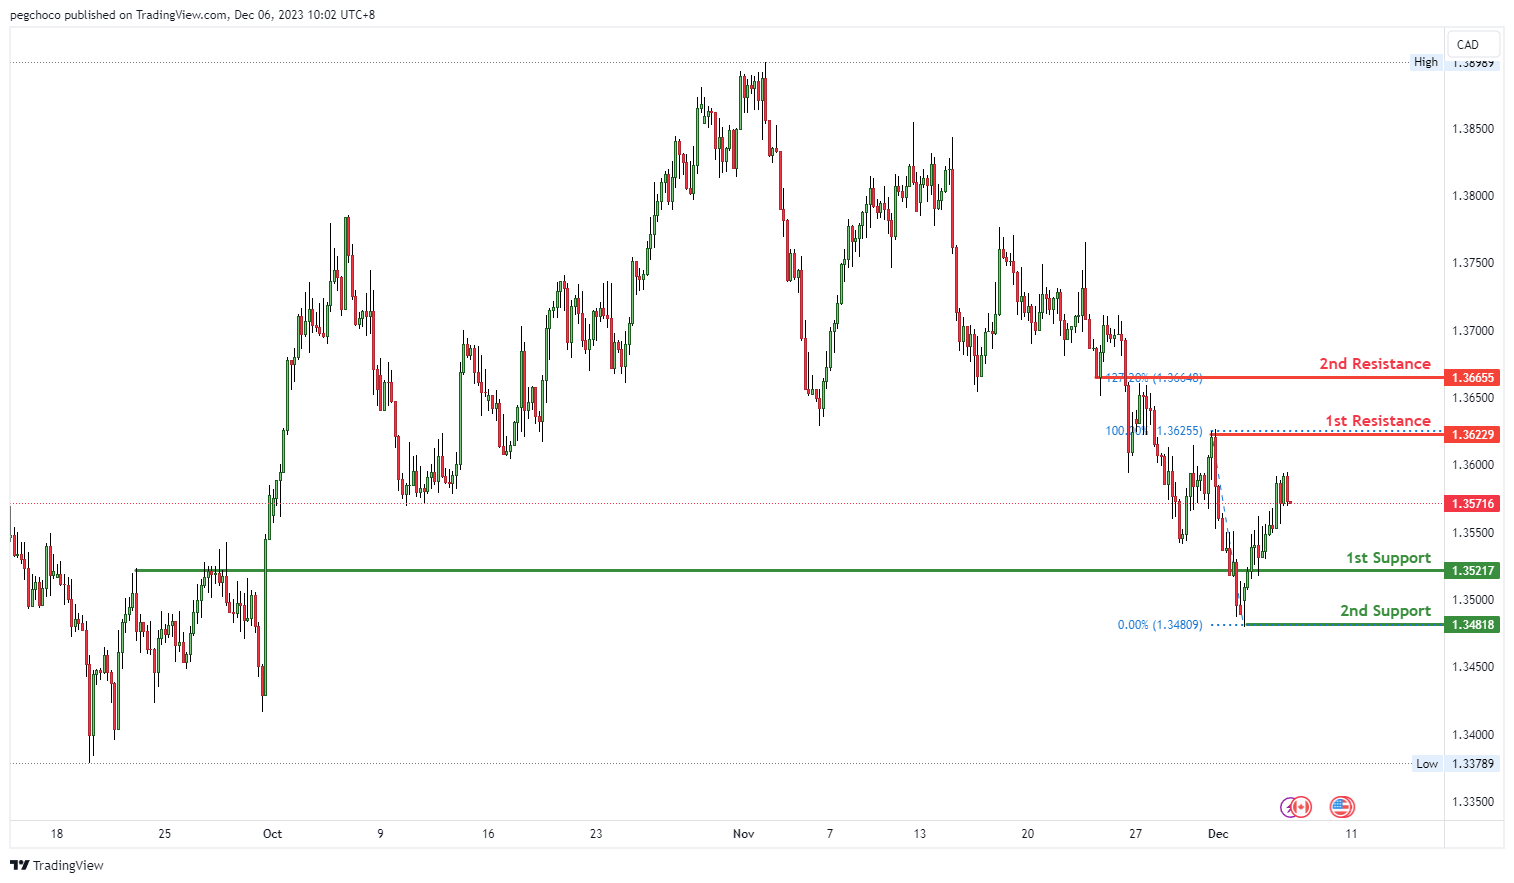
USD/CAD:
The USD/CAD chart currently demonstrates a bearish overall momentum, and there’s potential for a bearish reaction off the 1st resistance level, with a drop towards the 1st support.
On the support side, the 1st support at 1.3521 is categorized as an overlap support, suggesting it could be a significant level where buying interest may emerge. Additionally, the 2nd support at 1.3481 is identified as a swing low support, reinforcing its potential significance as a level where buyers might become active.
On the resistance side, the 1st resistance at 1.3622 is noted as a swing high resistance, implying that it could act as a substantial barrier where selling interest may intensify. The 2nd resistance at 1.3666 is identified as an overlap resistance and is accompanied by the 127.20% Fibonacci Extension, indicating another level where selling pressure may increase.
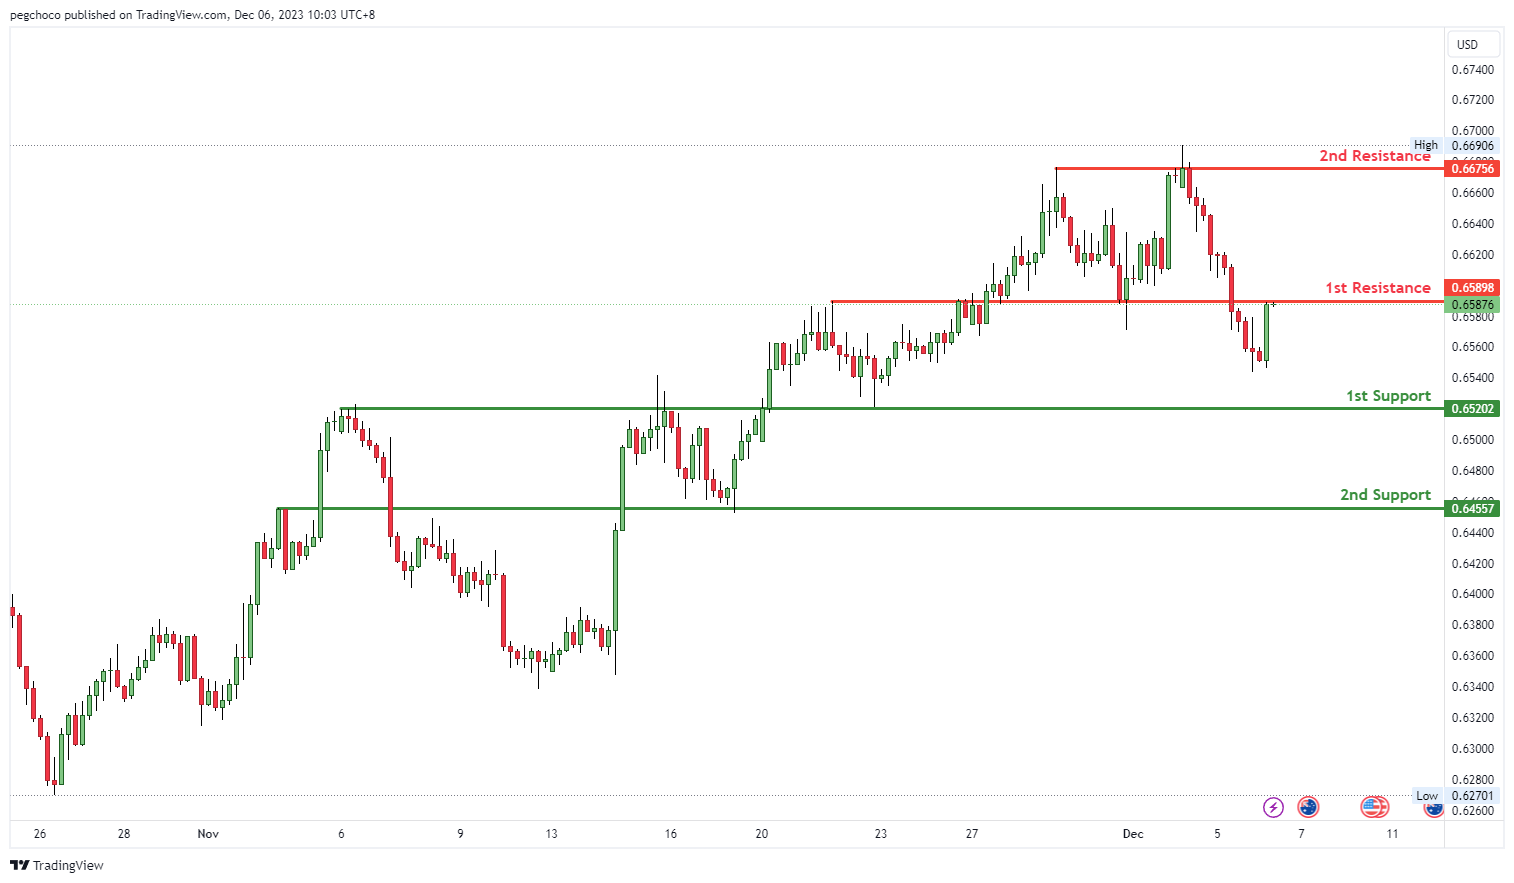
AUD/USD:
The AUD/USD chart currently exhibits a bearish overall momentum, and there’s potential for a bearish reaction off the 1st resistance level, with a drop towards the 1st support.
On the support side, the 1st support at 0.6520 is categorized as an overlap support, indicating its potential significance as a level where buying interest may emerge. Additionally, the 2nd support at 0.6455 is also identified as an overlap support, reinforcing its importance as a potential area for buyers to become active.
On the resistance side, the 1st resistance at 0.6589 is noted as a pullback resistance, suggesting that it could act as a substantial barrier where selling interest might intensify. The 2nd resistance at 0.6675 is identified as a multi-swing high resistance, indicating another level where selling pressure may increase.
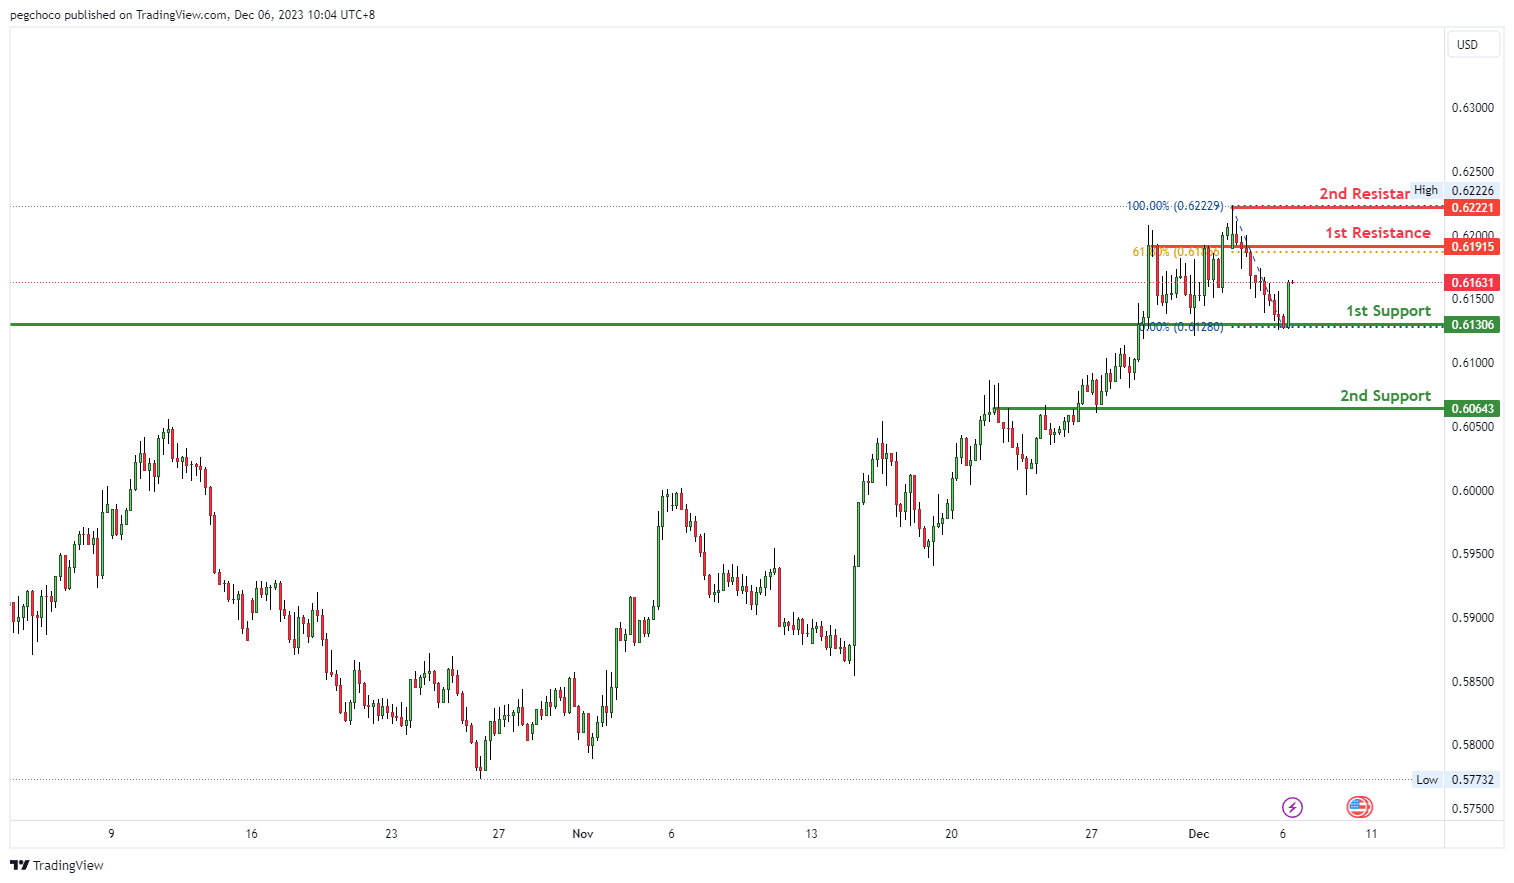
NZD/USD
The NZD/USD chart currently demonstrates a bullish overall momentum, and there’s potential for a bullish continuation towards the 1st resistance level.
On the support side, the 1st support at 0.6130 is identified as an overlap support, indicating its significance as a potential level where buying interest may emerge. Additionally, the 2nd support at 0.6064 is also categorized as an overlap support, further reinforcing its importance.
On the resistance side, the 1st resistance at 0.6191 is noted as a pullback resistance, suggesting that it could act as a substantial barrier where selling interest might intensify. The 2nd resistance at 0.6222 is identified as a swing high resistance, adding another level of potential selling pressure.
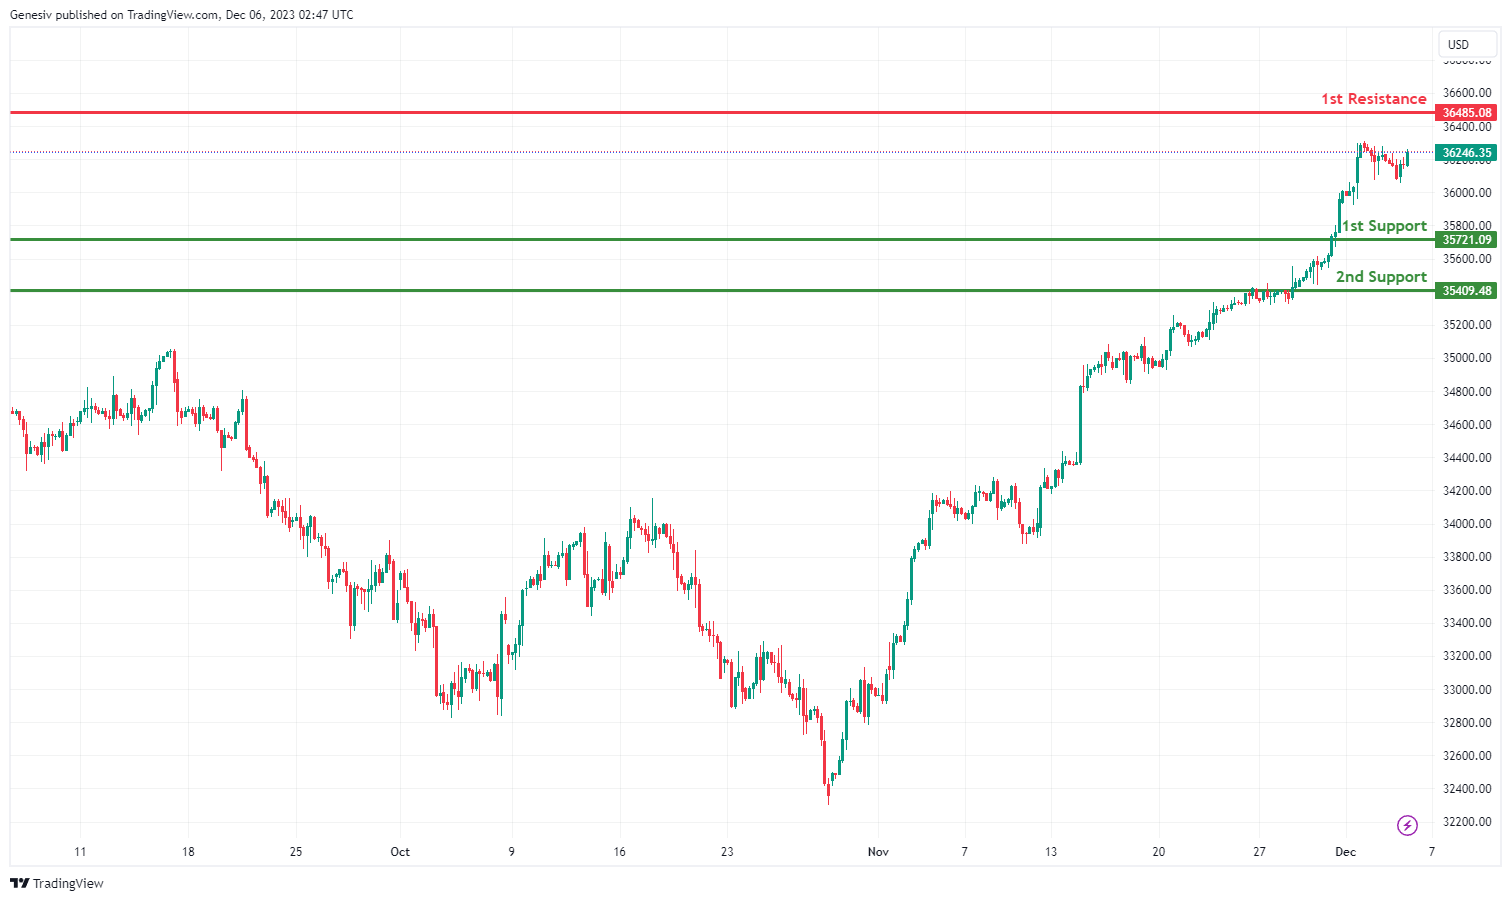
DJ30:
The DJ30,the momentum of the chart is weak bullish with low confidence. Price could potentially make a: Bullish continuation towards 1st resistance.
1st support at 35721.09: This level is a multi-swing low support, indicating that it has previously provided a base for the price. This could be a potential level for buying interest.
2nd support at 15409.48: This level represents an overlap support, where previous price action has clustered around this area.
1st resistance at 36485.08: This level is a swing high resistance, where the price has encountered selling pressure in the past. There is potential bullish breakouts or reversals around this level.
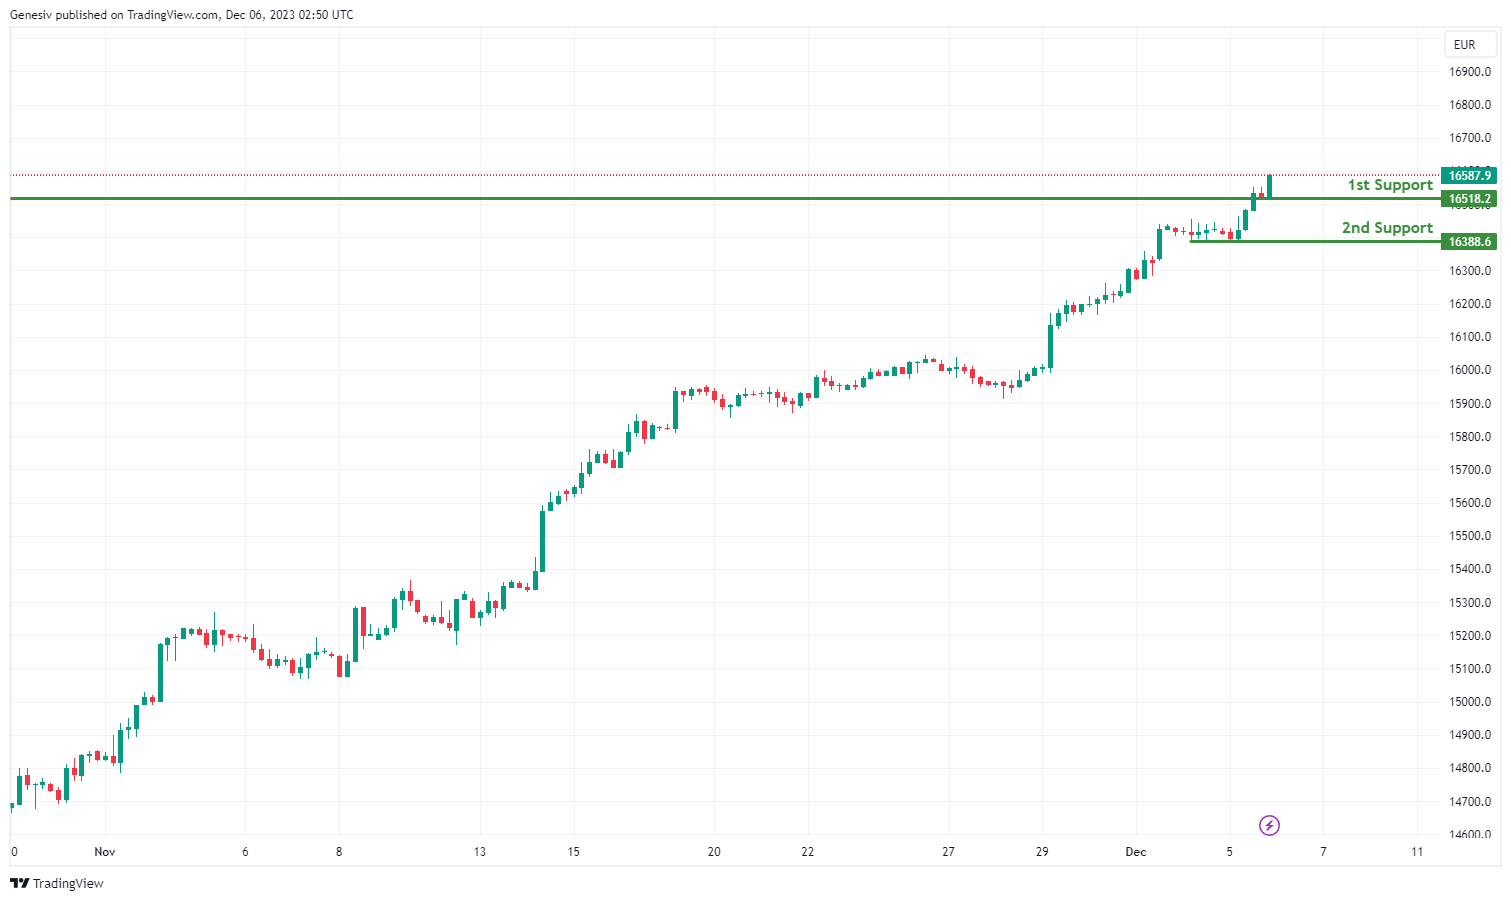
GER40:
The GER40, the overall momentum of the chart is Bullish. Price could potentially make a bullish continuation towards 1st resistance. Given the bullish momentum, traders may anticipate a continuation of the uptrend towards the 1st resistance level.
1st support at 16518.2: This level is a pullback support, suggesting that it has acted as a level where buyers have previously stepped in during a pullback. Traders may consider this as a potential area for buying opportunities.
2nd support at 16388.6: This level is a swing low support, indicating that it has historically been a level where the price has found support. It adds to the bullish case for the index.
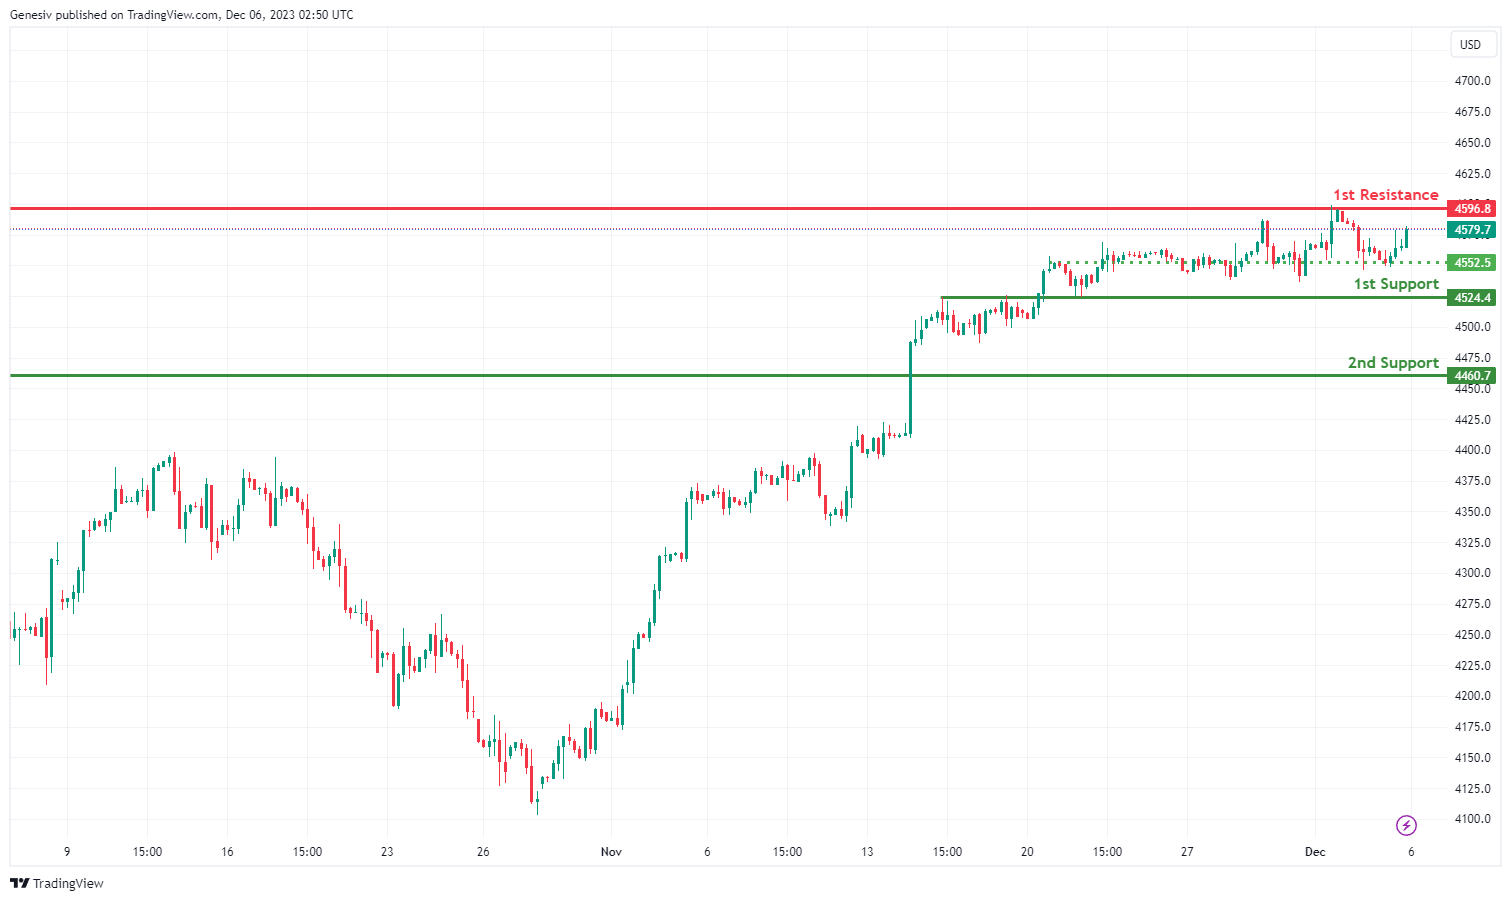
`US500:
The overall momentum of US500 is bullish, which means that the prevailing sentiment in the market is positive. This suggests that buyers have been more active than sellers, leading to upward price movements.
1st Support at 4524.4:This support level is at 4524.4, and it is considered a good support because it’s based on an overlap in historical price action. An overlap support level is one where the price has previously paused or reversed, indicating that there may be buying interest at this level.
2nd Support at 4460.7: The second support level is at 4460.7, and it’s considered good due to multi-swing low support. This suggests that there have been multiple instances in the past where the price has found support around this level.
1st Resistance at 4596.8: The first resistance level is at 4596.8, and it’s considered good because it’s based on a swing high resistance. A swing high is a point where the price has previously encountered selling pressure and reversed. This level represents a potential obstacle for further price advancement, as it has acted as a turning point in the past.
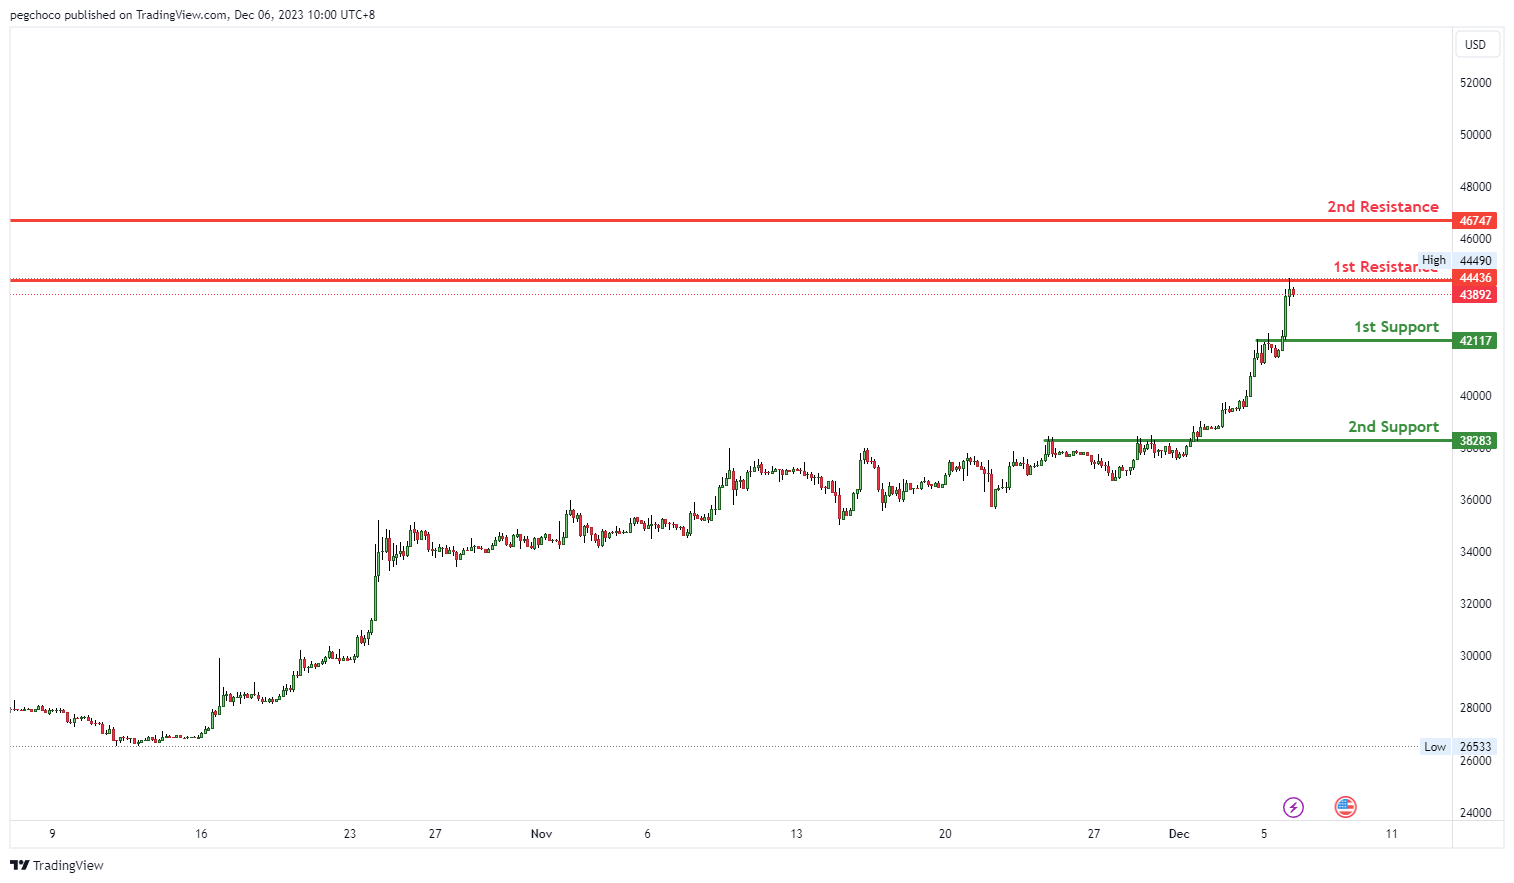
BTC/USD:
The BTC/USD chart is currently exhibiting a bearish overall momentum, and there’s potential for a bearish reaction off the 1st resistance level, with a drop towards the 1st support.
On the support side, the 1st support at 42117 is categorized as an overlap support, indicating it could be a significant level where buying interest may emerge. Additionally, the 2nd support at 38283 is also identified as an overlap support, further reinforcing its potential importance as a level where buyers might step in.
On the resistance side, the 1st resistance at 44436 is noted as a pullback resistance, suggesting it could act as a substantial barrier where selling interest may intensify. The 2nd resistance at 46747 is identified as an overlap resistance, potentially indicating another level where selling pressure could increase.
ETH/USD:
The ETH/USD chart is currently showing a bearish overall momentum, and there’s potential for a bearish reaction off the 1st resistance level, leading to a drop towards the 1st support.
On the support side, the 1st support at 2139.92 is considered a pullback support level, indicating it could be a significant area where buying interest may emerge. Additionally, there is an intermediate support at 2246.59, identified as an overlap support, further reinforcing its potential as a level where buyers might become active.
On the resistance side, the 1st resistance at 2315.06 is noted as a pullback resistance, implying it could act as a substantial barrier where selling interest may intensify.

WTI/USD:
The WTI chart currently exhibits a bearish overall momentum, and there’s potential for a bearish reaction off the 1st resistance level, potentially leading to a drop towards the 1st support.
On the support side, the 1st support at 70.85 is identified as a significant level, primarily due to the presence of a 161.80% Fibonacci Extension. This suggests that it could be a key area where buying interest might emerge. Further reinforcing this support, there is a 2nd support at 69.95, categorized as an overlap support, adding significance to this level.
On the resistance side, the 1st resistance at 72.57 is noted as an overlap resistance, indicating it’s a substantial barrier where selling interest could intensify. The 2nd resistance at 74.28 is also categorized as an overlap resistance, adding another level of potential selling pressure.

XAU/USD (GOLD):
The XAU/USD chart currently displays a bullish overall momentum, with potential for a bullish continuation towards the 1st resistance level.
On the support side, the 1st support at 2008.88 is categorized as a pullback support, indicating it’s a significant level where buying interest may emerge, potentially providing support for XAU/USD. Further reinforcing this support, there is a 2nd support at 1972.39, identified as another pullback support level.
On the resistance side, the 1st resistance at 2035.62 is noted as an overlap resistance, suggesting that it’s a substantial barrier where selling interest could intensify. The 2nd resistance at 2048.51 is categorized as a pullback resistance, indicating another level where selling pressure may increase.

The accuracy, completeness and timeliness of the information contained on this site cannot be guaranteed. IC Markets does not warranty, guarantee or make any representations, or assume any liability regarding financial results based on the use of the information in the site.
News, views, opinions, recommendations and other information obtained from sources outside of www.icmarkets.com, used in this site are believed to be reliable, but we cannot guarantee their accuracy or completeness. All such information is subject to change at any time without notice. IC Markets assumes no responsibility for the content of any linked site.
The fact that such links may exist does not indicate approval or endorsement of any material contained on any linked site. IC Markets is not liable for any harm caused by the transmission, through accessing the services or information on this site, of a computer virus, or other computer code or programming device that might be used to access, delete, damage, disable, disrupt or otherwise impede in any manner, the operation of the site or of any user’s software, hardware, data or property.


