
EUR/USD:
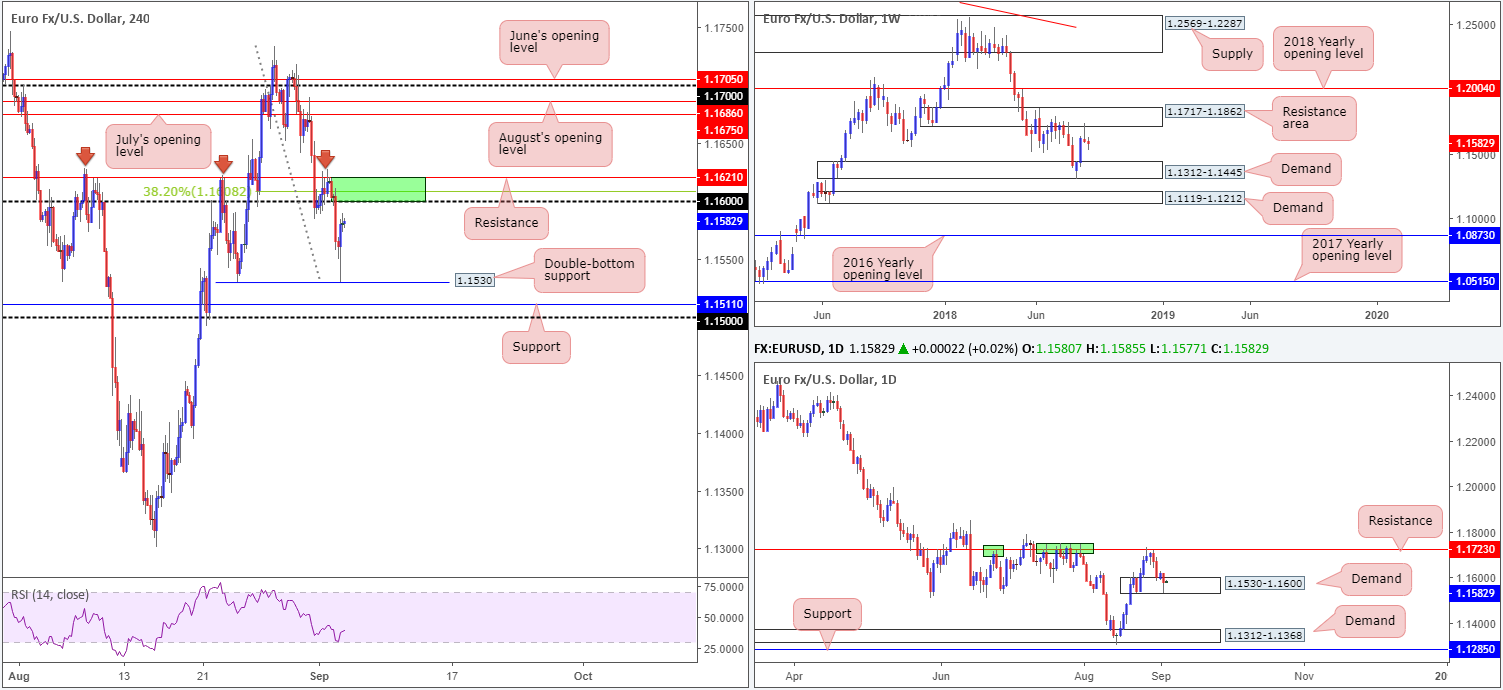
In the early hours of European trade on Tuesday, the market witnessed the single currency head for lower levels. In reasonably strong fashion, the H4 candles reclaimed the 1.16 handle to the downside and eventually tested the August 23 lows at 1.1530. It was from here – during the opening hours of US trade – price action pared a large portion of recent losses, despite US ISM manufacturing PMI coming in hotter than expected. The next upside targets to be aware of on this scale fall in at the 1.16 handle, a 38.2% Fib resistance at 1.1608 and a resistance level drawn from 1.1621.
Interestingly, 1.1530 also denotes the lower boundary of a daily demand zone coming in at 1.1530-1.1600. Further buying from this zone has resistance at 1.1723 to target, which is placed within the lower limits of a weekly resistance area at 1.1717-1.1862. In terms of where we stand on the weekly timeframe, structure shows price meandering between the aforesaid resistance area and a demand zone penciled in at 1.1312-1.1445.
Areas of consideration:
In view of the newly-formed H4 double-bottom support at 1.1530, price is likely to test the 1.16 range sometime today. Between 1.16 and the H4 resistance level at 1.1621 (area marked in green), is a zone sellers could make an appearance from. Whether it’ll provide traders a platform to secure a short is difficult to judge, as the area holds little higher-timeframe confluence. The next upside base on the bigger picture does not come into view until we reach 1.1717: the underside of the current weekly resistance area.
For those who are interested in shorting 1.1621/1.16 today, waiting and seeing if H4 price can print additional candle confirmation in the form of a full or near-full-bodied bear candle is likely the safer path to take. Stop-loss orders can then be positioned beyond the rejection candle’s wick, with the initial take-profit zone set at 1.1530.
Today’s data points: Limited.
GBP/USD:
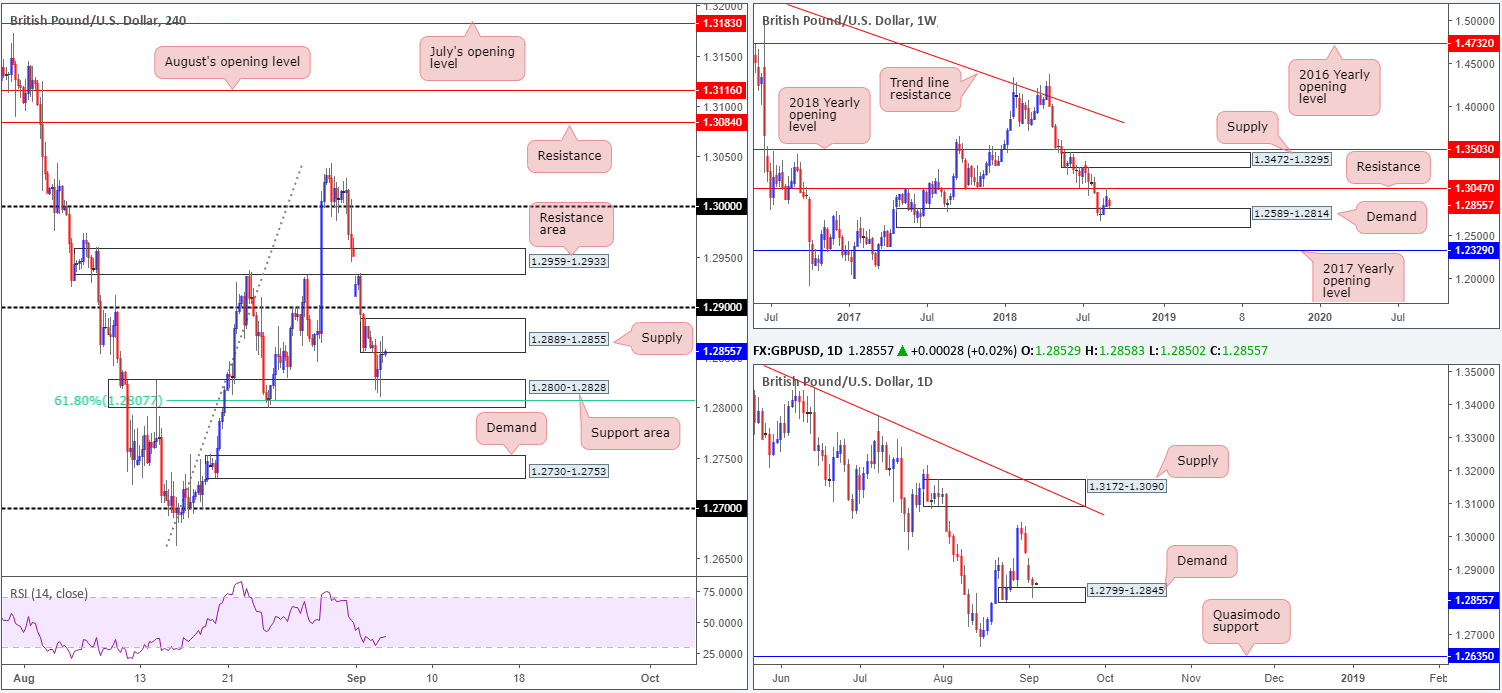
Concerns over a no-deal Brexit, along with a lower-than-expected UK construction PMI reading, pressured the British pound lower against the US dollar on Tuesday. As you can see, though, the market did manage to find a bed of support off a H4 support area at 1.2800-1.2828 amid US hours (holds a 61.8% Fib support within its walls at 1.2807), consequently paring a large portion of recent losses. The move came after the German press reported the EU could adjust the Irish border backstop to win the UK’s approval in Brexit negotiations.
While H4 price is tightly confined between the current support zone and a supply area at 1.2889-1.2855, the higher timeframes are currently chalking up a bullish tone. Daily movement recently crossed swords with demand at 1.2799-1.2845 in the shape of a bullish pin-bar formation, while weekly flow also connected with the top edge of demand at 1.2589-1.2814 – this zone effectively supports the current daily demand area.
Areas of consideration:
Although the bigger picture portends buying, H4 structure has a number of resistances to contend with: the current H4 supply, the 1.29 handle and then a nearby H4 resistance area at 1.2959-1.2933. This makes it almost impossible to secure a long position on the H4 scale at the moment, despite where we are coming from on the higher timeframes.
Should the market continue to press lower, however, the next downside target can be seen at a fresh H4 demand base located at 1.2730-1.2753. Do bear in mind, though, by selling this move you are up against potential buying from the higher timeframes.
Today’s data points: UK services PMI.
AUD/USD:
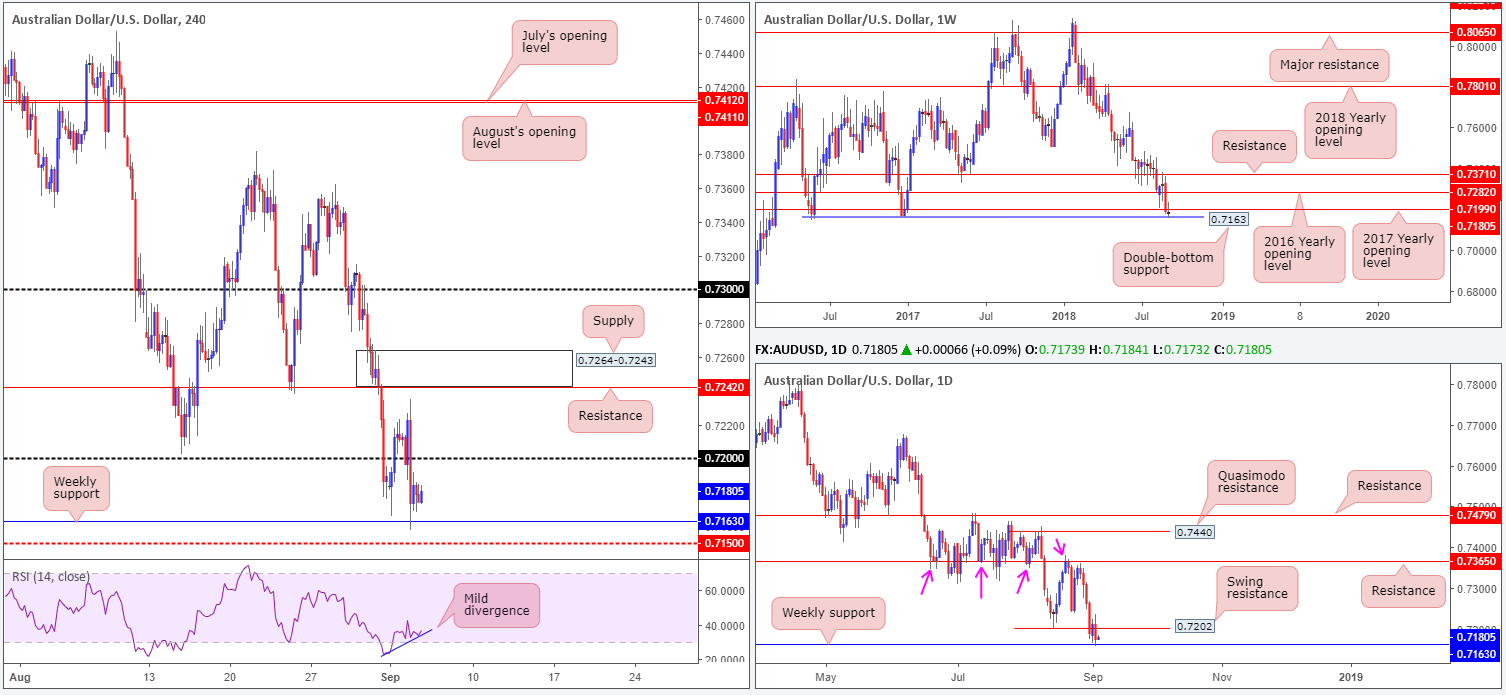
AUD/USD bulls failed to sustain gains above the 0.72 handle on Tuesday after topping just south of H4 resistance at 0.7242. The weekly double-bottom support at 0.7163, as you can see, elbowed its way into the spotlight, and has thus far held the pair higher.
For those looking to enter long based on the weekly support currently in play, there are a few cautionary points to consider:
- Nearby resistance is seen at the 0.72 handle on the H4 timeframe, which happens to be bolstered by the 2017 yearly opening level on the weekly timeframe at 0.7199.
- Daily action penciled in a clear-cut bearish engulfing formation yesterday.
- Swing resistance is seen on the daily timeframe at 0.7202.
Areas of consideration:
According to our technical reading, the AUD/USD pendulum could potentially swing either way today!
To our way of seeing things, though, the sellers may have the upper hand here. Not only are we entrenched within a dominant downtrend, there are a number of factors supporting the sellers (see 1-3 above). However, before one looks to pull the trigger, waiting for the weekly double-bottom support to be taken out is a MUST, in our humble view.
Today’s data points: Australian growth figures q/q.
USD/JPY:
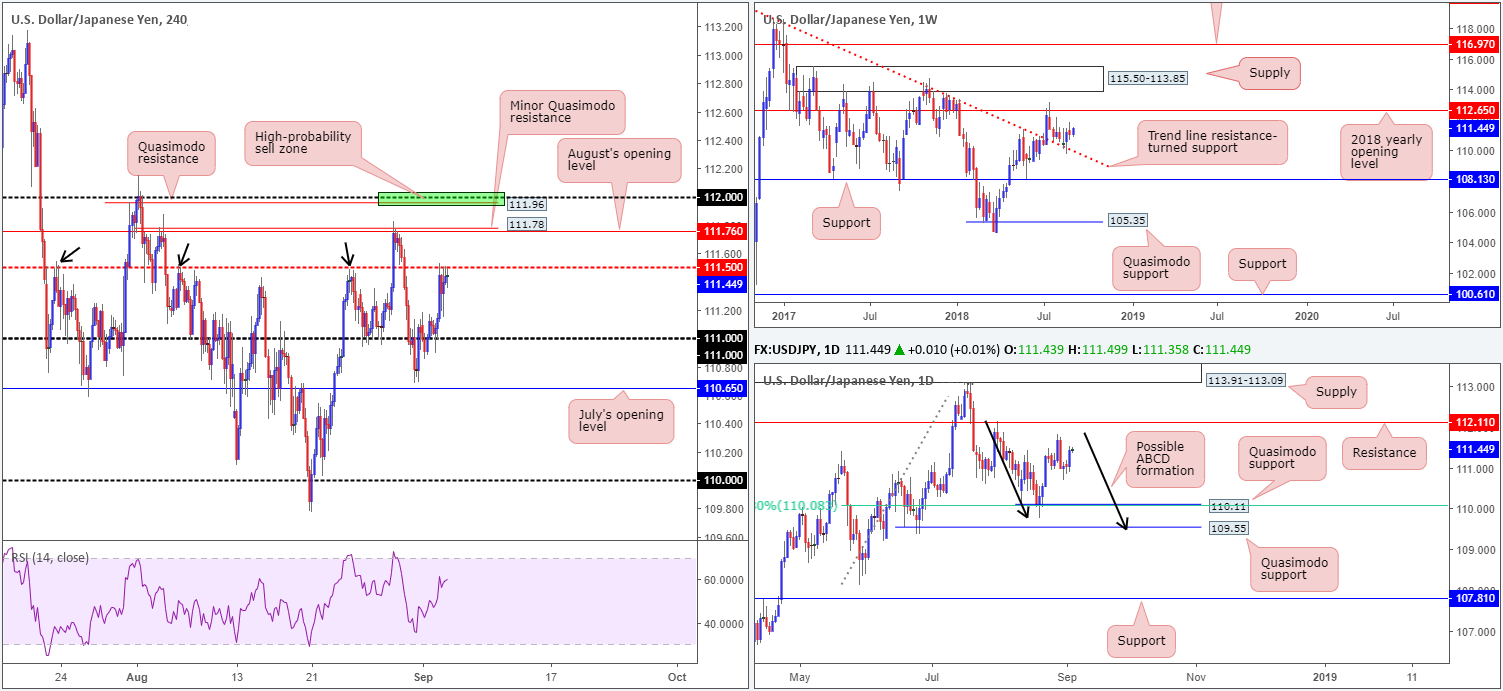
The greenback advanced against its Japanese counterpart on Tuesday, though did manage to find a ceiling off the H4 mid-level resistance at 111.50 in US hours. Bolstered by rising US Treasury yields and an upbeat US ISM manufacturing PMI reading, however, the pair still concluded the day in strong form. From an intraday perspective, traders’ crosshairs are likely fixed on August’s opening level at 111.76 seen on the H4 timeframe for potential shorts, given it fuses with a minor H4 Quasimodo resistance at 111.78. What’s also attractive for shorts, and possibly the higher-probability setup, is the H4 Quasimodo resistance seen at 111.96. Aside from this level merging closely with the 112 handle, the apex (112.15) of the Quasimodo formation is strengthened by a daily resistance level seen at 112.11 (effectively the next upside target on the daily scale).
The only concern regarding a sell in this market at the moment is the fact weekly price shows room to stretch as far north as the 2018 yearly opening level at 112.65.
Areas of consideration:
The H4 Quasimodo resistance level mentioned above at 111.96 is worthy of consideration, given its surrounding confluence (noted above). Having seen daily resistance at 112.11 reinforcing the top edge of this Quasimodo formation, placing stop-loss orders above the Quasimodo apex at around 111.17ish is an option. As for the initial take-profit target, ideally it’d be the 111.50 point, though this is dependent on how the H4 candles approach the sell zone.
Today’s data points: Limited.
USD/CAD:
Thanks largely to stronger-than-expected manufacturing activity, the buck extended higher against the majority of its peers in recent trade. The rising dollar is one of the main reasons why we have seen the Canadian dollar sell off aggressively ahead of the Bank of Canada’s monetary policy announcement today.
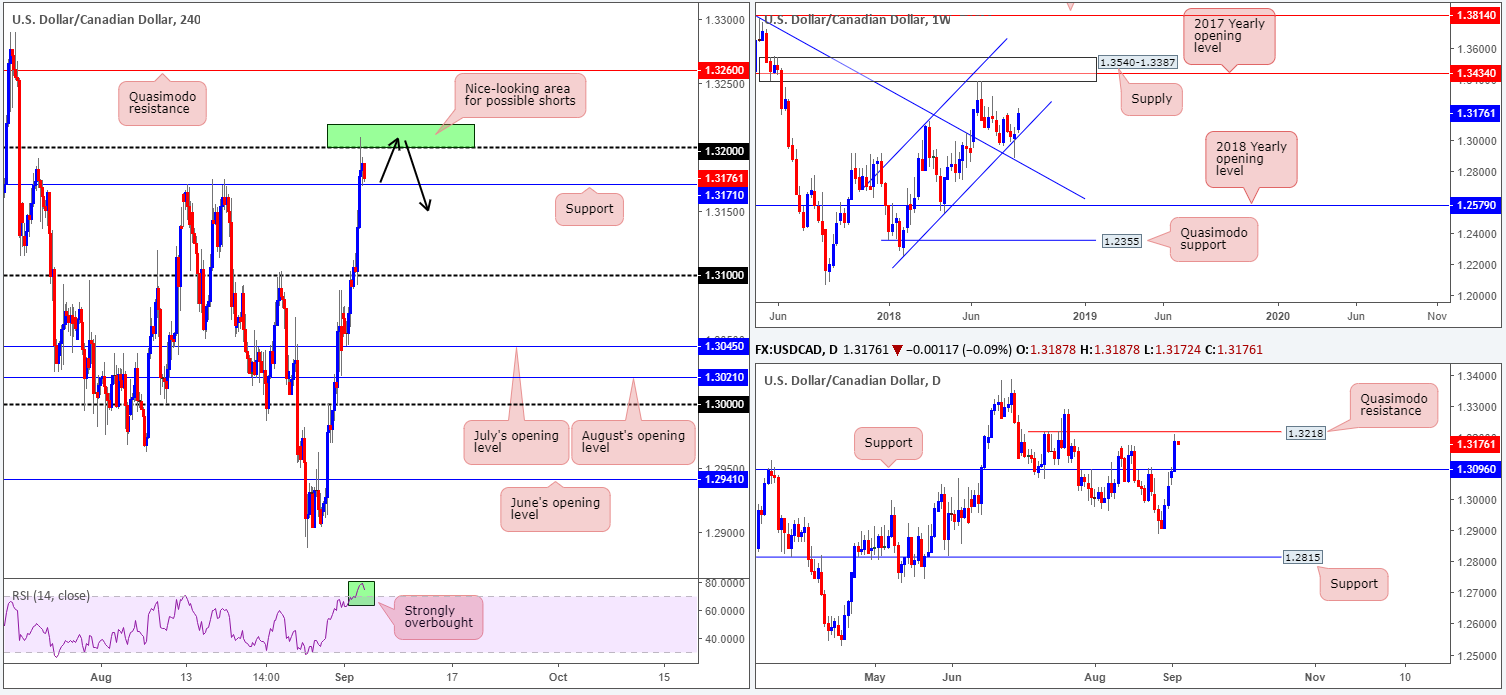
From a technical standpoint, the H4 candles cleared a number of resistances on Tuesday and only really began showing signs of weakness once the 1.32 handle entered the fold. This pullback may be temporary, however, as potential H4 support is seen nearby at 1.3170. Also worth noting on the H4 scale is the RSI is currently showing a strong overbought signal.
18 pips above the 1.32 handle, the team has noted to be aware of a Quasimodo resistance level at 1.3218. Thanks to the stop-loss orders collected in yesterday’s move, this level is likely going to respond should it be challenged today. Meanwhile, higher up on the curve, weekly price displays room to press as far north as supply coming in at 1.3540-1.3387, which happens to house the 2017 yearly opening level at 1.3434.
Areas of consideration:
A bounce from the current H4 support at 1.3171 is likely today, bringing the H4 candles back up to the 1.32 region. Between here and the daily Quasimodo resistance at 1.3218 (the green zone) is an area sellers may make an appearance.
Taking into account the threat of further buying on the weekly scale, though, traders are urged to exercise patience on a short from the 1.32 range today. Should a H4 full or near-full-bodied bearish candle take shape from here, this not only shows seller intent, it also provides a location to short (the close of the candle) and a stop-loss position (above the candle’s rejection wick), targeting the 1.31 handle as the ultimate take-profit zone.
Today’s data points: CAD trade balance; CAD labor productivity q/q; BoC rate statement and overnight rate decision.
USD/CHF:
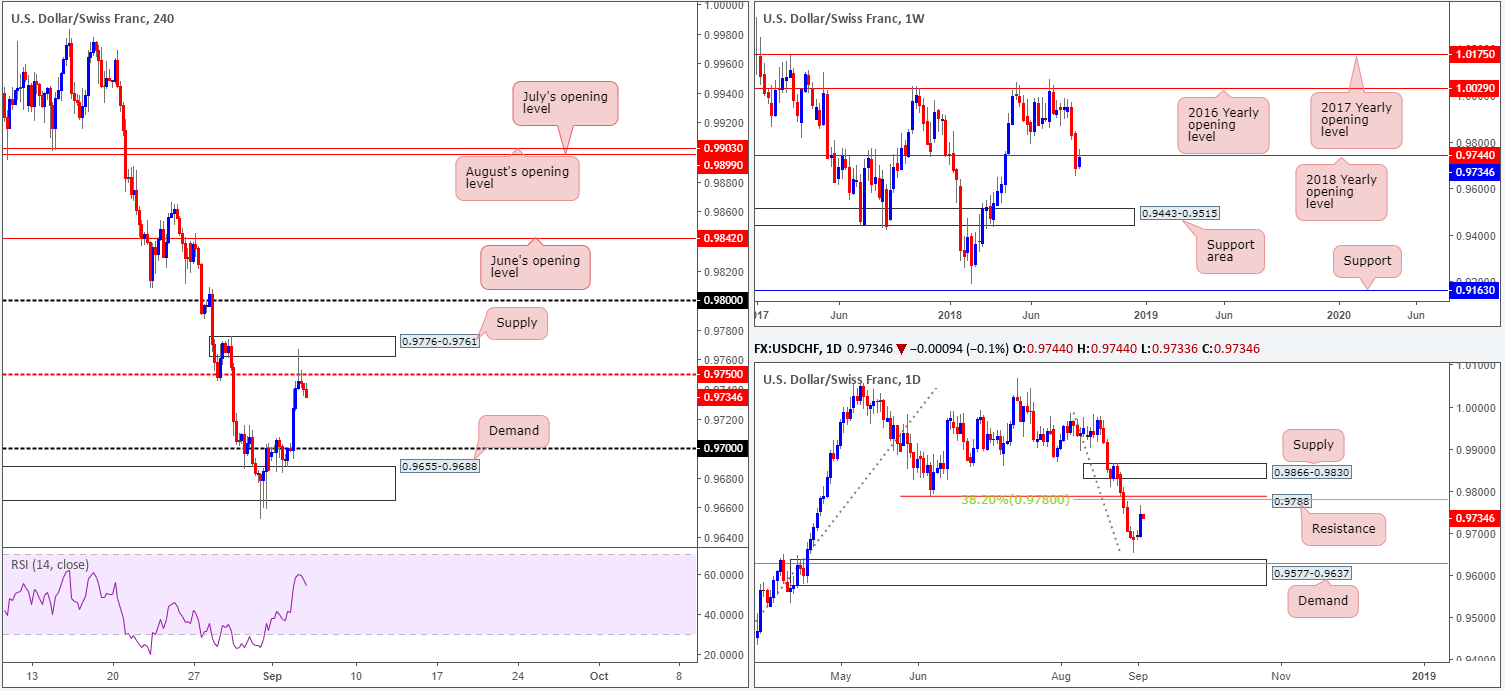
Coming in from the top this morning, we can see weekly price retested the underside of the 2018 yearly opening level at 0.9744 in recent trade, following last week’s strong break to the downside. This is considered a potentially strong barrier of resistance, so don’t make the mistake of overlooking it.
In terms of daily movement, the next upside objective on the radar can be seen at a swing resistance drawn from 0.9788, which happens to be bolstered by a nearby 38.2% Fib resistance value at 0.9780. A break above 0.9788 highlights nearby supply positioned at 0.9866-0.9830.
H4 action, after moving sideways on Monday in a tight range, came into contact with a supply zone at 0.9776-0.9761 on Tuesday following a modest upside move on the back of upbeat US manufacturing. In the shape of a bearish pin-bar formation that pierced through nearby mid-level resistance at 0.9750 and tapped the noted H4 supply, the H4 candles are depicting a somewhat bearish picture at the moment, eyeing a retest of 0.97.
Areas of consideration:
Further selling from current price is likely given that we are coming from a weekly resistance level. However, traders need to remain cognizant of the possibility that daily price could pop higher to bring in sellers from resistance mentioned above at 0.9788 before driving lower.
As for potential sell levels, we like the underside of 0.9750 this morning, though entering short from this level without additional confirmation is not considered a high-probability setup. Should H4 price tap the underside of this level and print a bearish candlestick formation, shorts from this angle (stops placed above the confirming candle’s rejection wick), targeting 0.97 is an option.
Today’s data points: Limited.
Dow Jones Industrial Average:
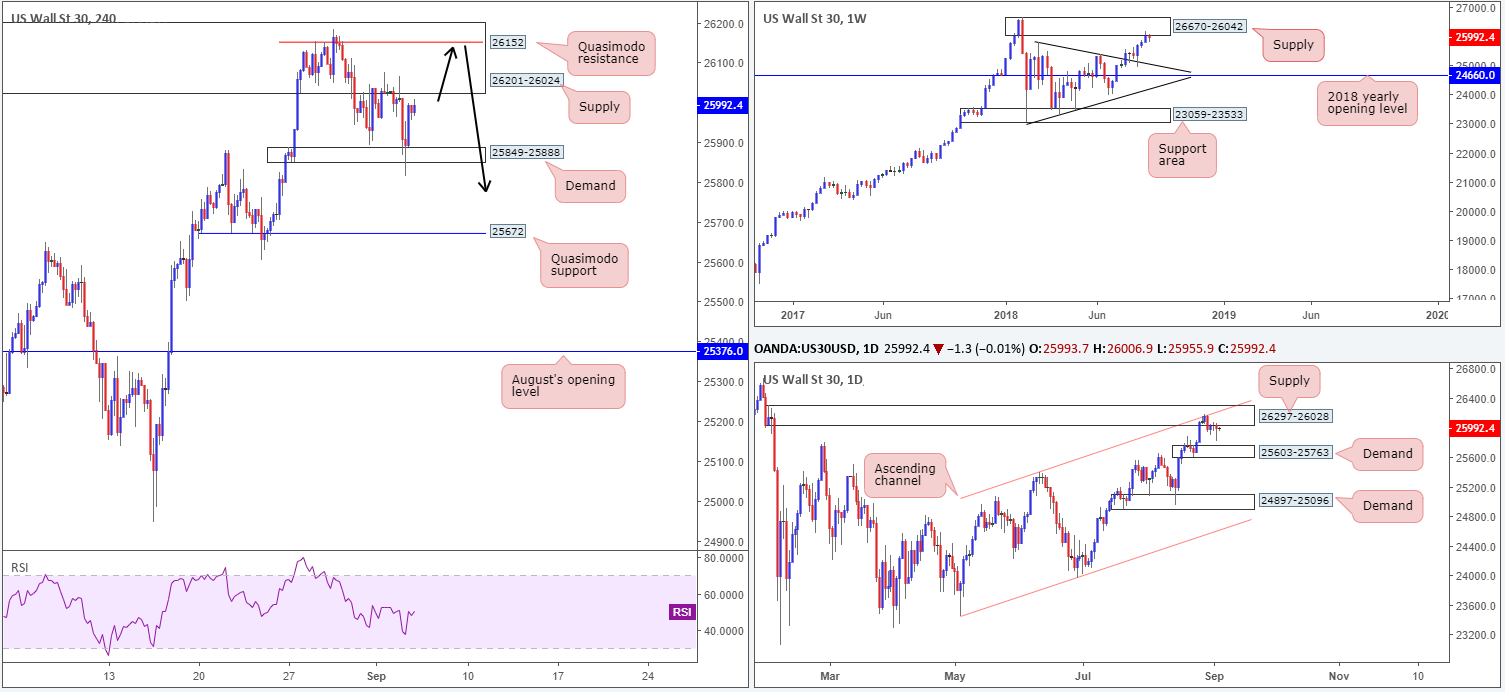
In early US hours, the DJIA broke to the downside on Tuesday, exploring levels beneath H4 demand at 25849-25888 and likely taking out stop-loss orders. With the path south now potentially clear towards the H4 Quasimodo support level at 25672, selling this market is certainly an option.
Meanwhile, higher up on the curve, the bigger picture remains pretty much unchanged. Although the DJIA registered its third consecutive weekly gain last week, traders may have noticed price recently engaged with the lower edge of a weekly supply at 26670-26042, following a strong retest off a weekly trend line resistance-turned support (etched from the high 25807) a few weeks back.
In terms of the daily timeframe, strong supply at 26297-26028 remains in the fold. What gives this area credibility comes down to the following:
- Downside momentum drawn from the base is incredibly strong.
- The zone intersects with a daily channel resistance (taken from the high 25399).
- Glued to the underside of the aforesaid weekly supply area.
Areas of consideration:
As the current H4 supply at 26201-26024 is rather large, entering short from the H4 Quasimodo resistance level seen within the upper limits of the area at 26152 could be something to consider (see black arrows). This gives traders the option of positioning stops above the overall H4 supply (while keeping risk/reward in check), targeting the H4 demand area mentioned above at 25849-25888 as the initial take-profit zone, followed then by the top edge of daily demand at 25603-25763 (next downside target on the daily scale) and then the aforementioned H4 Quasimodo support level.
Today’s data points: Limited.
XAU/USD (Gold):
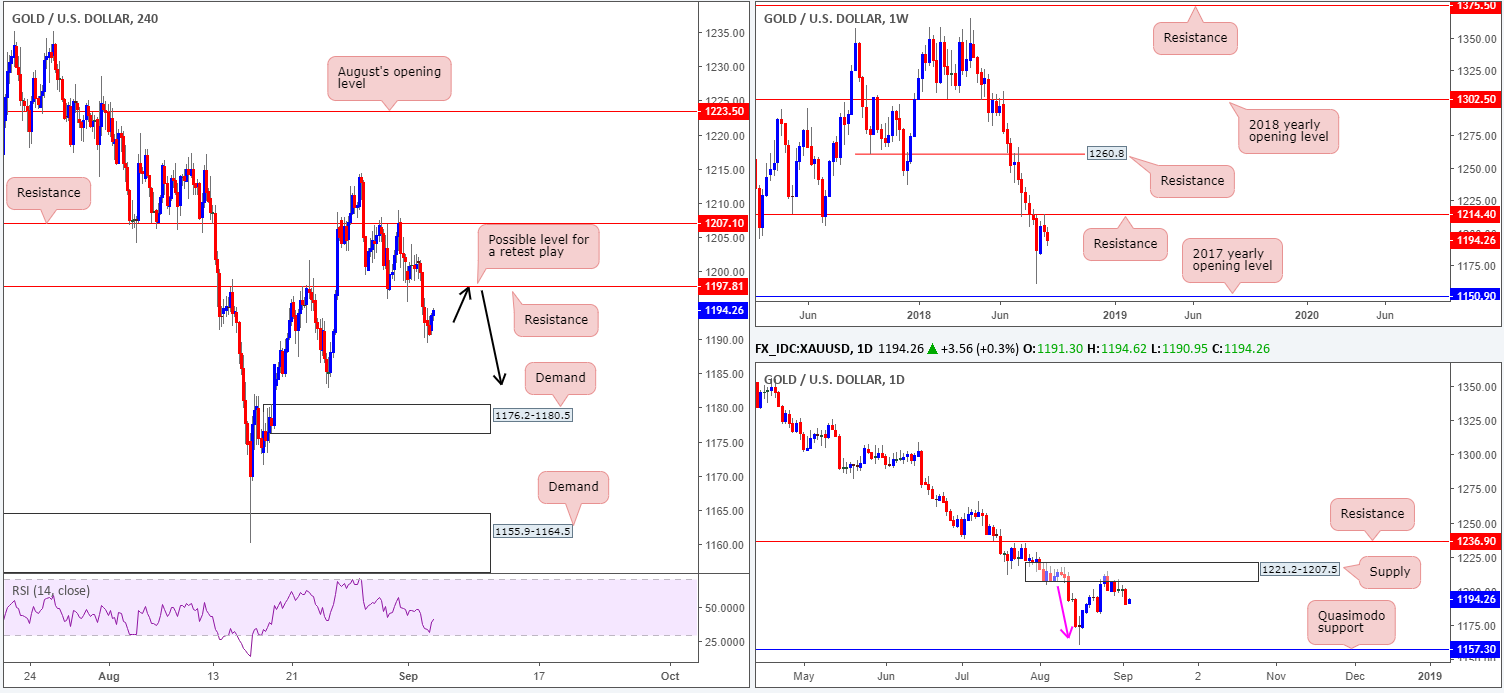
As expected, the H4 candles broke through H4 support at 1197.8, and is now acting as a possible resistance. Beneath this number, we do not see a whole lot of support until the unit reaches the August 24 low at 1182.9, followed closely by H4 demand at 1176.2-1180.5.
Further selling is also likely on the cards, according to the overall picture. Weekly price is establishing firm ground beneath resistance at 1214.4, with room seen to press much lower. Also worth taking on board is the fact that we’re also coming from a daily supply zone at 1221.2-1207.5, which actually houses the noted weekly resistance within its walls. Overall, it’s unlikely to observe serious buying pressure enter the market on the bigger scale until we touch gloves with the August 16 low 1160.3, shadowed closely by the daily Quasimodo support at 1157.3.
Areas of consideration:
Keeping it Simple Simon this morning, the H4 support-turned resistance at 1197.8 has ‘potential sell’ written all over it. In the event this level is tested and responds in the shape of a H4 bearish candlestick formation, further selling is likely in store, targeting the August 24 low at 1182.9 as the initial port of call.
The use of the site is agreement that the site is for informational and educational purposes only and does not constitute advice in any form in the furtherance of any trade or trading decisions.
The accuracy, completeness and timeliness of the information contained on this site cannot be guaranteed. IC Markets does not warranty, guarantee or make any representations, or assume any liability with regard to financial results based on the use of the information in the site.
News, views, opinions, recommendations and other information obtained from sources outside of www.icmarkets.com.au, used in this site are believed to be reliable, but we cannot guarantee their accuracy or completeness. All such information is subject to change at any time without notice. IC Markets assumes no responsibility for the content of any linked site. The fact that such links may exist does not indicate approval or endorsement of any material contained on any linked site.
IC Markets is not liable for any harm caused by the transmission, through accessing the services or information on this site, of a computer virus, or other computer code or programming device that might be used to access, delete, damage, disable, disrupt or otherwise impede in any manner, the operation of the site or of any user’s software, hardware, data or property.


