
DXY:
The DXY (U.S. Dollar Index) chart demonstrates a bullish momentum, supported by the price being above a major ascending trend line. There is potential for a bullish continuation towards the first resistance level at 103.43, which is an overlap resistance. Additionally, the second resistance at 103.86 acts as a pullback resistance, coinciding with the 78.60% Fibonacci Retracement. The first support level at 102.75 and the second support at 102.33 provide support to the bullish momentum.

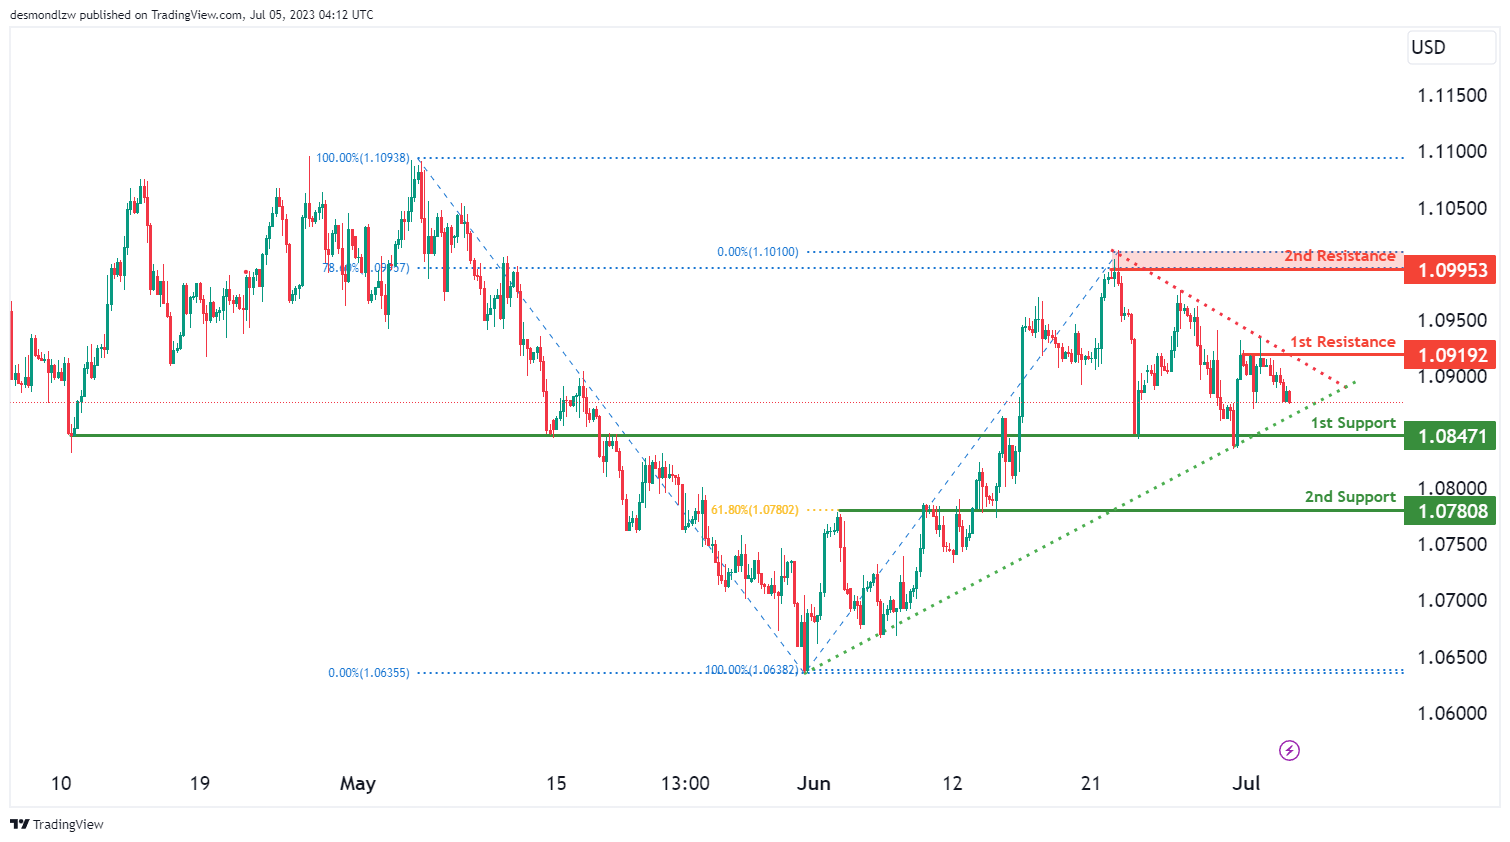
EUR/USD:
The EUR/USD chart shows a bearish momentum, indicating a downward trend in the market. There is a possibility for a bearish continuation towards the first support level at 1.0847, which is an overlap support. The second support level at 1.0780 acts as another overlap support and aligns with the 61.80% Fibonacci Retracement. On the upside, the first resistance level at 1.0919 represents a multi-swing high resistance, while the second resistance level at 1.0995 is a swing high resistance and coincides with the 78.60% Fibonacci Retracement.
Additionally, a symmetrical triangle chart pattern suggests a period of consolidation, with a breakout above the upper trendline indicating a bullish breakout and a breakdown below the lower trendline signaling a bearish breakdown.
EUR/JPY:
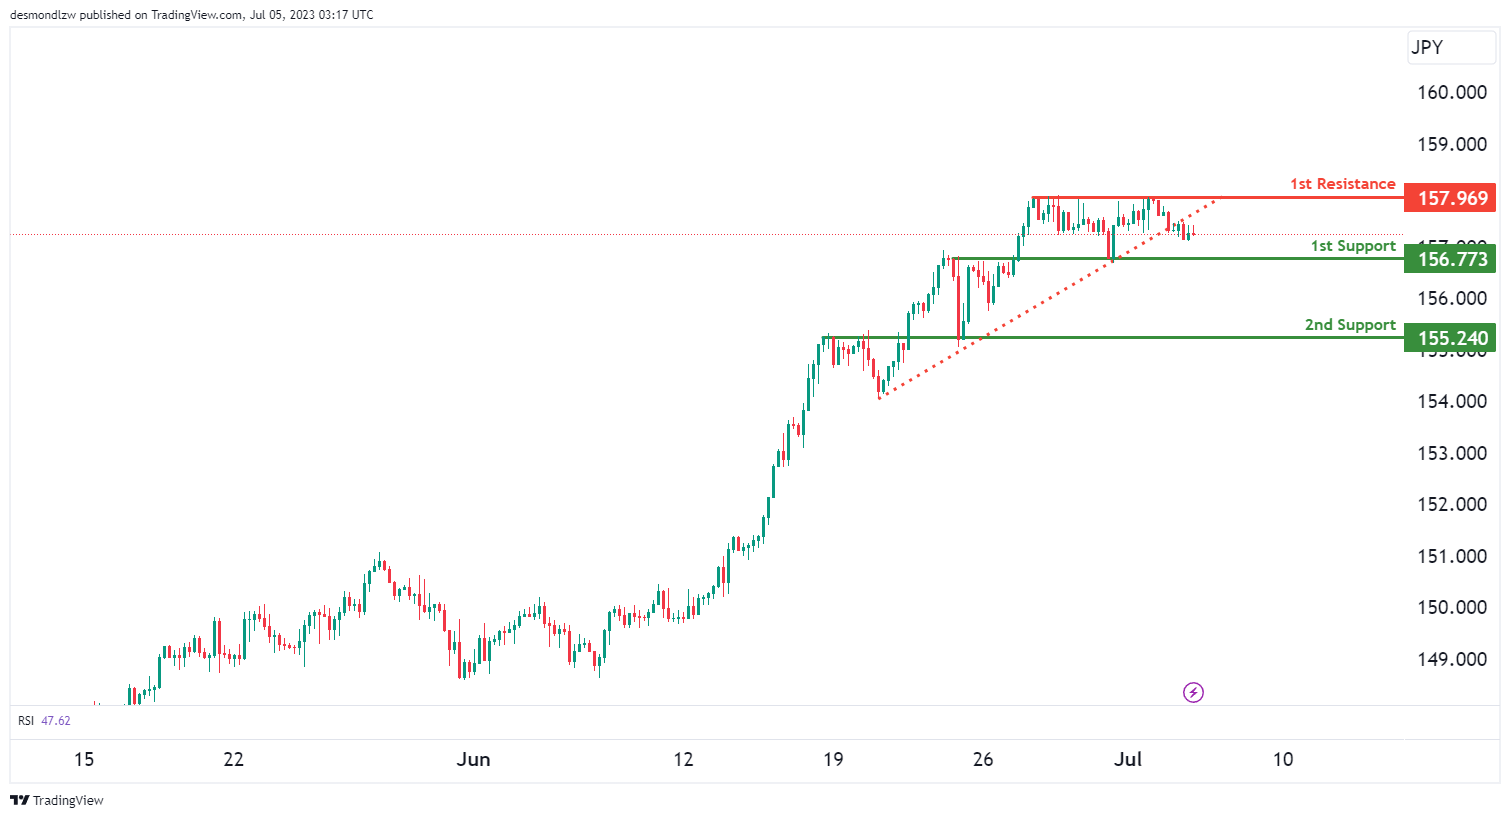
The EUR/JPY instrument is currently showing a bullish momentum on the chart. Factors contributing to this momentum include the potential for a bullish bounce off the 1st support level and a subsequent move towards the 1st resistance.
The 1st support level is at 156.77, which is considered good due to its overlap support. Similarly, the 2nd support level at 155.24 is also favorable as it aligns with an overlap support.
On the upside, the 1st resistance at 157.96 is significant as it corresponds to a multi-swing high resistance.
EUR/GBP:
The EUR/GBP instrument is currently exhibiting a weak bullish momentum on the chart with low confidence. Factors contributing to this momentum include the potential for a bullish bounce off the 1st support level and a subsequent move towards the 1st resistance.
The 1st support is located at 0.85430, which is considered good due to its overlap support. Additionally, the 2nd support level at 0.85193 is favorable as it aligns with a swing low support.
On the upside, the 1st resistance at 0.85774 is significant as it corresponds to an overlap resistance. Similarly, the 2nd resistance at 0.86272 is noteworthy as it aligns with an overlap resistance.

GBP/USD:
.The GBP/USD chart indicates a bearish momentum, suggesting a downward trend in the market. However, there is a factor contributing to the momentum, as the price is above a major ascending trend line, indicating a potential for further bullish momentum.
There is a possibility for a bearish continuation towards the first support level at 1.2673, which is an overlap support and coincides with the 50% Fibonacci Retracement. The second support level at 1.2599 also acts as an overlap support and aligns with the 50% Fibonacci Retracement.
On the upside, the first resistance level at 1.2721 represents a multi-swing high resistance and is influenced by the 50% Fibonacci Retracement. The second resistance level at 1.2771 is an overlap resistance and coincides with the 78.60% Fibonacci Retracement.

GBP/JPY:
The GBP/JPY instrument is currently demonstrating a bearish momentum on the chart. Factors contributing to this momentum include the potential for a bearish continuation towards the 1st support level.
The 1st support is located at 182.153, which is considered good due to its overlap support. Additionally, the 2nd support at 180.046 is also favorable as it aligns with an overlap support. On the upside, the 1st resistance at 184.265 is significant as it corresponds to an overlap resistance.

USD/CHF:
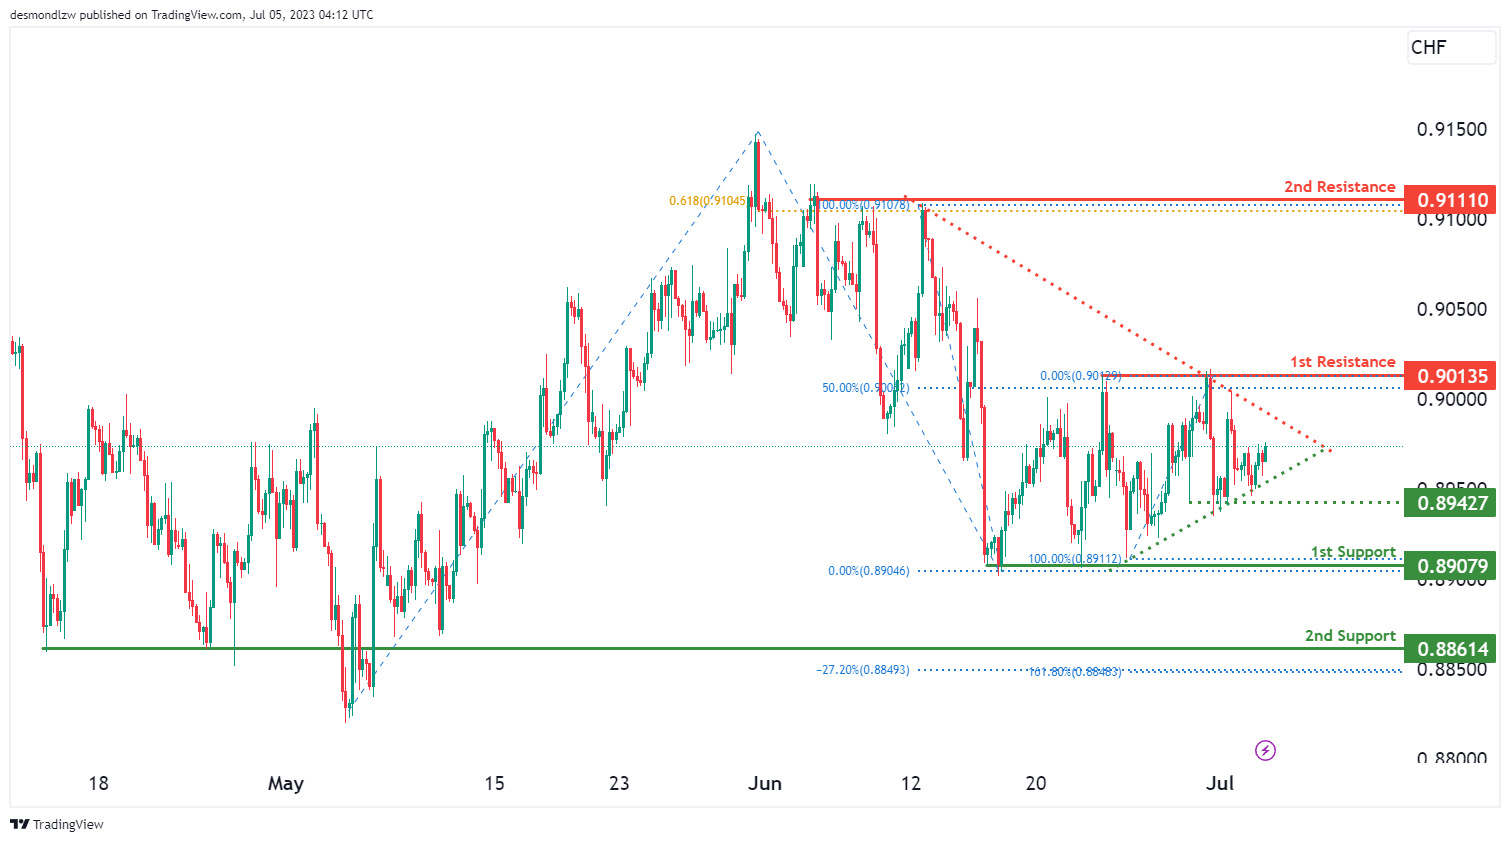
The USD/CHF chart is currently experiencing a neutral momentum, indicating a lack of clear direction in the market. The price has the potential to fluctuate between the first support level at 0.8907, which is a multi-swing low support, and the first resistance level at 0.9013, which is a multi-swing high resistance.
Furthermore, the second support level at 0.8861 acts as a pullback support and shows Fibonacci confluence with the -27% Fibonacci Expansion and the 161.80% Fibonacci Extension. The second resistance level at 0.9111 is also a multi-swing high resistance and aligns with the 61.80% Fibonacci Projection.
In addition, a symmetrical triangle chart pattern is present, indicating a period of consolidation. A breakout above the upper trendline could signal a bullish breakout, while a breakdown below the lower trendline may indicate a bearish breakdown.
USD/JPY:
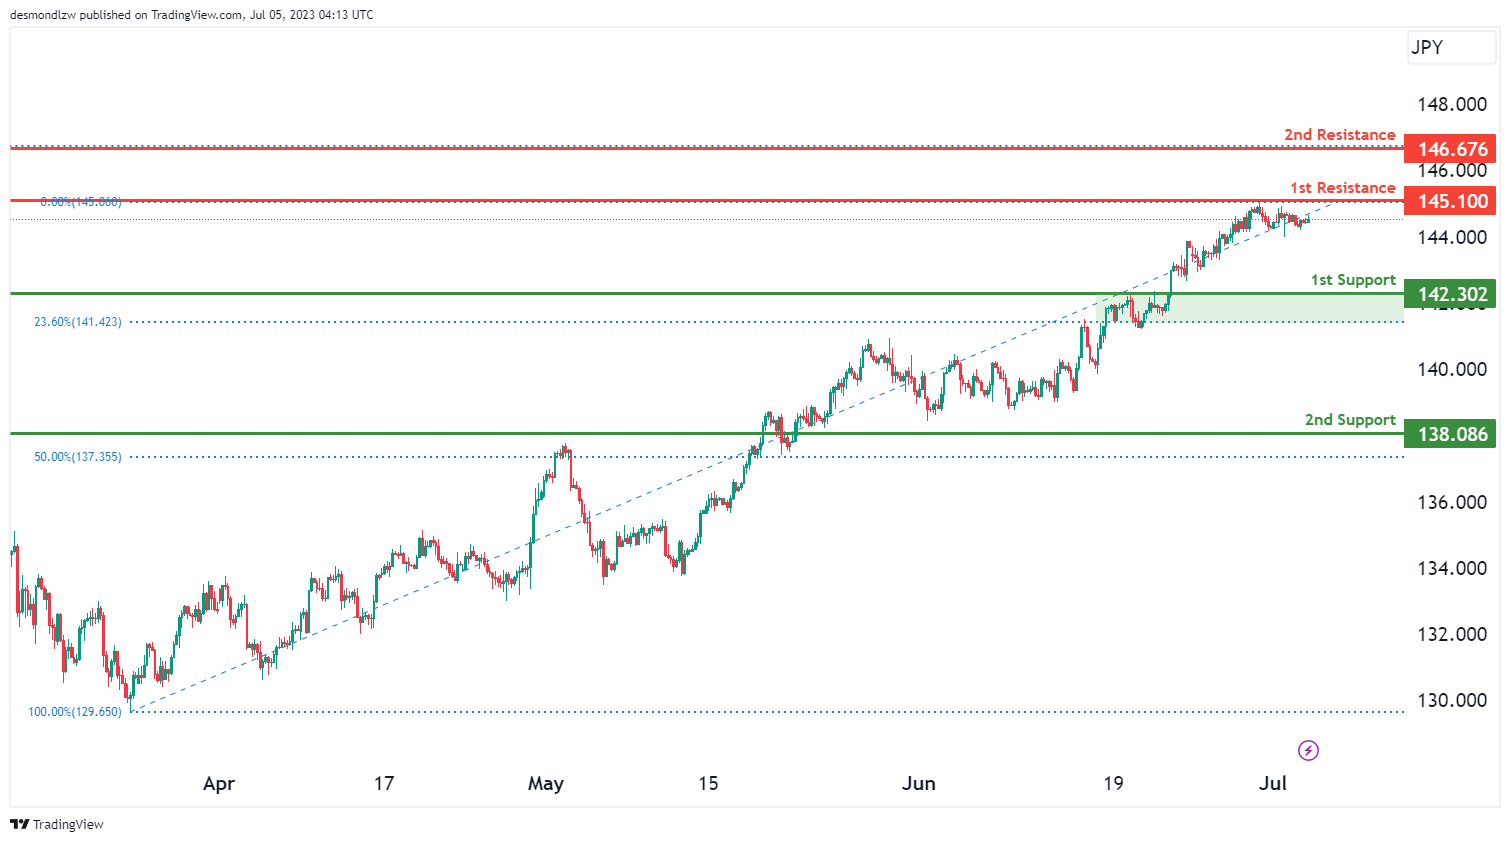
The USD/JPY chart shows a weak bullish momentum with low confidence, indicating uncertainty in the market. There is a potential for a bullish bounce off the first support level at 142.30, which acts as a pullback support, leading the price towards the first resistance level at 145.10, identified as an overlap resistance.
Additionally, the second support level at 138.08 is an overlap support, providing further strength. The second resistance level at 146.67 coincides with the 78.60% Fibonacci Retracement.
USD/CAD:
The USD/CAD chart is currently showing a weak bullish momentum with low confidence. Factors contributing to this momentum include the potential for a bullish continuation towards the 1st resistance. The 1st support level is at 1.3179, which is considered good due to its overlap support and a 61.80% Fibonacci retracement. The 2nd support level at 1.3117 is also favorable as it aligns with a swing low support.
On the upside, the 1st resistance at 1.3230 is significant as it corresponds to an overlap resistance. Similarly, the 2nd resistance at 1.3279 is noteworthy as it aligns with an overlap resistance.

AUD/USD:
The AUD/USD chart is currently demonstrating a bearish momentum. Factors contributing to this momentum include the potential for a bearish continuation towards the 1st support level. The 1st support is located at 0.6639, which is considered good due to its overlap support and a 61.80% Fibonacci retracement. Additionally, the 2nd support level at 0.6597 is favorable as it aligns with a swing low support.
On the upside, the 1st resistance at 0.6717 is significant as it corresponds to an overlap resistance and a 38.20% Fibonacci retracement. Furthermore, the 2nd resistance at 0.6799 is noteworthy as it aligns with an overlap resistance and a 61.80% Fibonacci retracement.

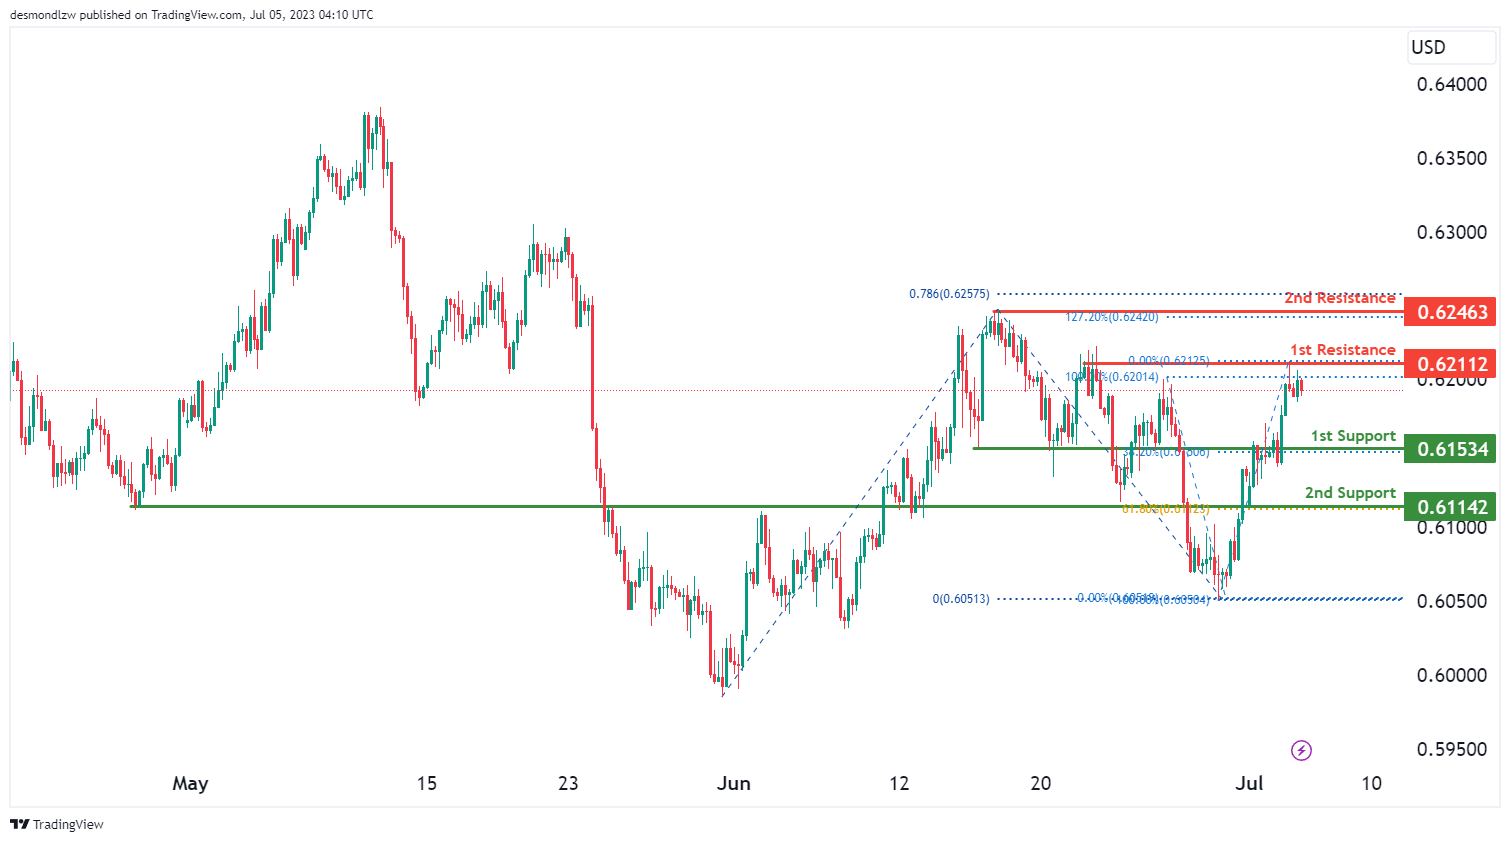
NZD/USD
The NZD/USD chart is currently exhibiting a bearish momentum. Factors contributing to this momentum include the potential for a bearish continuation towards the 1st support level. The 1st support is located at 0.6153, which is considered good due to its overlap support and a 38.20% Fibonacci retracement. Furthermore, the 2nd support level at 0.6114 is favorable as it aligns with a swing low support and a 61.80% Fibonacci retracement.
On the upside, the 1st resistance at 0.6211 is significant as it corresponds to an overlap resistance. Additionally, the 2nd resistance at 0.6246 is noteworthy as it aligns with a swing high resistance and a 127.20% Fibonacci extension.
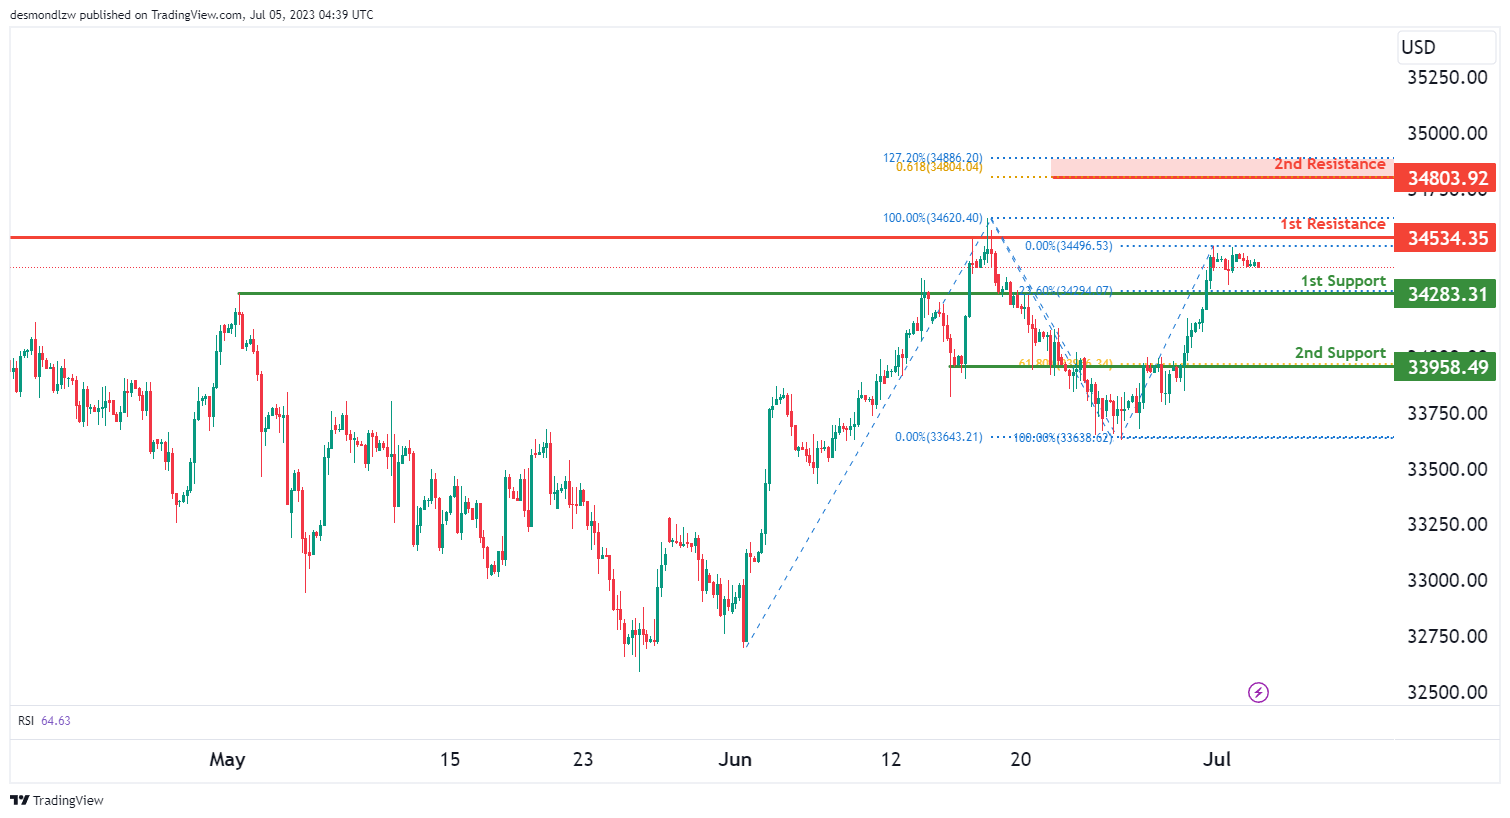
DJ30:
The DJ30 (Dow Jones Industrial Average) chart currently exhibits a neutral momentum, suggesting a lack of clear direction in the market. There is a possibility for the price to fluctuate between the 1st resistance level at 34534.35 and the 1st support level at 34283.31.
The 1st support level at 34283.31 is considered a pullback support, supported by the presence of the 23.60% Fibonacci Retracement. Additionally, the 2nd support level at 33840.48 acts as an overlap support, showing Fibonacci confluence with the presence of the 78.60% Fibonacci Retracement.
On the upside, the 1st resistance level at 34534.35 represents a multi-swing high resistance. Furthermore, the 2nd resistance level at 34803.92 indicates Fibonacci confluence, with the presence of the 127.20% Fibonacci Extension and the 61.80% Fibonacci Projection.
GER30:
The GER30 (DAX) chart is currently experiencing strong bearish momentum with high confidence. Factors contributing to this momentum include the potential for a bearish continuation towards the 1st support.
The 1st support level is at 15902.63, which is considered good due to its overlap support and a 61.80% Fibonacci retracement. Additionally, the 2nd support level at 15674.94 is favorable as it aligns with a multi-swing low support and a 78.60% Fibonacci projection.
On the upside, the 1st resistance at 16108.30 is significant as it corresponds to an overlap resistance. Furthermore, the 2nd resistance at 16214.64 is noteworthy as it aligns with a swing high resistance.

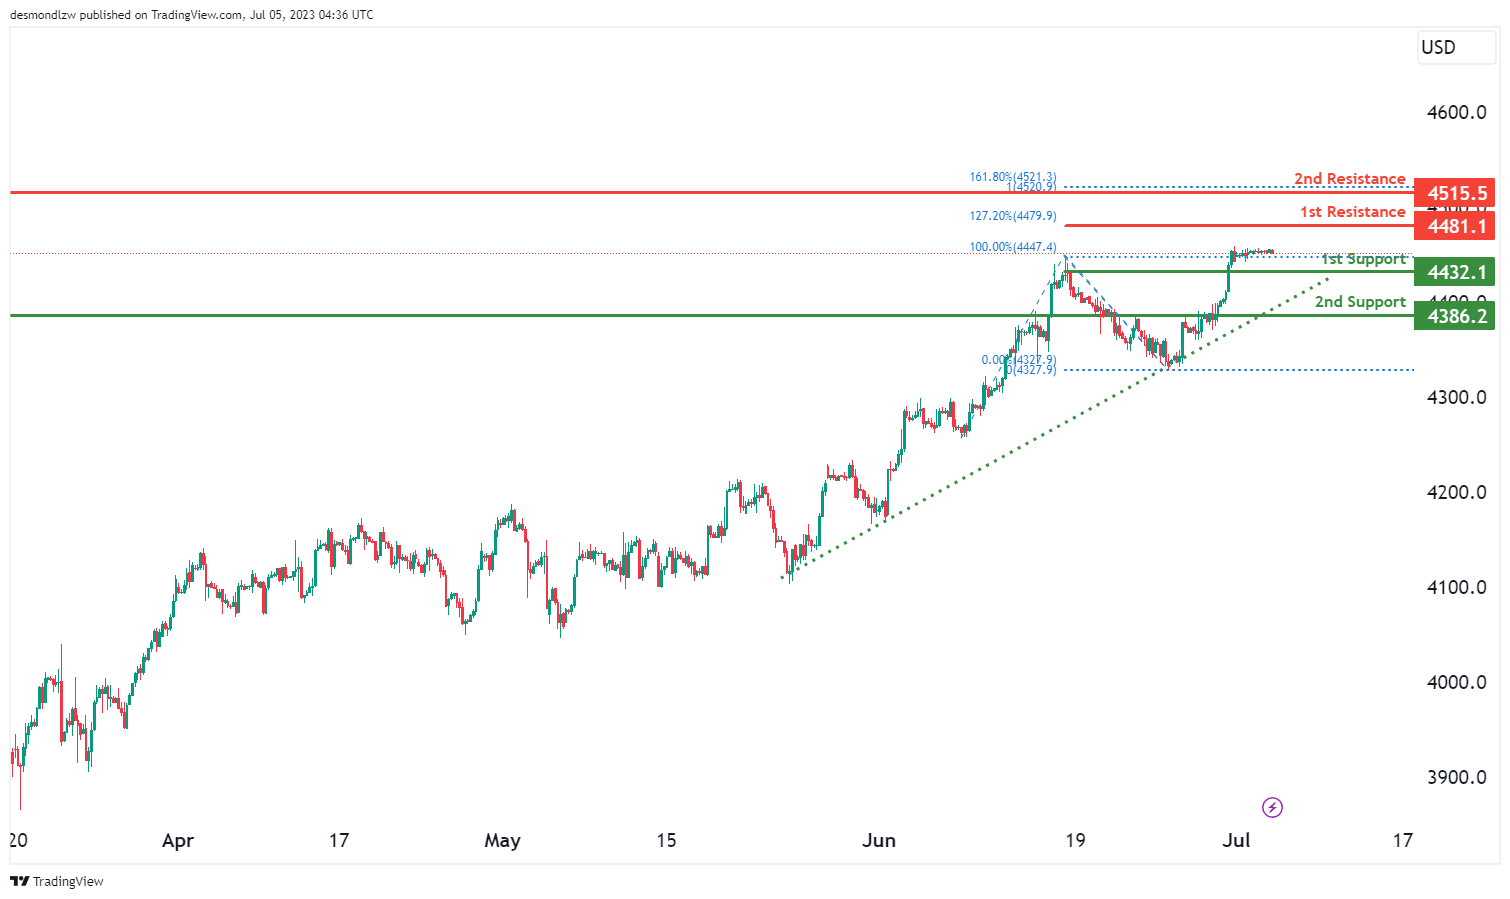
US500
The US500 instrument is currently showing a neutral momentum on the chart. Factors contributing to this momentum include the price’s tendency to fluctuate between the 1st resistance and 1st support level.
The 1st support level is at 4432.1, which is considered good due to its overlap support. Similarly, the 2nd support level at 4386.2 is also favorable as it aligns with an overlap support.
On the upside, the 1st resistance at 4481.1 is significant as it corresponds to an overlap resistance and a 127.20% Fibonacci expansion. Additionally, the 2nd resistance at 4515.5 is noteworthy as it aligns with a swing high resistance and a 161.80% Fibonacci expansion.
BTC/USD:
The BTC/USD instrument is currently exhibiting a bullish momentum. Factors contributing to this momentum include the potential for a bullish continuation towards the 1st resistance.
The 1st support level is at 29826, which is considered good due to its overlap support.
Additionally, the 2nd support level at 28274 is also favorable as it aligns with an overlap support and a 50% Fibonacci retracement.
On the upside, the 1st resistance at 31457 is significant as it corresponds to a multi-swing high resistance. Furthermore, the 2nd resistance at 32252 is noteworthy as it aligns with a swing high resistance and a 61.80% Fibonacci projection.

ETH/USD:
The ETH/USD instrument currently shows a weak bearish momentum with low confidence. The existing factors indicate that the price could potentially react bearishly off the 1st resistance and drop to the 1st support.
The 1st support level is at 1916.98, providing a solid foundation due to its overlap support nature. The 2nd support stands at 1852.66, offering a strong base with its swing low support characteristic and a 78.6% Fibonacci Retracement.
As for resistance levels, the 1st resistance is at 1970.64, posing a significant hurdle as a swing high resistance. The 2nd resistance is at 2017.96, presenting a substantial challenge due to its swing high resistance nature and is reinforced by a 127.20% Fibonacci Expansion. These conditions collectively shape the weak bearish momentum of ETH/USD with low confidence.

WTI/USD:
The WTI/USD instrument is currently showing a weak bullish momentum on the chart with low confidence. Factors contributing to this momentum include the potential for a bullish continuation towards the 1st resistance. The 1st support level is at 70.14, which is considered good due to its overlap support. The 2nd support level at 68.27 is also favorable as it aligns with a swing low support and a 78.60% Fibonacci retracement.
On the upside, the 1st resistance at 71.55 is significant as it corresponds to a swing high resistance. Similarly, the 2nd resistance at 72.78 is noteworthy as it aligns with an overlap resistance.

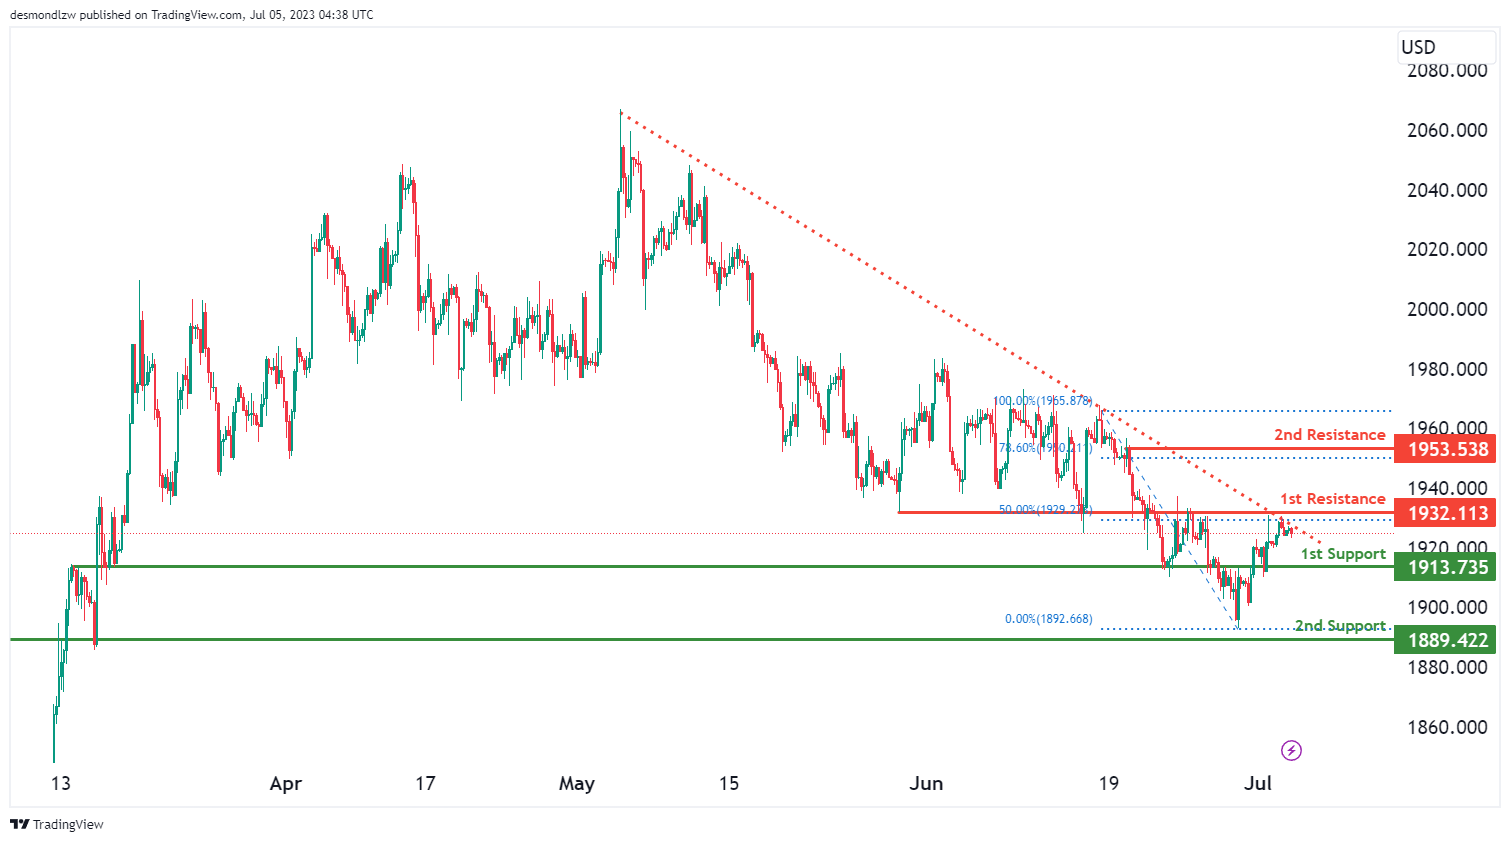
XAU/USD (GOLD):
The XAU/USD chart exhibits a bearish momentum, indicated by the price being below a major descending trend line, suggesting the potential for further downward movement.
There is a possibility of a bearish continuation towards the first support level at 1913.73, identified as an overlap support. Additionally, the second support level at 1889.42 also acts as an overlap support.
On the upside, the first resistance level at 1932.11 represents an overlap resistance, with the presence of the 50% Fibonacci Retracement. Furthermore, the second resistance level at 1953.53 is a swing high resistance and coincides with the 78.60% Fibonacci Retracement.
The accuracy, completeness and timeliness of the information contained on this site cannot be guaranteed. IC Markets does not warranty, guarantee or make any representations, or assume any liability regarding financial results based on the use of the information in the site.
News, views, opinions, recommendations and other information obtained from sources outside of www.icmarkets.com, used in this site are believed to be reliable, but we cannot guarantee their accuracy or completeness. All such information is subject to change at any time without notice. IC Markets assumes no responsibility for the content of any linked site.
The fact that such links may exist does not indicate approval or endorsement of any material contained on any linked site. IC Markets is not liable for any harm caused by the transmission, through accessing the services or information on this site, of a computer virus, or other computer code or programming device that might be used to access, delete, damage, disable, disrupt or otherwise impede in any manner, the operation of the site or of any user’s software, hardware, data or property.


