
Key risk events today:
RBA Gov Lowe Speaks; China Caixin Services PMI; UK Final Services PMI; ECB President Lagarde Speaks; US ADP Non-Farm Employment Change; Canada Trade Balance; US ISM Non-Manufacturing PMI; Crude Oil Inventories; (CAD) Gov. Council Member Wilkins Speaks.
EUR/USD:
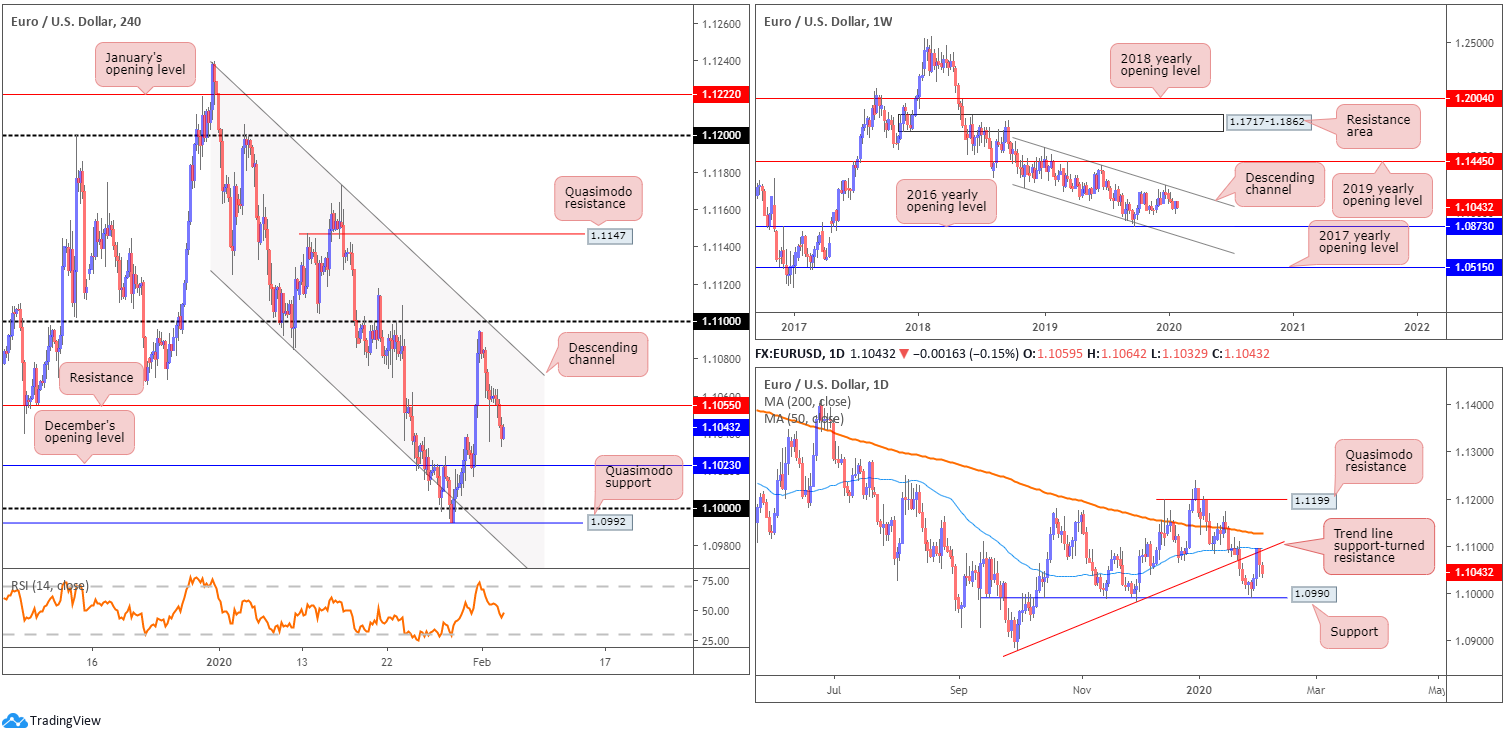
The euro sustained a steady depreciation vs. the US dollar Tuesday, extending Monday’s slide from just south of the 1.11 handle on the H4 timeframe. The US dollar index, or DXY, firmed, albeit off its intraday highs of 98.01.
Amid a lack of notable data/speakers, EUR/USD scored lows of 1.1032 yesterday and mildly pared losses into London’s close. H4 support at 1.1055 gave way (now a serving resistance level) and exposed possible support at December’s opening level from 1.1023. The key figure 1.10 and Quasimodo support at 1.0992 are next on tap, in the event we dethrone 1.1023. Indicator-based traders might also find use in noting the relative strength index (RSI) crossed below its mid-way point, the 50.00 value. Some traders use this as a method of confirming the trend.
Daily trend line support-turned resistance, taken from the low 1.0879, and the 50-day SMA (blue – 1.1094) held price action lower Monday, with a continuation move seen Tuesday. Additional downside has support at 1.0990 in sight, whereas a recovery could, assuming a break of the current trend line resistance, reveal the 200-day SMA (orange – 1.1125).
Further afield, weekly movement has price languishing beneath long-standing channel resistance, drawn from the high 1.1569. Downside targets rest at the 2016 yearly opening level from 1.0873 followed by channel support, taken from the low 1.1109. Further supporting sellers is the primary trend, down since topping in early 2018, at 1.2555.
Areas of consideration:
For traders who read Tuesday’s technical briefing you may recall the following:
Daily selling from the trend line resistance/50-day SMA combination is likely to weigh on this pair further today, perhaps overthrowing the current H4 support at 1.1055. A H4 close south of 1.1055 will unlock bearish themes to December’s opening level at 1.1023, the key figure 1.10 and Quasimodo support at 1.0992. Aggressive sells may be viewed on the breakout candle’s close, with stop-loss orders positioned accordingly. Conservative traders, on the other hand, may opt to wait and see if a retest at 1.1055 forms before pulling the trigger (entry/risk can be determined according to the rejection candle’s structure).
Traders short yesterday’s H4 close beneath 1.1055, great work. The move lower was likely enough to warrant a breakeven trigger: reduce risk to breakeven. Those who missed the aforementioned short, on waiting for a retest to form, may get their chance today.
GBP/USD:
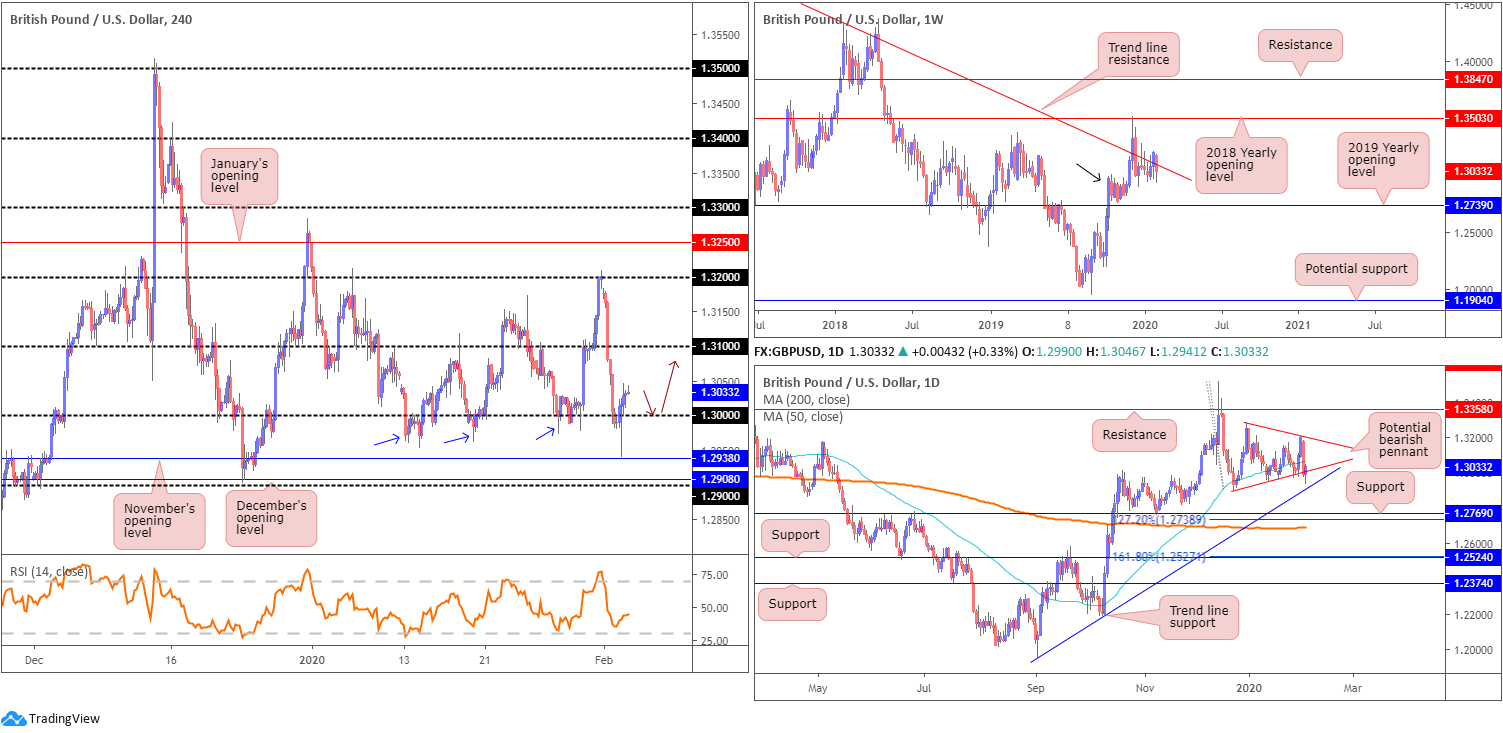
Early European hours Tuesday staged what appears to be a stop-run through key figure 1.30 and support pivots (blue arrows) at 1.2954, 1.2961 and 1.2975, before turning higher a whisker above November’s opening level at 1.2938. H4 price reclaimed 1.30+ status during London, possibly driven by UK housing data.
Markit noted: the headline seasonally adjusted IHS Markit/CIPS UK Construction Total Activity Index rebounded from 44.4 in December to 48.4 in January. The latest reading was still below the 50.0 no-change threshold, but signalled the slowest fall in overall construction output for eight months.
With H4 establishing a position north of 1.30, there’s little stopping price from shaking hands with the 1.31 handle on the H4 timeframe. Daily price came within striking distance of trend line support, taken from the low 1.1958, yesterday and is now poised to cross swords with the underside of its 50-day SMA (blue – 1.3067). Also worthy of note is the potential bearish pennant formation, from a high of 1.3284 and a low from 1.2904.
The move back beneath long-standing trend line resistance on the weekly timeframe, pencilled in from the high 1.5930, helps validate the daily bearish pennant formation. Assuming a close lower (on a weekly basis), we could see further selling on the daily timeframe, and ultimately a close beneath both the bearish pennant’s lower boundary and current daily trend line support. Another thing to be aware of, though, is weekly demand around the 1.2939 region (black arrow).
Areas of consideration:
Longer term, the technical picture illustrates further losses may be on the horizon. Short-term activity, however, boasts a clear run north to 1.31. Still, remain aware that on the daily timeframe, the 50-day SMA lurks around the 1.3066ish region.
A retest at 1.30 today, preferably in the shape of a H4 bullish candlestick signal, could prompt intraday buying interest, targeting the aforementioned 50-day SMA and then 1.31. The rationale behind additional candlestick confirmation off 1.30 is to help avoid a whipsaw or an unnecessary loss, as the higher-timeframe picture points to a possible move lower (see above).
AUD/USD:
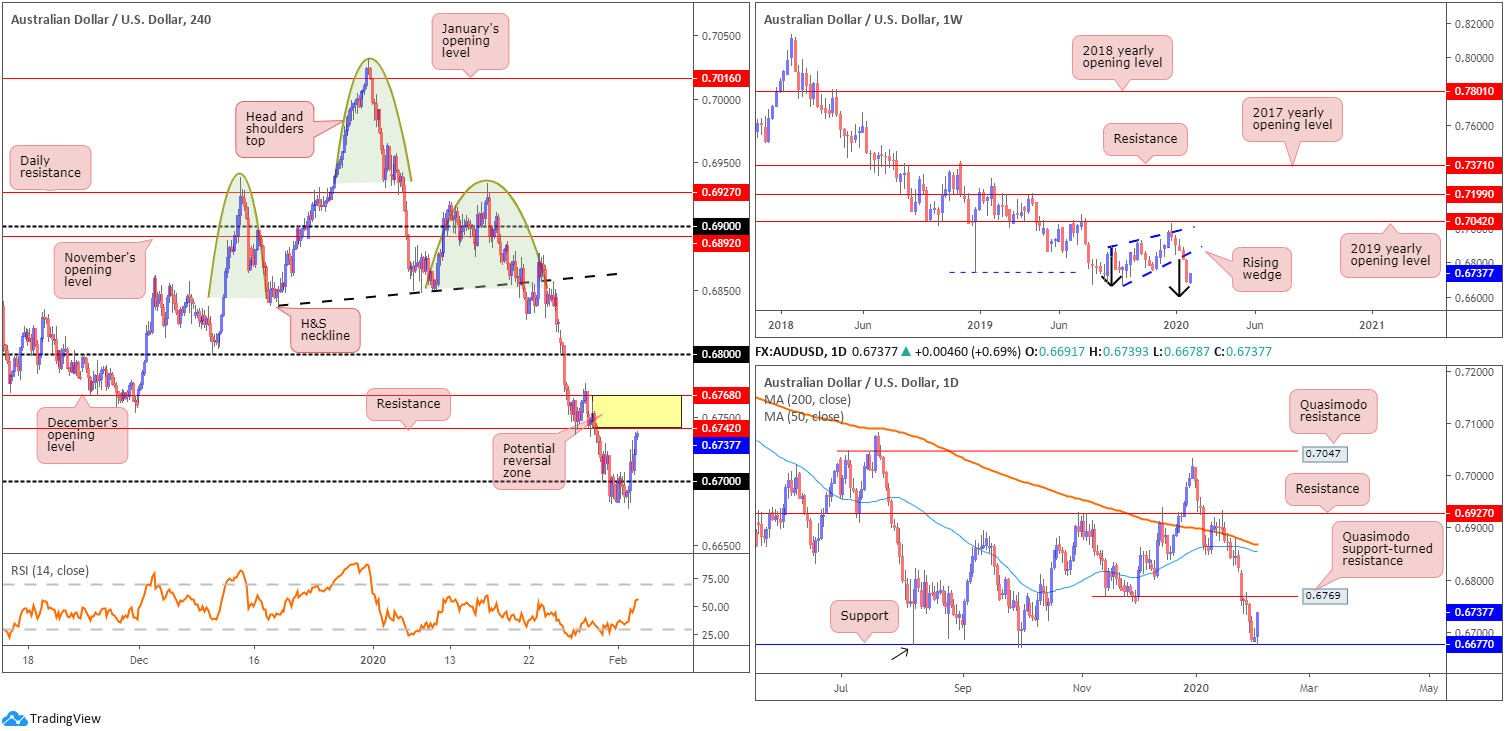
A point north of daily support at 0.6677, AUD/USD pencilled in a healthy recovery Tuesday, adding more than 45 points, or 0.68%. The pair retained an underlying bid post-RBA, which saw the policy rate unchanged, easing bias maintained, GDP forecasts left largely untouched and downplayed commentary surrounding bushfires and the coronavirus. This, along with additional tailwinds derived from overall risk appetite, observed H4 price settle south of resistance at 0.6742, after reclaiming 0.67+ status.
The relative strength index (RSI) on the H4, for those who follow indicators, recently climbed above its mid-way point, the 50.00 value.
Daily flow exhibits scope to approach Quasimodo support-turned resistance, extended from 0.6769, following the move above support at 0.6677.
Despite yesterday’s recovery, the weekly timeframe’s overall structure remains intact (italics):
Since registering a bottom in late September at 0.6670 (2019), price carved out a rising wedge formation, typically considered a continuation pattern within a trending environment.
The past five weeks witnessed price decline back into the rising wedge and, thanks to recent selling, break and extend beyond the lower edge. With the primary downtrend having been in full force since topping at 0.8135, in early 2018, moves lower should have always been a possibility.
Assuming a break of the 0.6670 September 30th low, the rising wedge take-profit (black arrows – calculated by taking the height of the base and adding it the breakout point) is seen at 0.6614, followed by support at 0.6359 (not visible on the screen).
Areas of consideration:
Weekly action suggesting further selling may be in store, along with possible resistance close by on the daily timeframe at 0.6769, highlights a potential reversal zone on the H4 timeframe (yellow) between December’s opening level at 0.6768 and resistance at 0.6742. Note daily resistance is positioned a point above the noted H4 area.
Traders may watch 0.6768/0.6742 for signs of selling today, targeting 0.67 as the initial downside support. Signs of selling may be interpreted as something as simple as a bearish candlestick pattern; others may prefer drilling down to the lower timeframes and searching for a sell off local structure, a trend line support break/retest setup, for example. This is trader dependent.
USD/JPY:
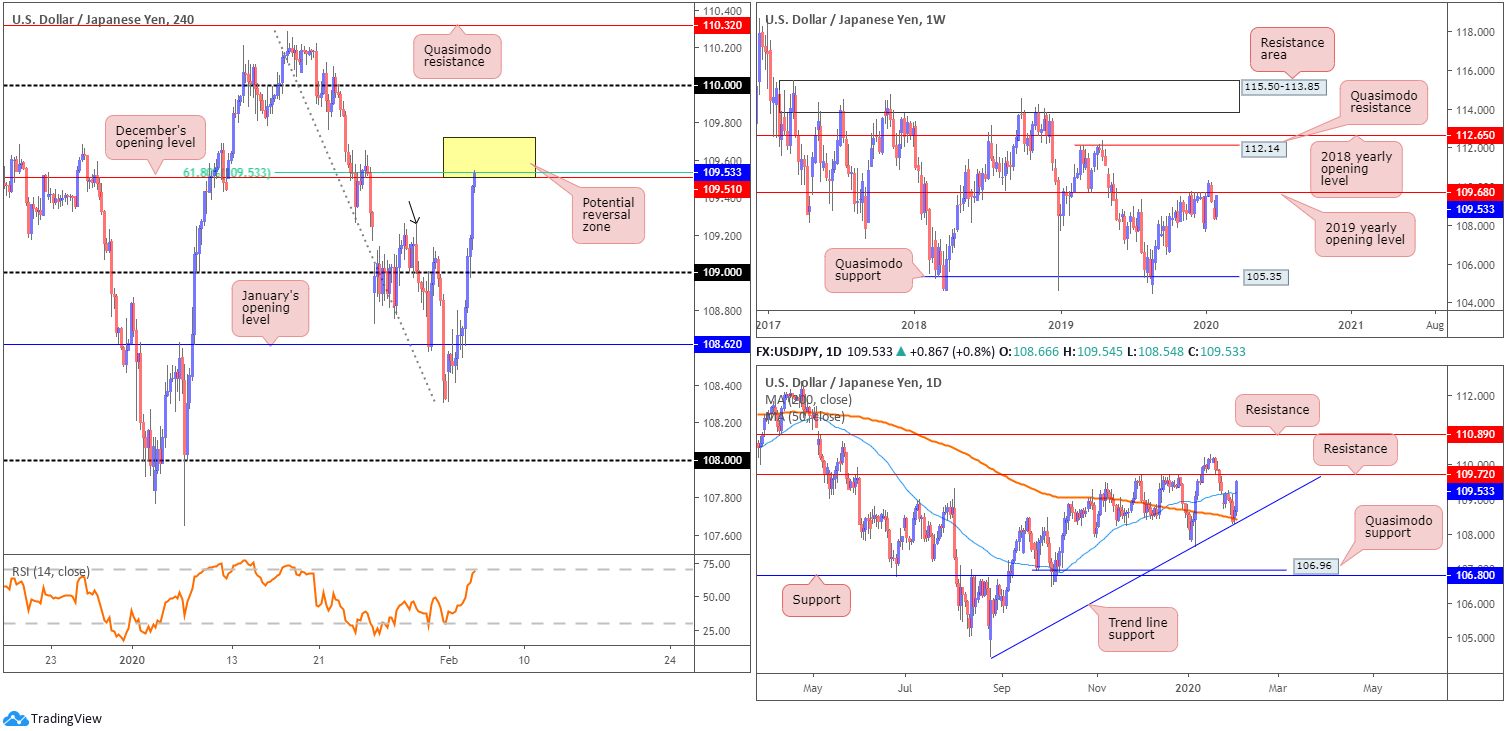
The US dollar index, or DXY, modestly built on Monday’s gains, piercing 98.00 on Tuesday; US Treasury yields staged a solid recovery, gaining more than 4.00% and major US equity benchmarks advanced across the board. USD/JPY bulls entered an offensive phase, following a decisive retest off January’s opening level at 108.62, by way of a H4 hammer candlestick pattern (considered a bullish signal at troughs).
H4 flow gathered traction and jumped through 109, eventually crossing paths with December’s opening level at 109.51. Recent buying also drew the relative strength index (RSI) towards its overbought value.
Meanwhile, movement on the daily timeframe traded off the 200-day SMA (orange – 108.42), supported by a familiar nearby trend line formation, extended from the low 105.59, Monday, and extended higher Tuesday. The move north drove through the 50-day SMA (blue – 109.20) and exposed resistance priced in at 109.72.
Further out, price action on the weekly timeframe, after scoring lows at 108.31 last week, is poised to retest resistance at 109.72.
Areas of consideration:
The area (yellow) on the H4 timeframe between 109.72 and December’s opening level at 109.51 is a zone worthy of consideration for a move lower today.
Building a case for entry, the area offers the following:
- Daily resistance at 109.72 (the upper edge of the reversal zone).
- Weekly resistance (2019 yearly opening level) at 109.68.
- December’s opening level (resistance) on the H4 timeframe at 109.51 (the lower edge of the reversal zone).
- A H4 61.8% Fibonacci retracement at 109.53.
- H4 RSI approaching overbought status.
Entry a current price is an option, with protective stop-loss orders sited a few points above 109.72, targeting 109.27 (the 29th January tops – black arrow), followed by the 50-day SMA at 109.20 and then the round number 109.
USD/CAD:
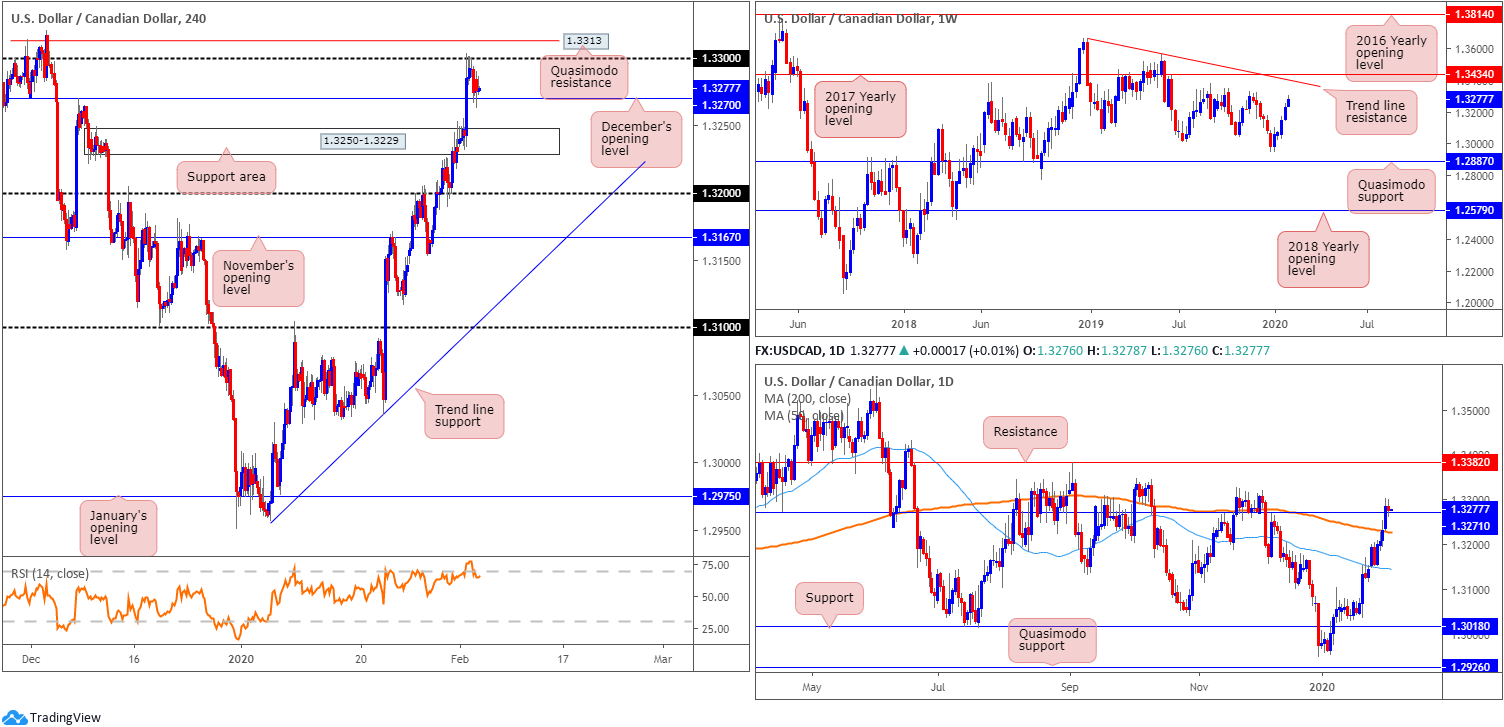
While some analysts forecast a correction in USD/CAD, technical structure suggests otherwise. Monday witnessed H4 action strongly overwhelm sellers at December’s opening level drawn from 1.3270 and strike a session high above the psychological threshold 1.33 at 1.3308. The pullback from said highs yesterday reconnected with 1.3270 and is, at least for the time being, holding as support. Beyond 1.33, Quasimodo resistance resides close by at 1.3313. It may also interest some traders to note the relative strength index (RSI) is seen exiting overbought territory after reaching highs of around 79.00.
On a wider perspective, support is also derived from the daily timeframe, following the break/retest of resistance at 1.3271 (essentially the same level as December’s opening level on the H4 timeframe). Note above the current support, the research team sees little in the way of active supply to the left of price until reaching resistance at 1.3382. Further adding to the bullish bias, weekly price shows room to advance as far north as tops around 1.3317, closely followed by trend line resistance (1.3661) and the 2017 yearly opening level at 1.3434.
Areas of consideration:
Although H4 price recently faded the 1.33 handle and modestly swerved lower, December’s opening level at 1.3270 is seen holding firm on H4, as is daily support at 1.3271. This, as well as weekly price exhibiting scope to press higher, may encourage additional buying today, with a break of 1.33 and possibly H4 Quasimodo resistance at 1.3313 in the pipeline.
Conservative traders may seek additional confirmation off 1.3270, likely in the form of a bullish candlestick signal, before pulling the trigger. This is perhaps due to the threat of a possible fakeout to nearby H4 support area at 1.3250-1.3229 and the RSI signalling a move lower.
USD/CHF:
Risk-on flow and the US dollar index catching a modest bid dominated markets Tuesday, sending the safe-haven Swiss franc, Japanese yen and gold lower against the US dollar.
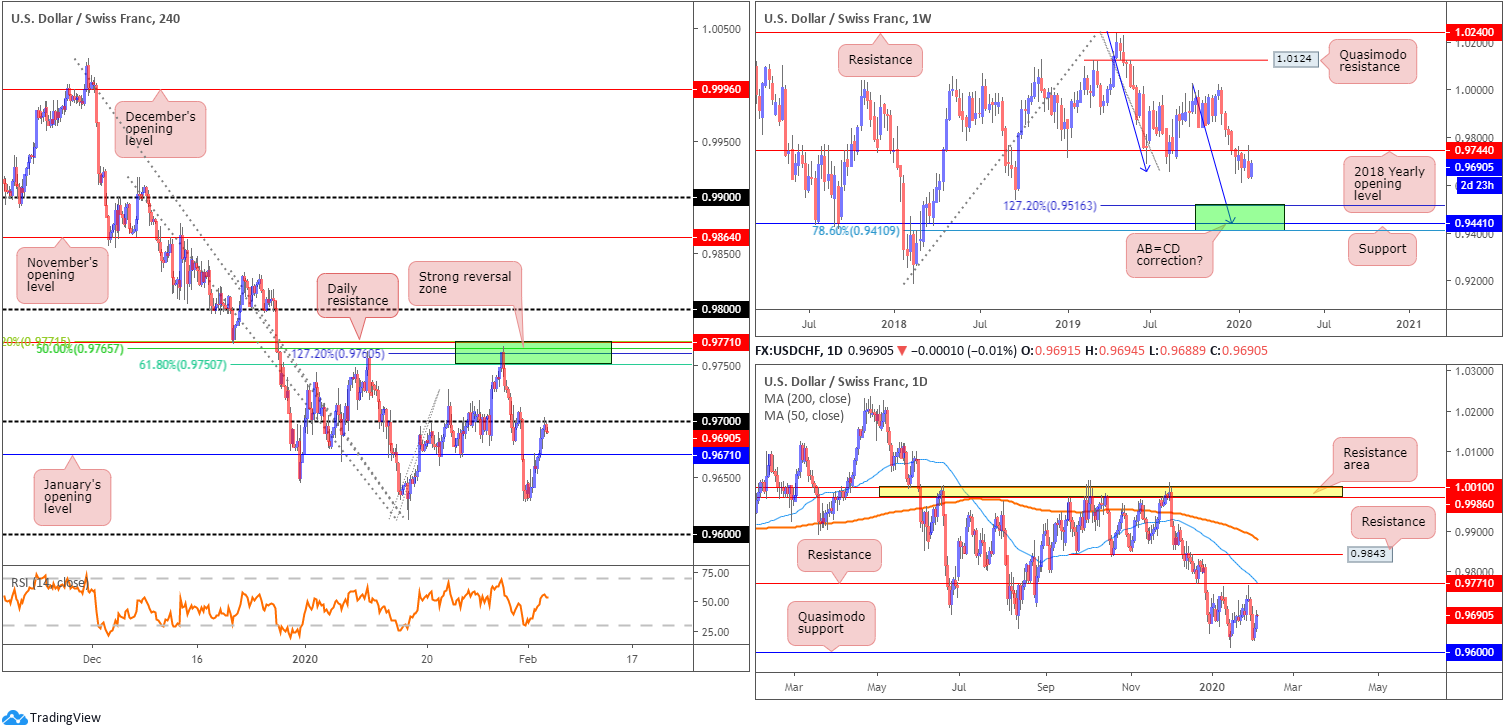
Recent buying saw H4 candles dip their toes in waters above January’s opening level at 0.9671 consequently connecting with the 0.97 handle. As evident from the H4 timeframe, a break of 0.97 may lead to an approach towards a strong area of Fibonacci confluence and nearby daily resistance at 0.9771, between 0.9771/0.9750 (green). Note this area held price action strongly lower in late January.
In terms of the weekly timeframe, in the mould of a notable outside candlestick pattern, price turned lower from the 2018 yearly opening level at 0.9744, a resistance, and wrapped up the week a few points off lows at 0.9628. Despite the recent recovery over the last couple of days, the next downside target on the weekly sits within 0.9410/0.9516, comprised of a 78.6% Fibonacci retracement at 0.9410, support at 0.9441 and a 127.2% AB=CD bullish correction (black arrows]) at 0.9516 – green.
Areas of consideration:
The research team sees limited evidence, technically that is, to suggest further downside from 0.97 today, with the line in the sand set at January’s opening level 0.9671.
Ultimately, a break north of 0.97 is ideal. This, followed through with a retest of the figure as support (entry and risk can be set according to the rejection candle’s structure), is likely sufficient to entice buying to 0.9771/0.9750 – not only a take-profit target for any longs but also a possible reversal zone to the downside, given its aligning confluence.
Dow Jones Industrial Average:
Major US equity benchmarks finished sharply higher Tuesday, as volatility gained a foothold amid efforts by Beijing to combat the economic impact of the Coronavirus.
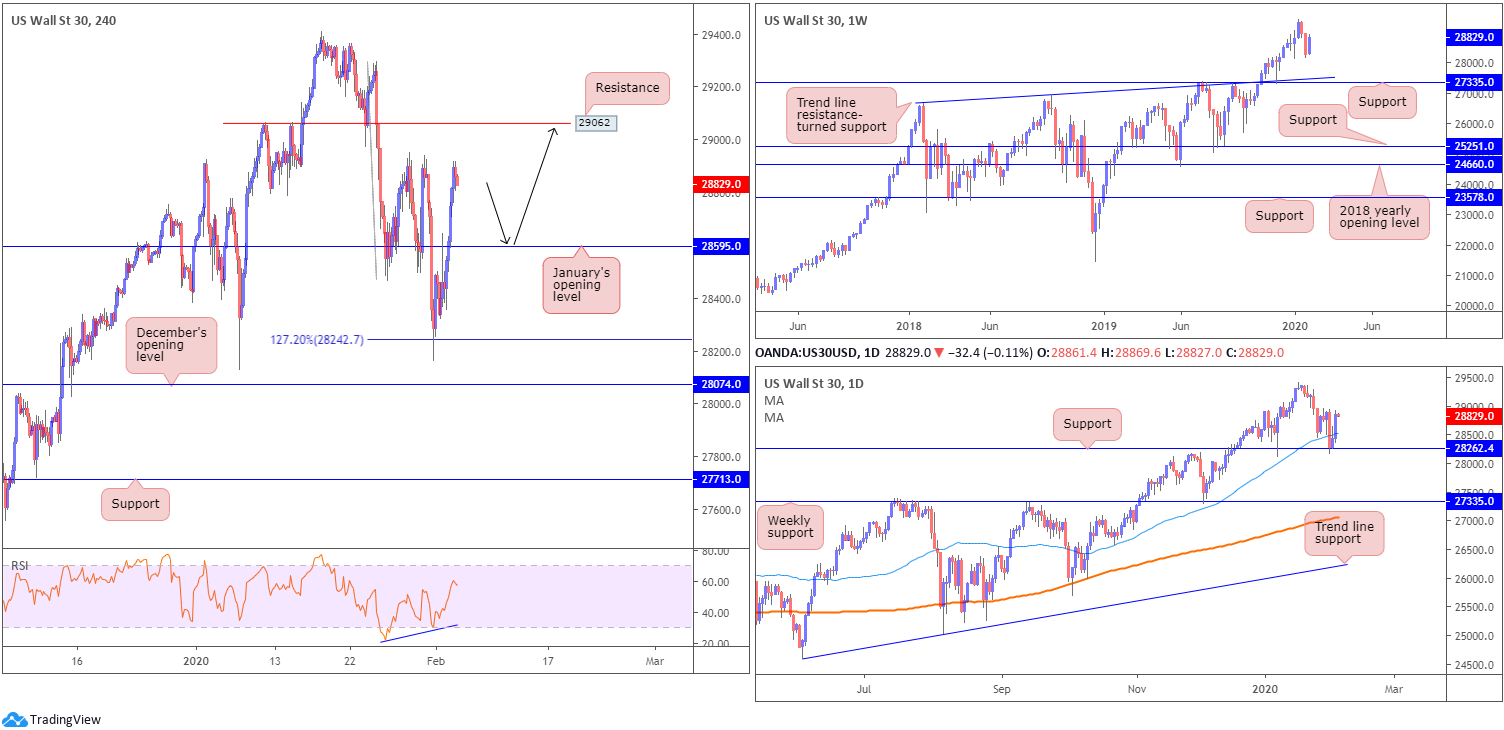
Monday rallied from daily support at 28262, which saw price extend gains yesterday and jump back through the 50-day SMA (blue – 28532). In addition to this, H4 movement found support off a 127.2% Fibonacci extension at 28242, confirmed by the relative strength index (RSI) producing bullish divergence (blue line). Tuesday, on the H4 timeframe, witnessed a strong close through January’s opening level at 28595, settling a few points south of familiar tops around the 28940ish region.
In terms of nearby resistance in this market, the aforementioned tops seen on the H4 timeframe could pose a problem for buyers, as could resistance at 29062. Resistance on the daily timeframe is relatively limited, similar to the weekly timeframe, until reaching all-time highs set at 29409.
Areas of consideration:
A retest at January’s opening level from 28595 on the H4 timeframe may be a scenario worthy of attention today. Interestingly, the aforementioned level converges closely with the current value of the 50-day SMA (blue – 28532). Upside targets from this point falls in at H4 tops around 28940 and H4 resistance at 29062.
Whether or not you wait for additional confirmation to form off 28595 before committing is trader dependent, though it is worth considering to help avoid any whipsaws that may materialise.
XAU/USD (GOLD):
Down 2.26% so far this week, demand for the safe-haven metal continues to diminish amid risk-on trade.
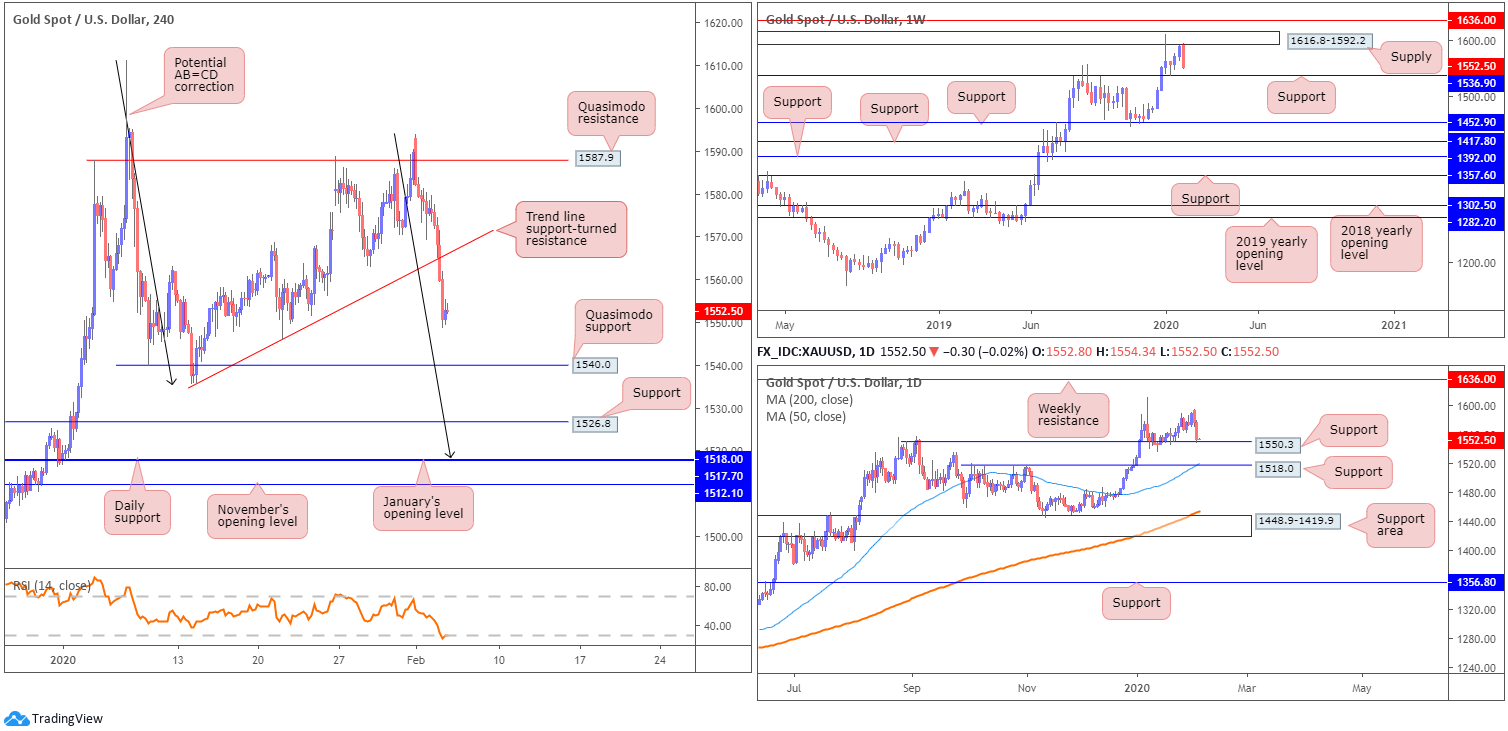
Bullion tunnelled through H4 trend line support, extended from the low 1536.2, Tuesday, also breaching numerous intraday lows and highlighting Quasimodo support at 1540.0 as the next port of call on the H4 timeframe.
While short-term activity portends further downside, daily movement recently shook hands with support coming in at 1550.3, fixed north of another layer of support at 1518.0, which happens to currently merge with the 50-day SMA (blue – 1519.7).
Against the backdrop of short-term movement, the weekly timeframe shows price fading the underside of supply drawn from 1616.8-1592.2, with the next point of support coming in at 1536.9.
Areas of consideration:
Although a recovery off daily support at 1550.3 may develop today, the higher-probability trade/long appears to be off the H4 Quasimodo support at 1540.0. The reason? Weekly support converges closely with the level at 1536.9.
An alternative setup, albeit a little lower on the curve, is the completion of a H4 bullish AB=CD correction (black arrows) terminating at daily support from 1518.0 and January’s opening level at 1517.7. Note this level, as highlighted above, also boasts additional support from the current 50-day SMA value.
Both 1540.0 and 1518.0 represent viable levels in this market for potential buying opportunities. Traders may wait and see which level, if any, produces a H4 bullish candlestick signal before pulling the trigger. Not only will this provide entry/risk levels to work with, it’ll help identify which level is likely to hold.
The accuracy, completeness and timeliness of the information contained on this site cannot be guaranteed. IC Markets does not warranty, guarantee or make any representations, or assume any liability regarding financial results based on the use of the information in the site.
News, views, opinions, recommendations and other information obtained from sources outside of www.icmarkets.com.au, used in this site are believed to be reliable, but we cannot guarantee their accuracy or completeness. All such information is subject to change at any time without notice. IC Markets assumes no responsibility for the content of any linked site.
The fact that such links may exist does not indicate approval or endorsement of any material contained on any linked site. IC Markets is not liable for any harm caused by the transmission, through accessing the services or information on this site, of a computer virus, or other computer code or programming device that might be used to access, delete, damage, disable, disrupt or otherwise impede in any manner, the operation of the site or of any user’s software, hardware, data or property.


