
Key risk events today:
UK Final Services PMI; US ADP Non-Farm Employment Change; BoC Rate Statement and Overnight Rate; US ISM Non-Manufacturing PMI; Crude Oil Inventories.
EUR/USD:
(Italics represents previous writing).
Despite USD sellers strengthening their grip, largely on the back of global trade concerns, EUR/USD settled Tuesday unmoved.
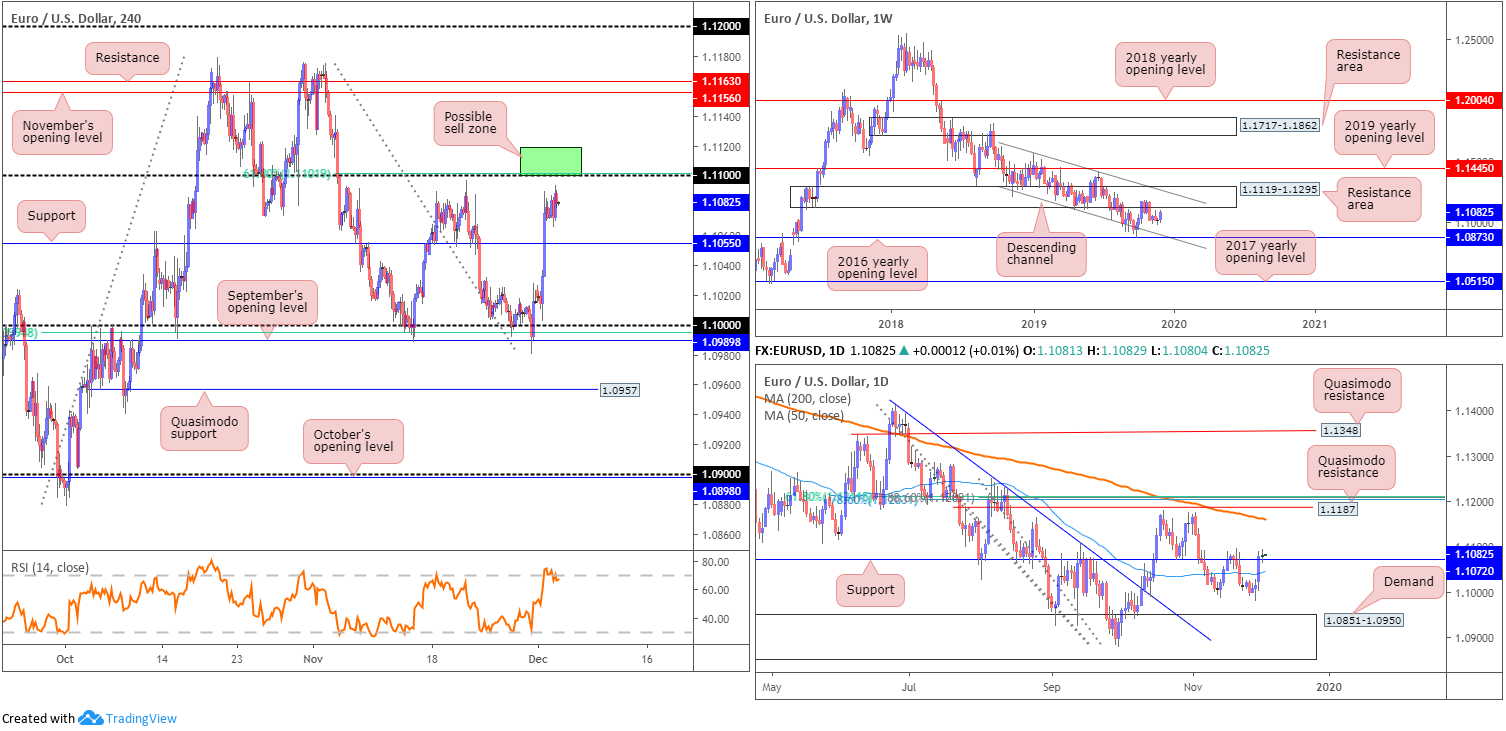
The weekly timeframe remains loitering south of a long-standing resistance area at 1.1119-1.1295. Since November 2018, the pair has also remained compressed within a descending channel on this scale, moulded from a high set at 1.1569 and a low of 1.1109. Based on this scale, support is not expected to emerge until the lower boundary of the descending channel, which happens to merge closely with the 2016 yearly opening level at 1.0873. In addition to structure, the primary downtrend has been in motion since topping in early 2018 at 1.2555.
Interestingly, movement on the daily timeframe has price trading north of support coming in at 1.1072, in the shape of a doji indecision candle. Continued bidding from this point could push as far north as the 200-day SMA (orange – 1.1161), closely trailed by Quasimodo resistance at 1.1187.
Meanwhile, across the page on the H4 timeframe, the unit consolidates a few points south of the 1.11 handle, set as the next possible ceiling in this market. Beyond here, scope to press as far north as 1.1163/1.1156 is visible (combination of resistance and November’s opening level).
Areas of consideration:
The area marked in green on the H4 timeframe between 1.1119 (the underside of the weekly resistance area) and the 1.11 handle signifies a probable resistance zone, with H4 support at 1.1055 fixed as the initial target. Fibonacci studies also show the 61.8% ratio converges closely with the round number 1.11 at 1.1102.
The concern for sellers, however, is daily price trading above support at 1.1072. For that reason, traders may want to consider waiting for additional H4 bearish candlestick confirmation to form before committing to 1.1119/1.11 – a H4 shooting star pattern, or a bearish engulfing formation (entry and risk can then be set according to this structure) should suffice.
GBP/USD:
(Italics represent previous writing).
Cable traded firmer Tuesday amid hotter-than-expected UK Markit Construction PMI, and latest election polls displaying a widening lead in favour of Conservatives.
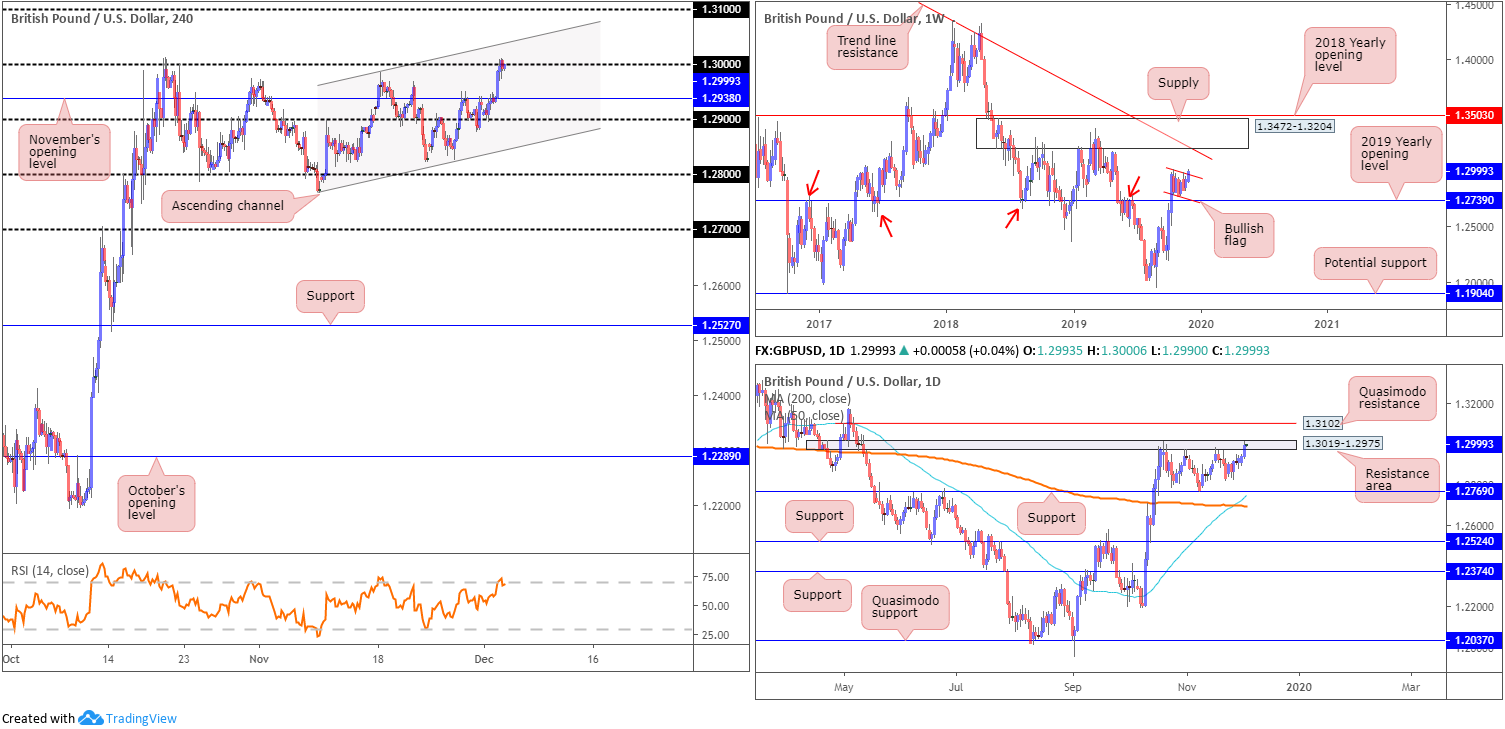
As evident from the H4 timeframe this morning, Tuesday wrapped up the session testing highs of 1.3011, likely tripping a portion of buy stops above the key figure 1.30. These orders originate not only from traders attempting to fade 1.30, but also from those trying to trade the breakout. Many traders likely perceive the break of 1.30 as a bullish signal. Above 1.30, channel resistance lies in wait, taken from the high 1.2984, though the more appealing upside target rests at 1.31.
Higher-timeframe action is interesting. The technical landscape on the weekly timeframe continues to support further upside in GBP/USD, exhibiting a bullish flag (typically considered a continuation pattern) forming just north of the 2019 yearly opening level 1.2739. As you can see, weekly price is attempting to overthrow the top edge of the said flag. A decisive close higher here may lead to the unit crossing swords with supply at 1.3472-1.3204, and long-term trend line resistance, etched from the high 1.5930. Regarding the immediate trend, the market faces a downward trajectory from 1.4376, with a break of the 1.1904 low (labelled potential support) confirming the larger downtrend from 1.7191.
Since mid-October, candle action on the daily timeframe has been carving out a consolidation between a resistance area plotted at 1.3019-1.2975 and a well-placed support level at 1.2769. With daily price nibbling at the top edge of this range right now, further upside to Quasimodo resistance at 1.3102 may be seen.
Areas of consideration
Longer term, additional upside is likely in store. Bullish flags, particularly formed on higher timeframes, are known for accuracy. Clearance of the upper edge of the daily range at 1.3019 is also considered bullish, though Quasimodo resistance at 1.3102 may hamper upside.
Shorter term, entering long on the back of a decisive H4 close formed above 1.30 is certainly an idea worth exploring, with an initial upside objective set at 1.31. Conservative traders may opt to wait for a retest at 1.30 following the close higher; this helps avoid any whipsaws and, if the retest forms by way of a bullish candlestick pattern, provides entry/risk levels to work with.
AUD/USD:
(Italics represent previous writing).
Early trade Tuesday witnessed the commodity-backed Aussie explore higher ground vs. the buck, adding more than 28 points, or 0.42%. The main catalyst behind the move emerged from the decision statement echoing a more positive tone, mainly through the linking of rising house prices to a potential lift in spending and residential construction. As expected, policymakers also left the official cash rate unchanged at 0.75%.
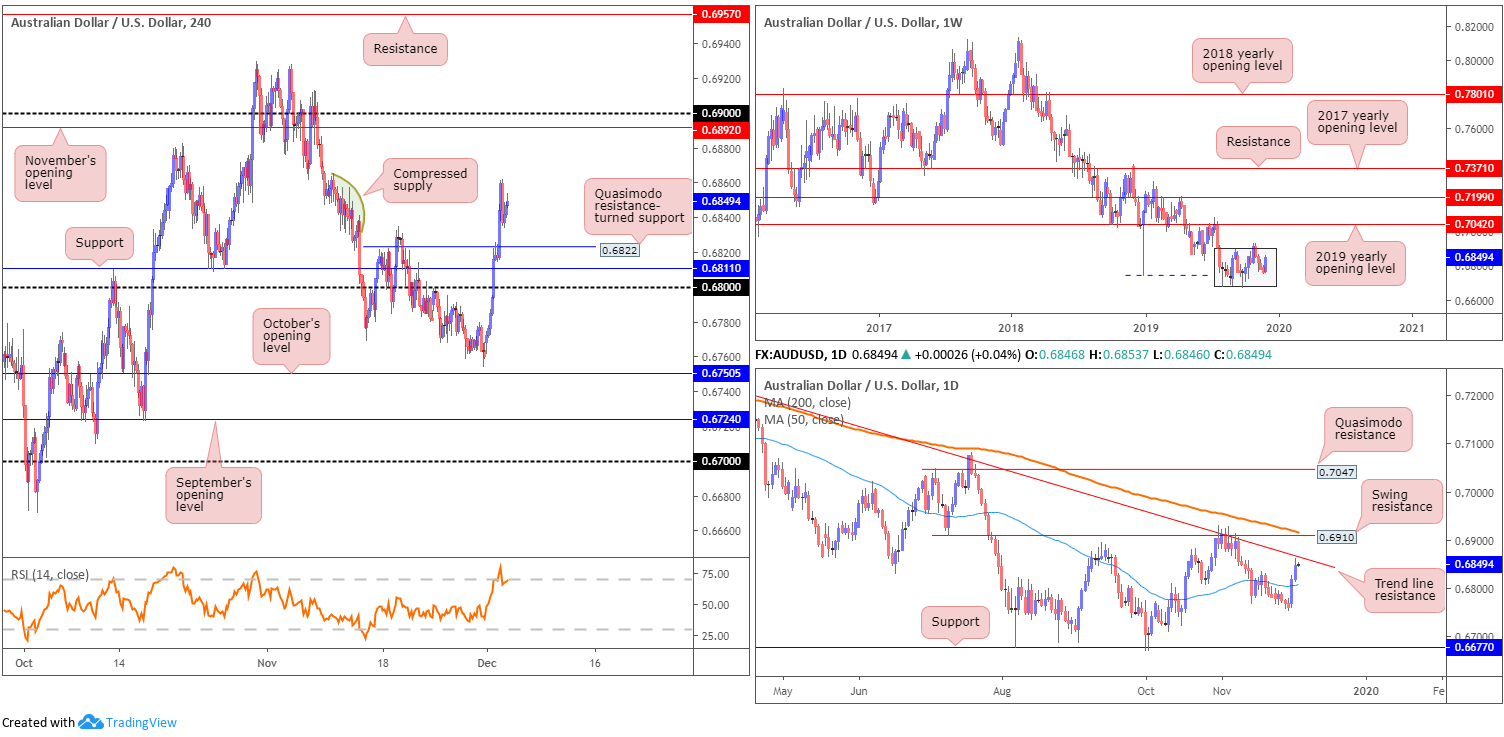
From a technical standpoint, H4 flow engulfed Quasimodo resistance at 0.6822 and scored a fresh weekly high of 0.6862. To the left of current price, action shows what appears to be compressed supply between 0.6840/60 (green arc), with November’s opening level representing the next logical resistance on the H4 scale at 0.6892. In terms of the relative strength index (RSI), the indicator is seen trading out of overbought territory.
With respect to the weekly timeframe, the unit remains within the walls of its current range between 0.6894/0.6677 (light grey). The primary downtrend, visible from this timeframe, has been in play since early 2018. Daily activity, on the other hand, recently crossed above the 50-day SMA (blue – 0.6809) and shook hands with levels just south of trend line resistance, extended from the high 0.7393.
Areas of consideration:
Although H4 price demonstrates scope to press as far north as 0.6892, trend line resistance on the daily timeframe may hamper upside here. A retest at 0.6822 on the H4 could still be something to consider, though traders are urged to wait for additional candlestick confirmation to form before pulling the trigger (entry/risk can be set based on this structure).
USD/JPY:
(Italics represent previous writing).
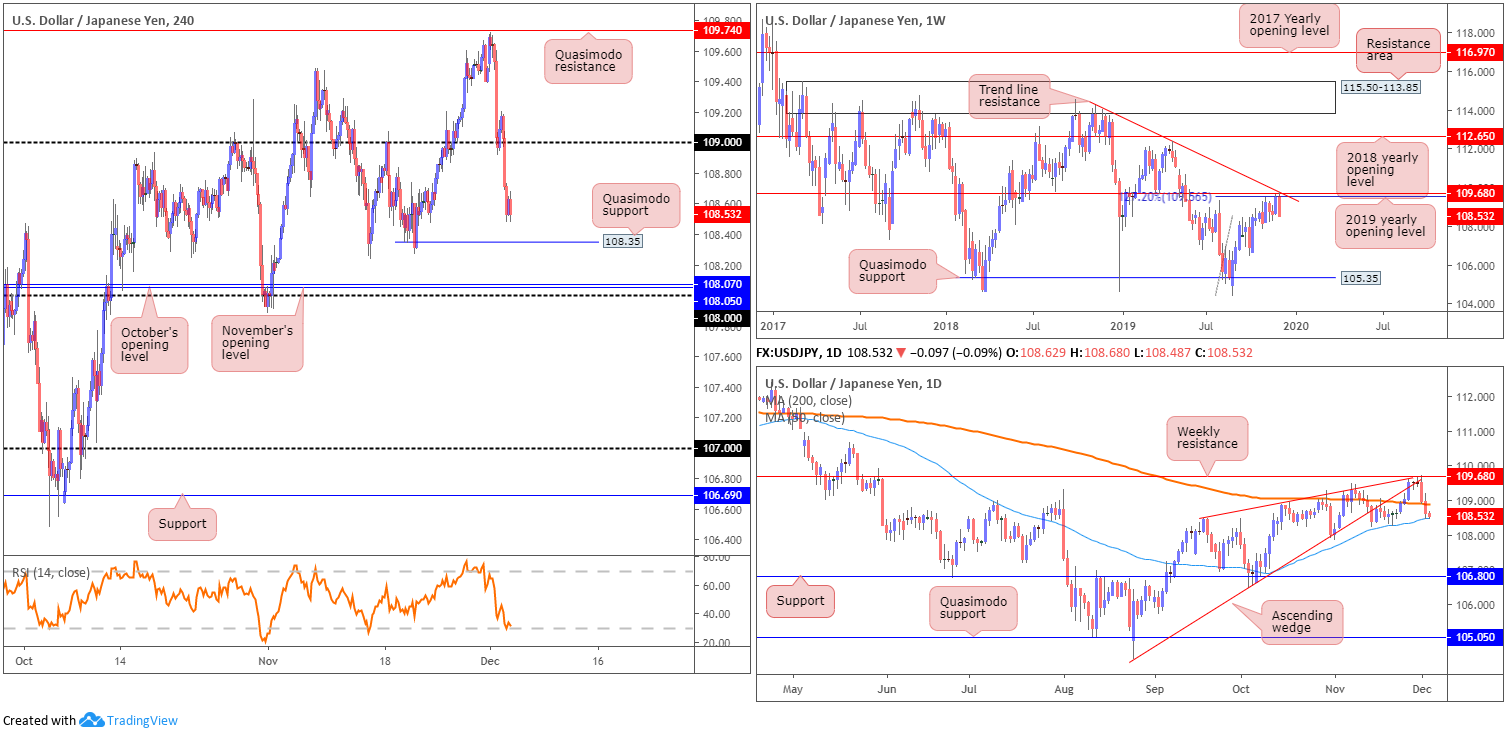
The US dollar ceded further ground to the Japanese yen Tuesday, as global trade concerns increased demand for safe-haven assets. Despite an earnest attempt to defend 109, early London observed the psychological base give way and draw H4 price towards Quasimodo support at 108.35. South of this level, technical studies suggest possible support emerging from the 108 handle, along with November and October’s opening levels at 108.05 and 108.07, respectively. The relative strength index (RSI) also recently crossed paths with oversold terrain.
Weekly resistance recently entered the fold, based on a 127.2% Fibonacci ext. point at 109.56 (taken from the low 104.44), resistance formed at 109.68, the 2019 yearly opening level, and trend line resistance, extended from the high 114.23.
In conjunction with weekly standing, price action on the daily timeframe tunnelled through the 200-day SMA (orange – 108.88). This follows the unit retesting the ‘cradle point’ of a recently broken ascending wedge, formed from the low 104.44. Support currently in play forms by way of the 50-day SMA (blue – 108.49).
Areas of consideration:
Well done to any readers who shorted the noted higher-timeframe resistances, as these were noted levels to keep an eye on in previous analysis.
A break of the 50-day SMA on the daily timeframe exposes support at 106.80, confirming additional downside on the weekly timeframe. H4 support rests at 108.35, with a break highlighting 108. Intraday bearish scenarios sub 108.35, therefore, are an option today.
USD/CAD:
(Italics represent previous writing).
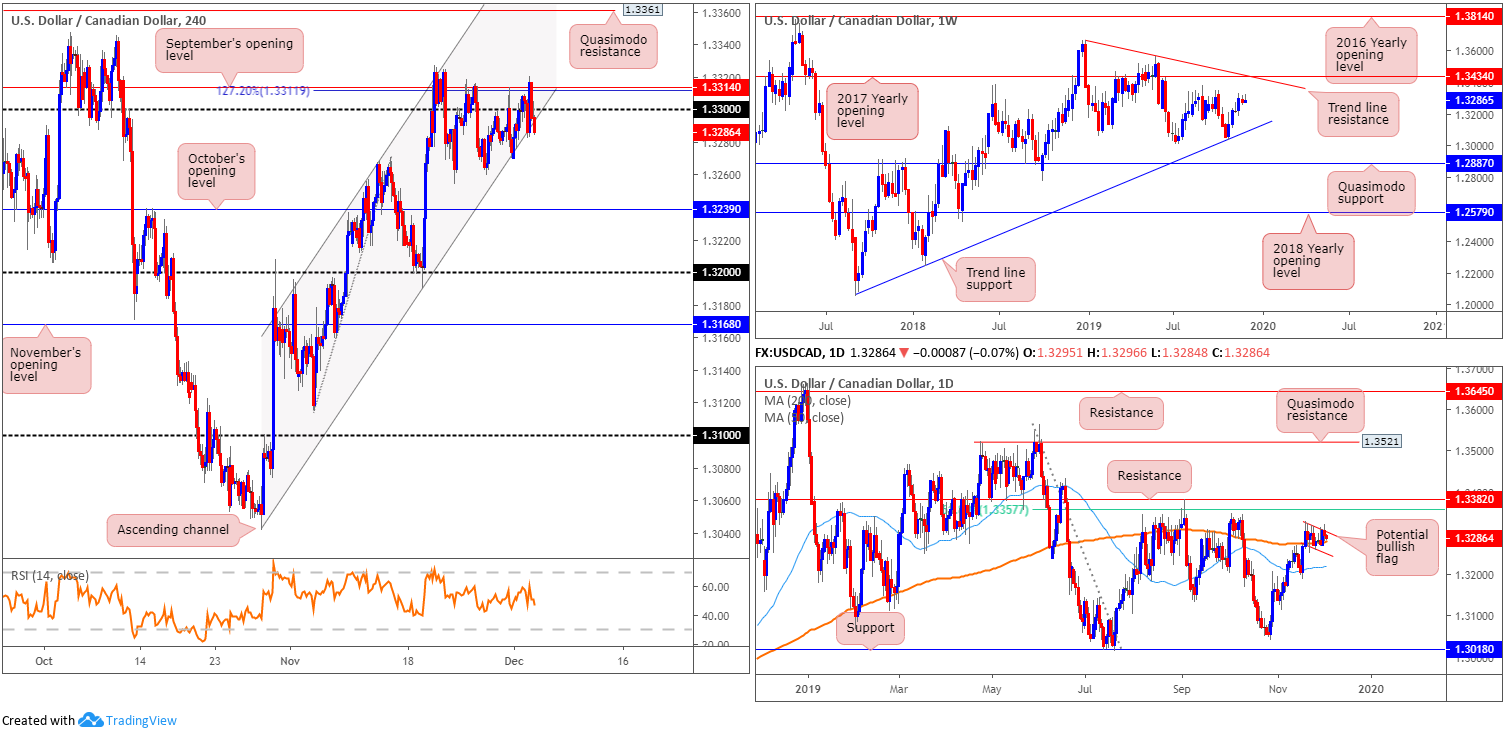
In recent sessions, we can see modest WTI gains underpinned the Canadian dollar. This – coupled with the US dollar index extending losses south of 98.00 – saw H4 resistance in the shape of September’s opening level at 1.3314 and a 127.2% Fibonacci ext. point at 1.3311 cap upside. Medium-term flow also remains compressing within the confines of an ascending channel, taken from the low/high of 1.3042/1.3268. As of current price, H4 appears to be nudging beneath the said channel support. A decisive close south of here highlights a potential approach towards October’s opening level at 1.3239.
The key observation on the weekly timeframe consists of a trend line support, extended from the low 1.2061, tops around 1.3342, the 2017 yearly opening level at 1.3434 and a trend line resistance, taken from the peak at 1.3661. Overall, the immediate trend faces north since bottoming in September 2017, though this move could also be considered a deep pullback in a larger downtrend from the 1.4689 peak in early January 2016.
Action on the daily timeframe remains encased within a bullish flag pattern (red lines), following price breaking above the 200-day SMA (orange – 1.3279). A breakout above the said bull flag has the 61.8% Fibonacci retracement ratio at 1.3357 to target, as well as nearby resistance plotted at 1.3382. Flag failure, on the other hand, could draw in a retest at the 50-day SMA (blue – 1.3219).
Areas of consideration:
A decisive H4 close below the current H4 channel support may be of interest for sellers today, though do remain aware the 200-day SMA on the daily timeframe could hinder downside. As such, conservative traders may opt to wait and see if daily price closes below the 200-day SMA before committing to a position here.
USD/CHF:
(Italics represent previous writing).
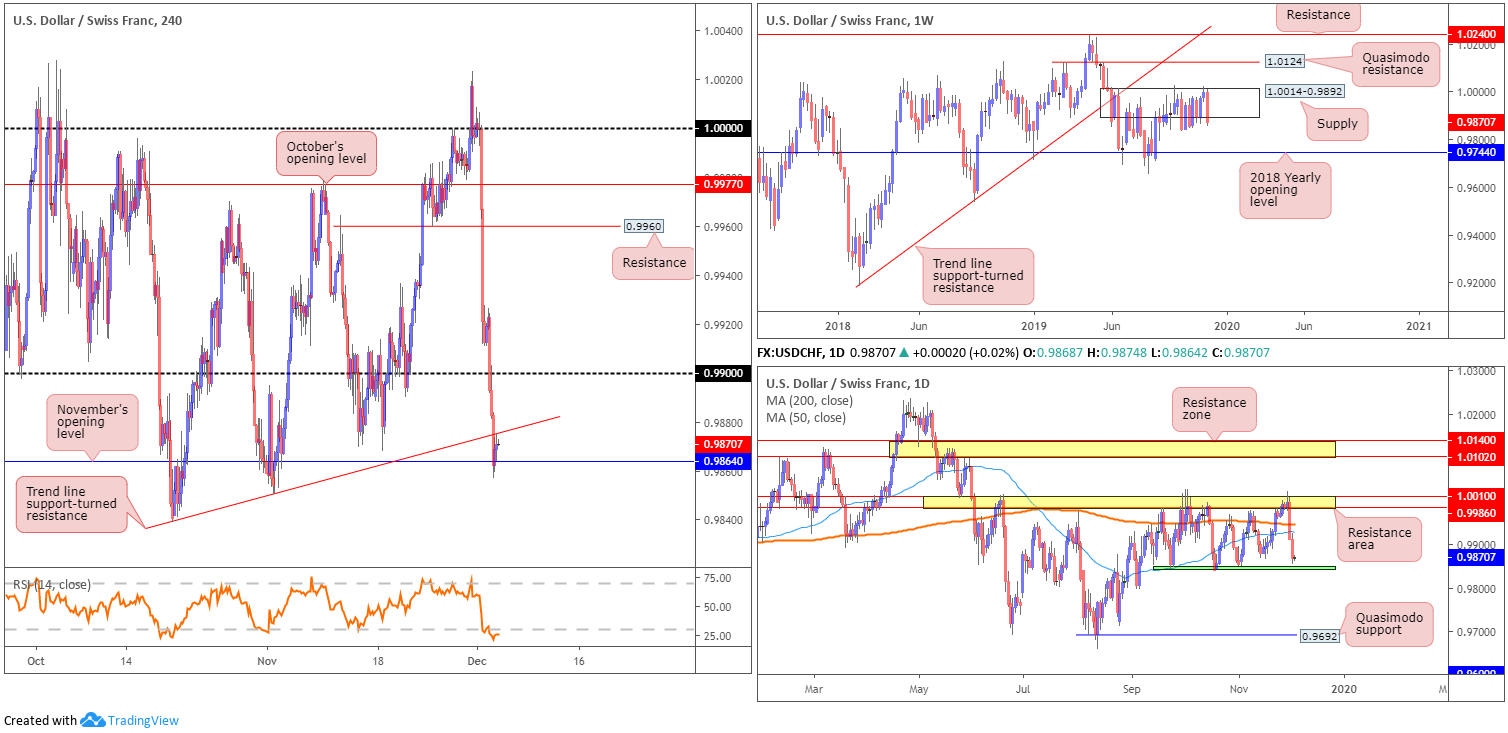
Subdued dollar demand, along with global trade concerns, ramped up demand for the safe-haven Swiss franc Tuesday, delivering a second consecutive daily loss to USD/CHF. Having repeatedly failed to find acceptance above the parity mark (1.0000), the pair recently dethroned the 0.99 handle and shook hands with November’s opening level at 0.9864 on the H4 timeframe. Note, upside from this point appears capped by trend line support-turned resistance, extended from the low 0.9839. It may also interest indicator-based traders the relative strength index (RSI) is seen treading water within oversold territory.
Technical research based on the weekly timeframe shows the pair remains consolidating within the walls of a supply zone at 1.0014-0.9892, despite whipsawing through the top edge of the said zone on two occasions. A move higher from here has Quasimodo resistance at 1.0124 in sight, followed by resistance at 1.0240 and trend line support-turned resistance, extended from the low 0.9187. To the downside, nevertheless, the 2018 yearly opening level awaits at 0.9744.
Meanwhile, on the daily timeframe, Tuesday concluded within touching distance of its session low at 0.9857. Since mid-September, the unit has been busy carving out a consolidation between support around the 0.9845ish region (green) and a resistance area at 1.0010/0.9986. Yesterday saw the unit settle at the lower end of the said range.
Areas of consideration:
Given we’re fast approaching the lower edge of the current daily range, and the RSI indicator, based on H4 movement, reveals oversold conditions, attempting to sell this market is tough. Intraday bearish scenarios may, however, be seen south of 0.9864 on the H4 timeframe, though 0.9845, the daily range support, will likely cap downside.
A break above the current H4 trend line resistance could encourage a recovery phase, drawing price action back to 0.99.
Dow Jones Industrial Average:
US equities extended losses Tuesday, following US President Donald Trump stating it may take until after the 2020 elections to complete a trade deal with China. Additionally, trade tensions escalated on other fronts, including Brazil, Argentina and France. The Dow Jones Industrial Average erased 280.23 points, or 1.01%; the S&P 500 lost 20.67 points, or 0.66% and the tech-heavy Nasdaq 100 declined 54.52 points, or 0.66%.
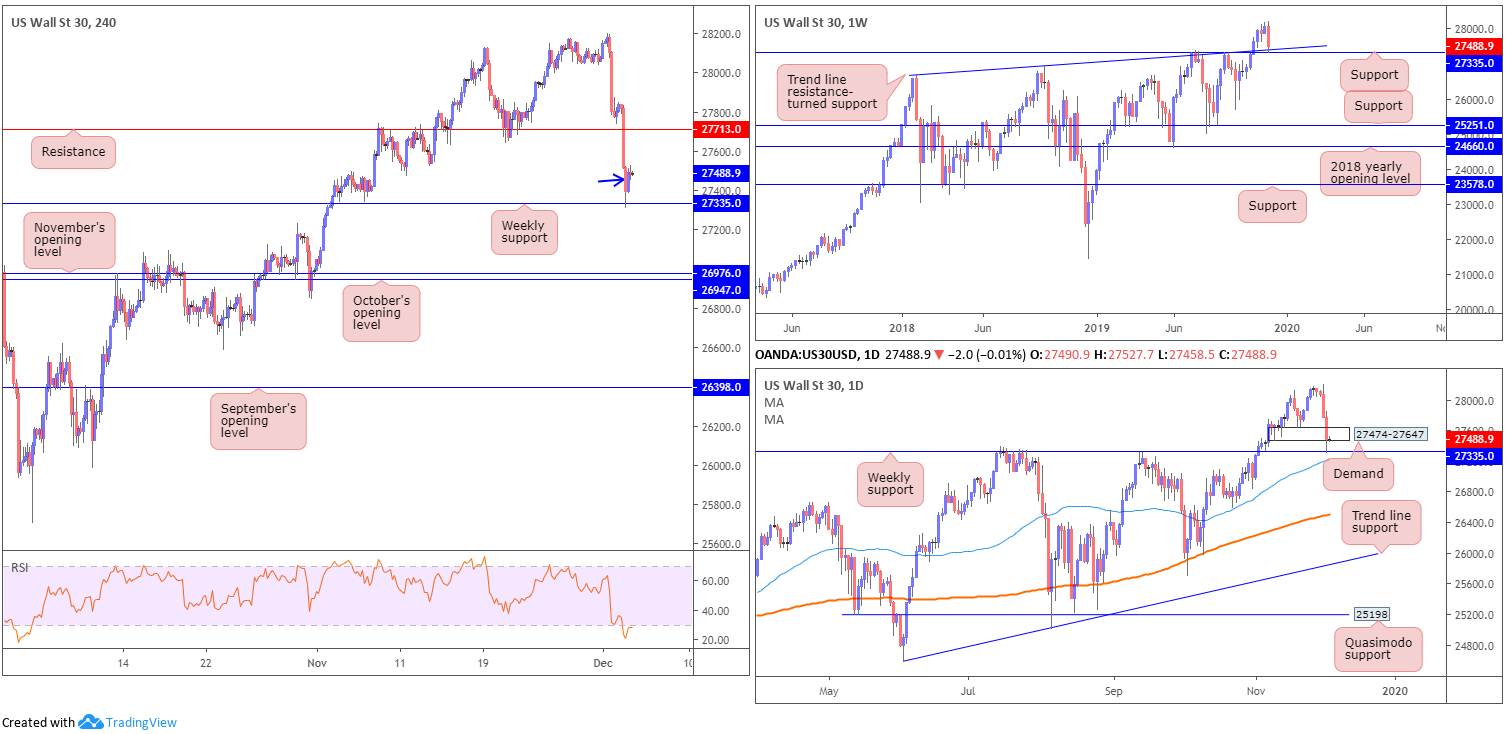
Recent declines, technically speaking, position the candles at an interesting juncture. Weekly price retested support drawn from 27335, which happens to align closely with trend line resistance-turned support, extended from the high 26670. Lower on the curve, daily demand at 27474-27647 suffered a raw whipsaw, likely tripping sell stops. Note, daily price shows the 50-day SMA (blue – 27224) is also crawling higher, now positioned just south of the said weekly support level.
A similar picture is visible on the H4 timeframe this morning, with weekly support serving as its prime support. The next upside target on this scale, nonetheless, falls in around resistance at 27713. Also, the relative strength index (RSI) trades within oversold territory.
Areas of consideration:
The fact price is testing notable weekly support, and action whipsawed through a daily demand in order to likely collect stops, shows this remains a buyers’ market, despite the recent swing lower. Entry at current price is certainly an option, with protective stop-loss orders planted just beneath the current weekly support, targeting 27713 as the initial take-profit zone. Added conviction can be found in the form of a recent H4 inside candlestick formation (blue arrow).
XAU/USD (GOLD):
(Italics represent previous writing).
Global trade concerns ramped up demand for the yellow metal Tuesday, delivering a $15 gain, or 1.03%.
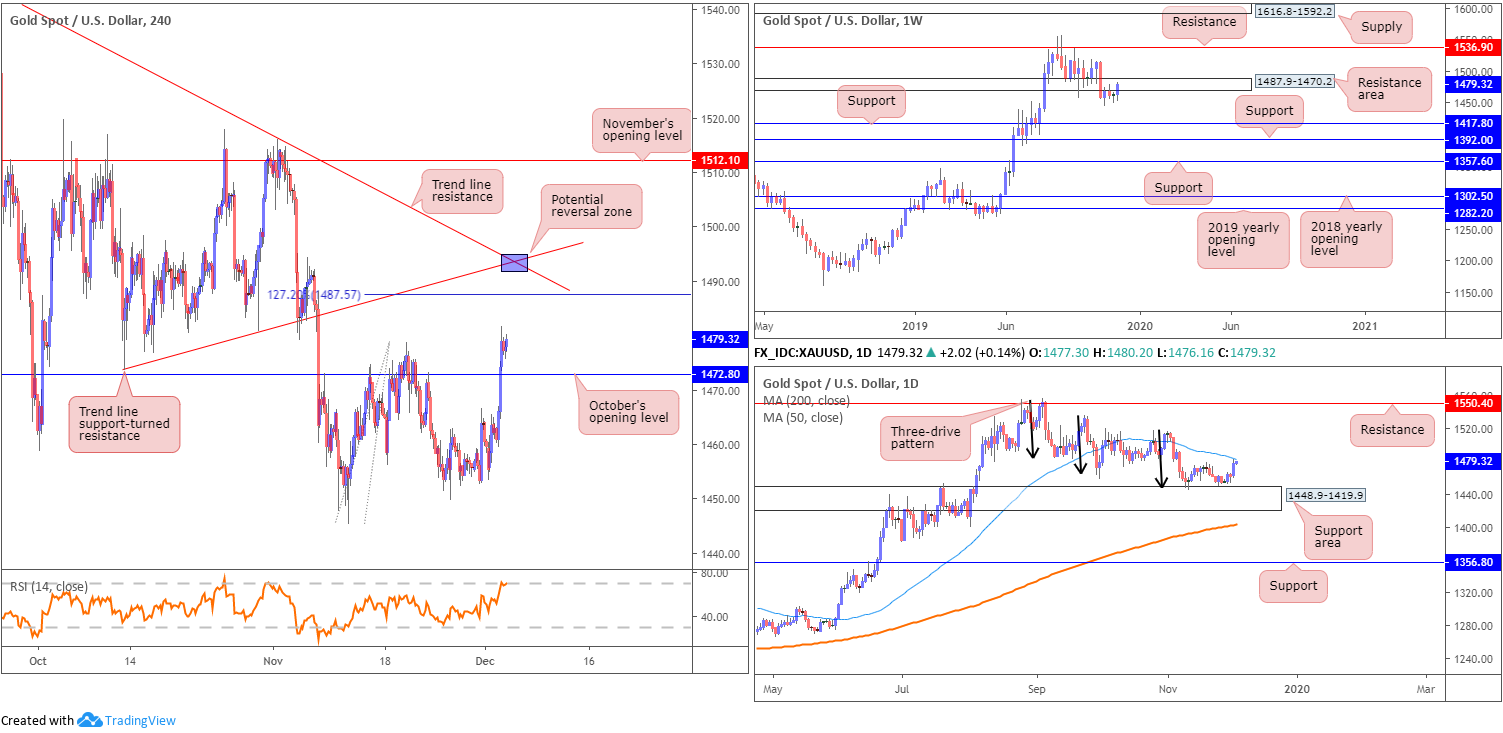
Based on H4 technicals, we can see October’s opening level at 1472.8 gave way in strong fashion, allowing bullion free reign to clock a fresh weekly high at 1481.7. To the upside from here, the 127.2% Fibonacci ext. point at 1487.5 offers potential resistance, closely shadowed by two converging trend line resistances (1473.8/1557.1).
On a wider perspective, daily price remains bolstered by the support area at 1448.9-1419.9, though currently faces possible resistance, in the shape of a 50-day SMA (blue – 1482.8). The story on the weekly timeframe reveals price action driving higher into a resistance area at 1487.9-1470.2. Note the top edge of this zone coincides closely with the two H4 trend line resistances.
Areas of consideration:
Although we’re coming off a daily support area, the two trend line resistances based on the H4 timeframe offer a reasonably strong platform for shorts today, particularly at the point the two lines merge (purple zone). To help avoid whipsaws, conservative traders will likely opt to wait and see how H4 action behaves before committing to a position (entry and risk can then be set based on the bearish candlestick pattern), targeting the first demand formed on approach as an initial take-profit zone.
The accuracy, completeness and timeliness of the information contained on this site cannot be guaranteed. IC Markets does not warranty, guarantee or make any representations, or assume any liability regarding financial results based on the use of the information in the site.
News, views, opinions, recommendations and other information obtained from sources outside of www.icmarkets.com.au, used in this site are believed to be reliable, but we cannot guarantee their accuracy or completeness. All such information is subject to change at any time without notice. IC Markets assumes no responsibility for the content of any linked site.
The fact that such links may exist does not indicate approval or endorsement of any material contained on any linked site. IC Markets is not liable for any harm caused by the transmission, through accessing the services or information on this site, of a computer virus, or other computer code or programming device that might be used to access, delete, damage, disable, disrupt or otherwise impede in any manner, the operation of the site or of any user’s software, hardware, data or property.


