
Key risk events today:
Australian Building Approvals and Trade Balance; UK Services PMI; MPC Member Broadbent Speaks; US ADP Non-Farm Employment Change; Canadian Trade Balance; US ISM Non-Manufacturing PMI.
EUR/USD:
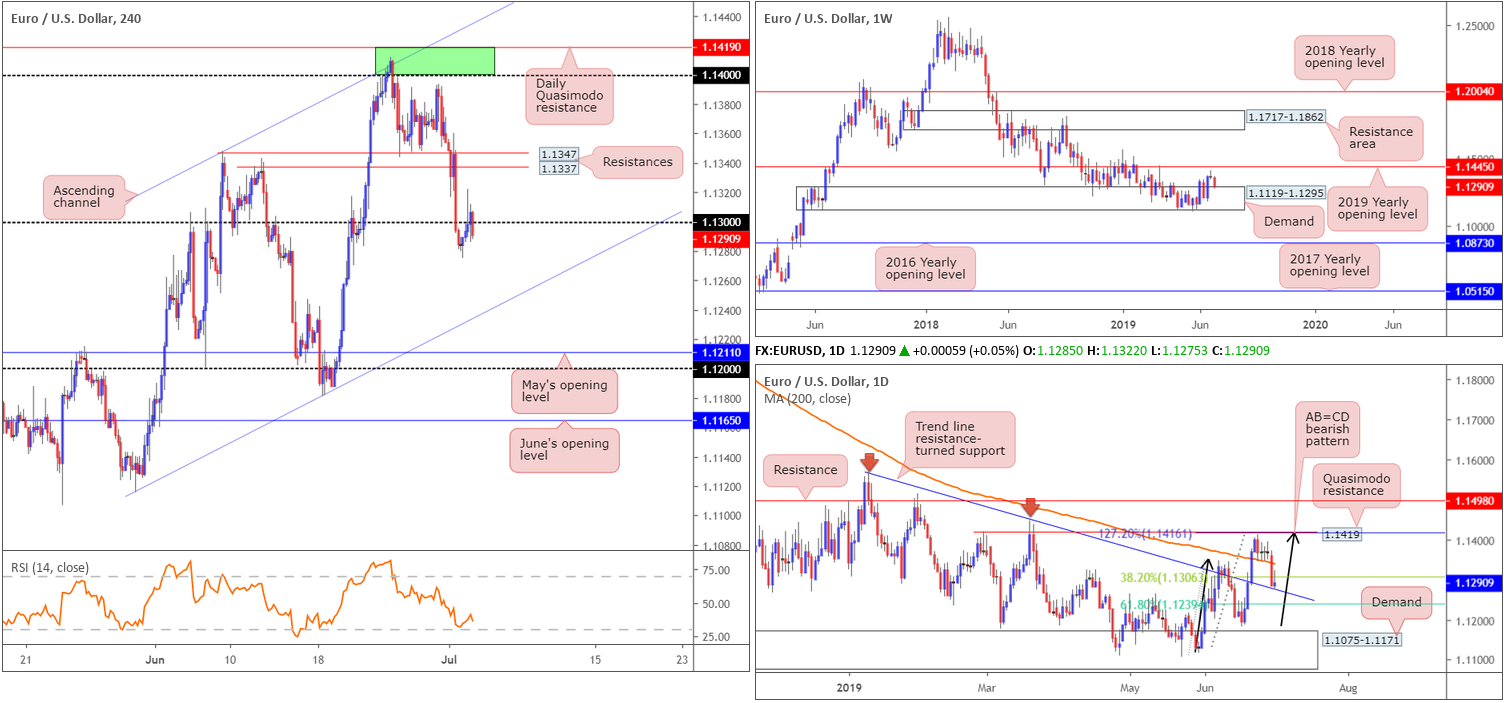
In recent sessions, the EUR/USD spiked above 1.13 on the H4 following headlines via Bloomberg the European Central Bank (ECB) policymakers see no need to rush into a July rate cut. Despite a run to 1.1321, likely tripping the majority of buy stops above 1.13, the pair reclaimed 1.13 to the downside in recent hours. As underlined in Tuesday’s briefing, the next downside objective beyond 1.13 falls in at a channel support taken from the low 1.1116. To the upside, nevertheless, we have two layers of resistance lurking nearby at 1.1347 and 1.1337. Indicator-based traders may also wish to note the RSI is seen lurking just north of its oversold value.
On more of a broader perspective, the weekly timeframe shows price action testing the top edge of a demand area coming in at 1.1119-1.1295, after failing to connect with upside resistance at the 2019 yearly opening level drawn from 1.1445 last week. This shows signs of seller strength here.
On the daily timeframe, the pair recently touched gloves with a trend line resistance-turned support extended from the high 1.1569. This comes after price action recently topped just ahead of a Quasimodo resistance at 1.1419 as well as its merging 127.2% AB=CD – black arrows – bearish pattern at 1.1416, and engulfed the 200-day SMA. Harmonic traders may also want to acknowledge the 38.2% Fibonacci support value at 1.1306 (extended from legs A-D) was tested at the beginning of the week – considered the first take-profit target from the AB=CD formation. The next downside take-profit target can be seen at the 61.8% Fibonacci value around 1.1239.
Areas of consideration:
Although weekly demand mentioned above at 1.1119-1.1295 exhibits signs of weakness, the area has yet to be engulfed. Therefore, it is not a base one should overlook in terms of buying power just yet. Bolstering the said demand is the daily timeframe. Not only are we testing a trend line resistance-turned support, we’re also in correction territory for AB=CD traders between 1.1239/1.1306.
The key here, according to our technical studies, may be the 1.13 handle on the H4 timeframe. At the moment, price action is emphasising an indecisive tone, unable to pin down short-term direction. Once more of a decisive move takes shape from 1.13, we’ll likely know where to position an entry. For example, a pivotal move below 1.13 opens up the door to short-term selling opportunities towards the H4 channel support mentioned above. However, in this case, traders need to exercise a little more caution given the noted higher-timeframe supports in play. With that being the case, a move above 1.13 is the favoured route.
GBP/USD:
Sterling continued its slide lower Tuesday, down 0.36% against the buck, following dismal UK construction PMI and a warning from Bank of England Governor Mark Carney on Q2 data.
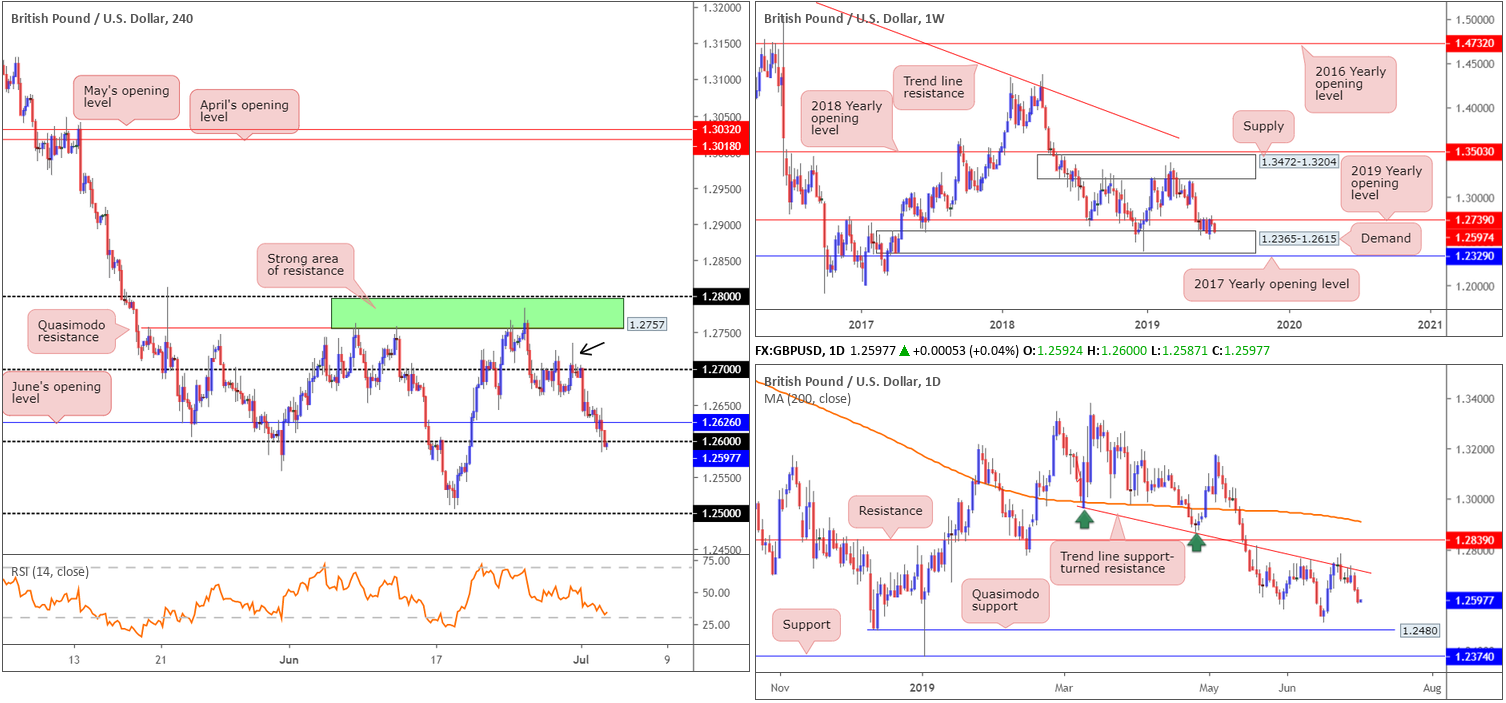
For traders who read recent reports may recall the research team highlighted a potential sell on the back of Friday’s H4 shooting star pattern (black arrow) around 1.27.
Not only did traders have candlestick confirmation at a round number on the H4 timeframe, higher-timeframe structure also pointed to further selling. Here’s what Monday’s report had to say on the bigger picture:
From the weekly timeframe:
In similar fashion to our previous weekly report, buyers and sellers remain warring for position between long-standing demand at 1.2365-1.2615 and the 2019 yearly opening level at 1.2739, since May 20.
Areas outside of this border to be conscious of fall in around the 2017 yearly opening level at 1.2329 (support) and supply coming in at 1.3472-1.3204. Traders may also wish to acknowledge the unit is currently seen defending the underside of the 2019 yearly opening level, so selling may ensue this week.
On account of the above, and in light of recent selling, the weekly timeframe now trades at the top edge of the aforementioned weekly demand area, thus buying may ensue.
From the daily timeframe, nevertheless, Monday’s weekly report still holds:
In tandem with the 2019 yearly opening level at 1.2739 on the weekly timeframe, daily movement concluded the week chalking up back-to-back bearish selling candles off the underside of a trend line support-turned resistance taken from the low 1.2960. Beyond here, traders’ crosshairs are likely fixed on resistance drawn from 1.2839, whereas a move lower has Quasimodo support at 1.2480 to target.
Areas of consideration:
Well done to any of our readers who managed to not only catch Monday’s sell, but also hang on to it. June’s opening level at 1.2626, closely followed by the top edge of weekly demand at 1.2615 and then the 1.26 round number were collectively set as the next downside targets. As you can see, all three were achieved Tuesday. Whether the market will observe further weakness, though, is difficult to judge. The top edge of weekly demand in motion at 1.2615 could hold and entice a recovery. For that reason, reducing risk to breakeven and taking partial profits off the table for folks short this market is certainly an option – hold a portion of the position open in case we make a run for lower ground on the daily timeframe.
AUD/USD:
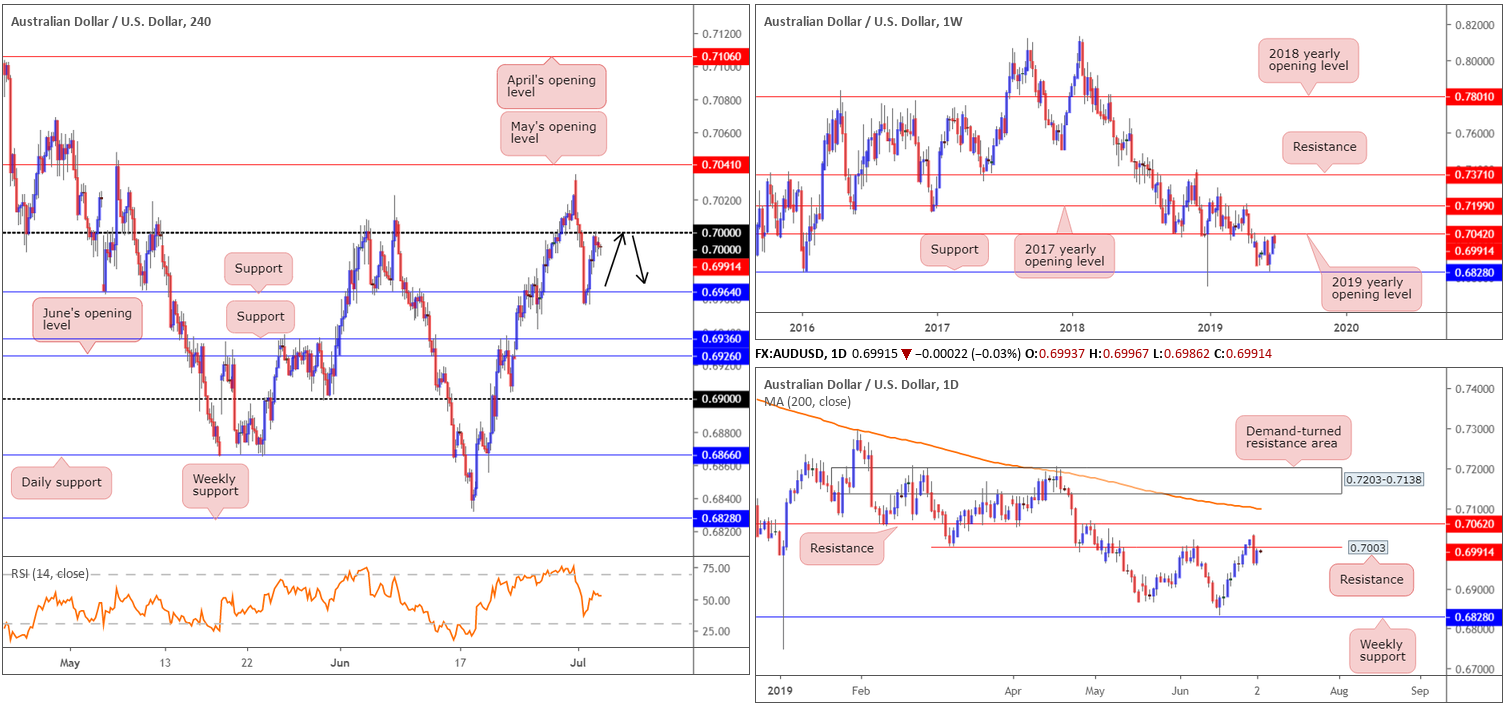
Tuesday saw the Reserve Bank of Australia cut its cash rate by 25bps to a fresh record low of 1.00% after rates were left unchanged for three years. Despite this, the move was already priced in and allowed a ‘buy the rumour sell the fact’ motion. Technically speaking, this lifted the pair to the key figure 0.70, reclaiming 50% of Monday’s losses, though found the air relatively thin above.
In Tuesday’s briefing, the research team underscored the following resistances to be aware of:
- The 0.70 handle on the H4 timeframe.
- Daily resistance at 0.7003.
- Weekly resistance by way of the 2019 yearly opening level at 0.7042.
Tuesday’s piece also went on to highlight the ideal scenario would be for a retest of 0.70 as resistance. This, followed by a H4 bearish candlestick (entry and risk can be determined according to the candlestick structure), is particularly interesting for shorts, seeing as both weekly and daily timeframes exhibit space to manoeuvre lower. The next support target to be aware of on the higher timeframes comes in at weekly support drawn from 0.6828.
Areas of consideration:
Although 0.70 entered the mix yesterday, H4 price action has yet to print anything meaningful in terms of bearish candlestick confirmation – think shooting star pattern of bearish engulfing formation. Therefore, there’s still a chance we may run through stop-loss orders above 0.70 and bring in sellers on the weekly timeframe at 0.7042. The next downside target from 0.70 remains at H4 support fixed from 0.6964.
USD/JPY:
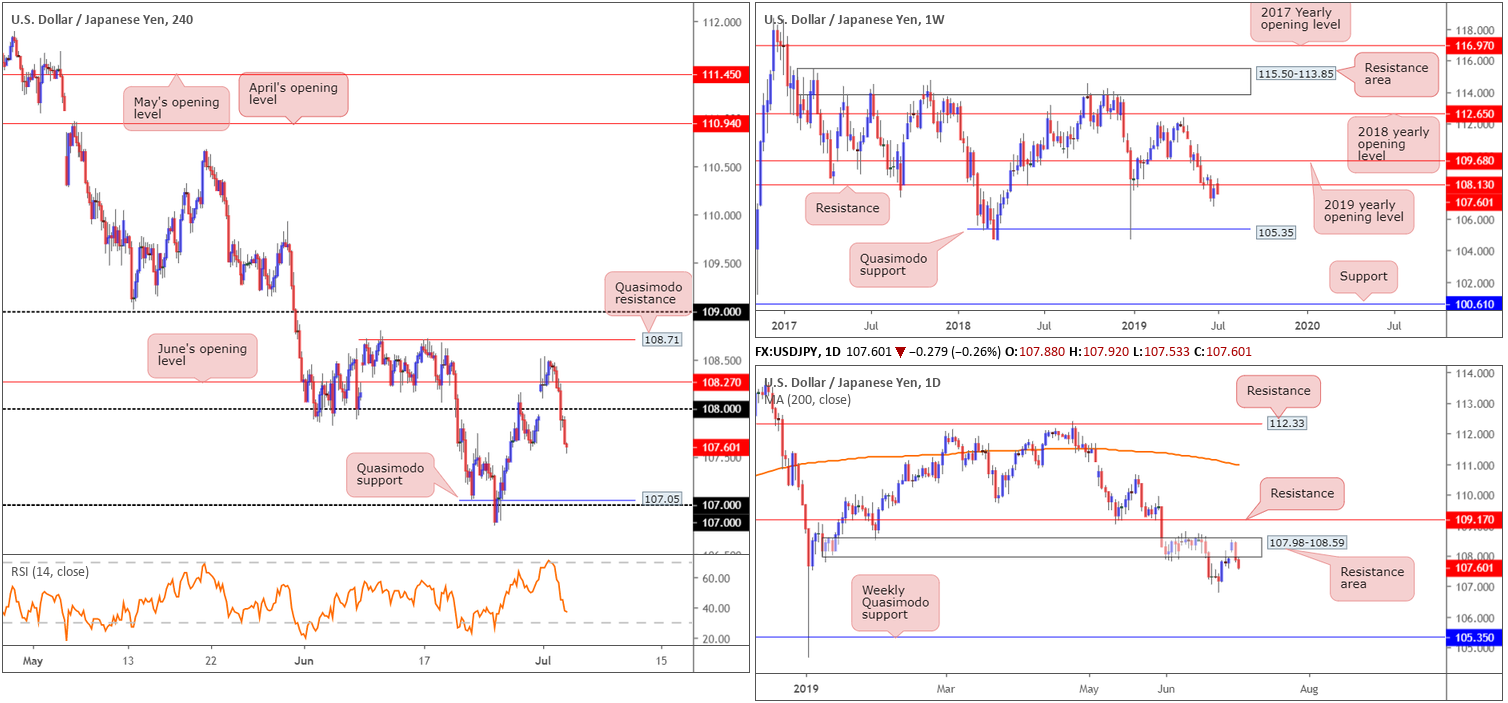
Despite kicking off the week on firm footing and finding a ‘ledge’ of support off June’s opening level at 108.27, the H4 candles struggled to sustain gains Tuesday and slipped lower. US Treasury yields also lost ground, with the 10-year note crossing below the 2% mark, and the US dollar index mildly paring some of Monday’s gains ahead of the 97.00 handle. Collectively, this weighed on the USD/JPY, filling the weekend gap and pulling the unit sub 108 to a session low of 107.76. Further selling from this point has Quasimodo support at 107.05/the 107 handle in sight as the next downside target.
Higher-timeframe analysis demonstrates weekly resistance at 108.13 remains in play. Having seen this level hold well as support in the past, this may encourage selling. Reinforcing the said weekly level is also a daily resistance area at 107.98-108.59. At one point, it appeared as though this area was likely to give way, though at the top edge of the boundary a wave of selling emerged. Aside from the 106.78 June 25 low, limited support is visible on both the weekly and daily timeframes until reaching the weekly Quasimodo support at 105.35.
Areas of consideration:
In view of the above reading, additional selling could be in store today. An ideal scenario for a possible short play, according to our technical reading, would be a retest of 108 as resistance. A retest of 108 in the shape of a H4 bearish candlestick signal – this is recommended as it helps identify seller intent and also provides traders entry and risk levels to work with – would, given the overall technical picture showing room for a move lower, be considered a high-probability shorting opportunity, targeting 107.05 as the initial take-profit zone.
USD/CAD:
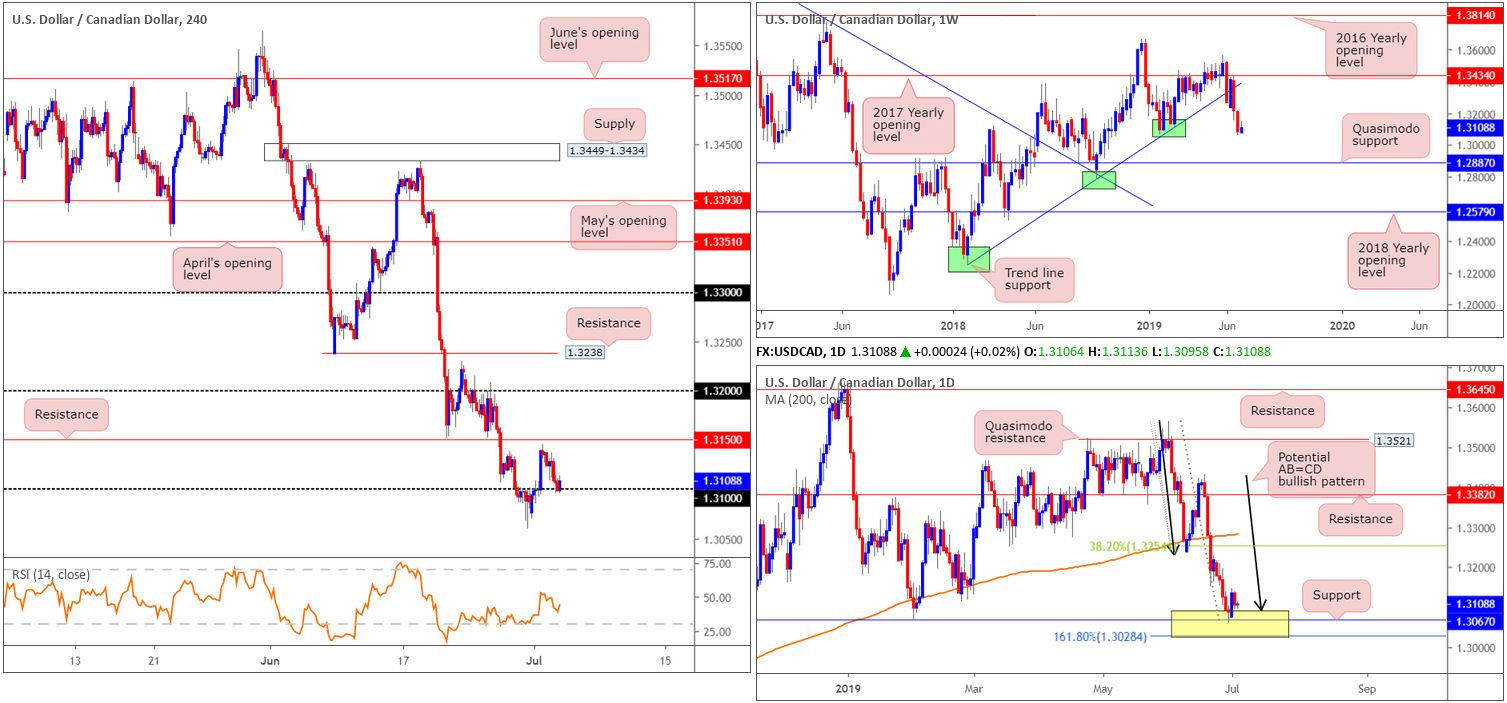
USD/CAD price action corrected a reasonably large portion of Monday’s gains Tuesday, despite WTI plummeting more than 4.50%, and shook hands with the 1.31 handle as support on the H4 timeframe. As of current price, the retest at 1.31 is holding, and could, therefore, entice further buying today towards resistance at 1.3150.
Further upside from 1.31 is also bolstered by the fact we’re emerging from a high-probability buy zone on the daily timeframe between 1.3028/1.3089 (yellow) – comprised of an AB=CD (black arrows) formation at 1.3089, a support at 1.3067 and a 161.8% Fibonacci extension at 1.3028 (forms part of the AB=CD structure).
The only grumble to a move higher is weekly structure displaying limited support until reaching a Quasimodo formation at 1.2887.
Areas of consideration:
Keeping it simple this morning, should the current H4 candle close as is: a near-full-bodied bullish candle off 1.31, this is an ideal signal to consider buying into, targeting H4 resistance at 1.3150 as the initial port of call. Entry and risk levels can be determined according to the rejection candle’s structure off 1.31.
USD/CHF:
Demand for safe-haven assets increased Tuesday, as investors remained on edge over Federal Reserve rate policy and the Trump trade wars.
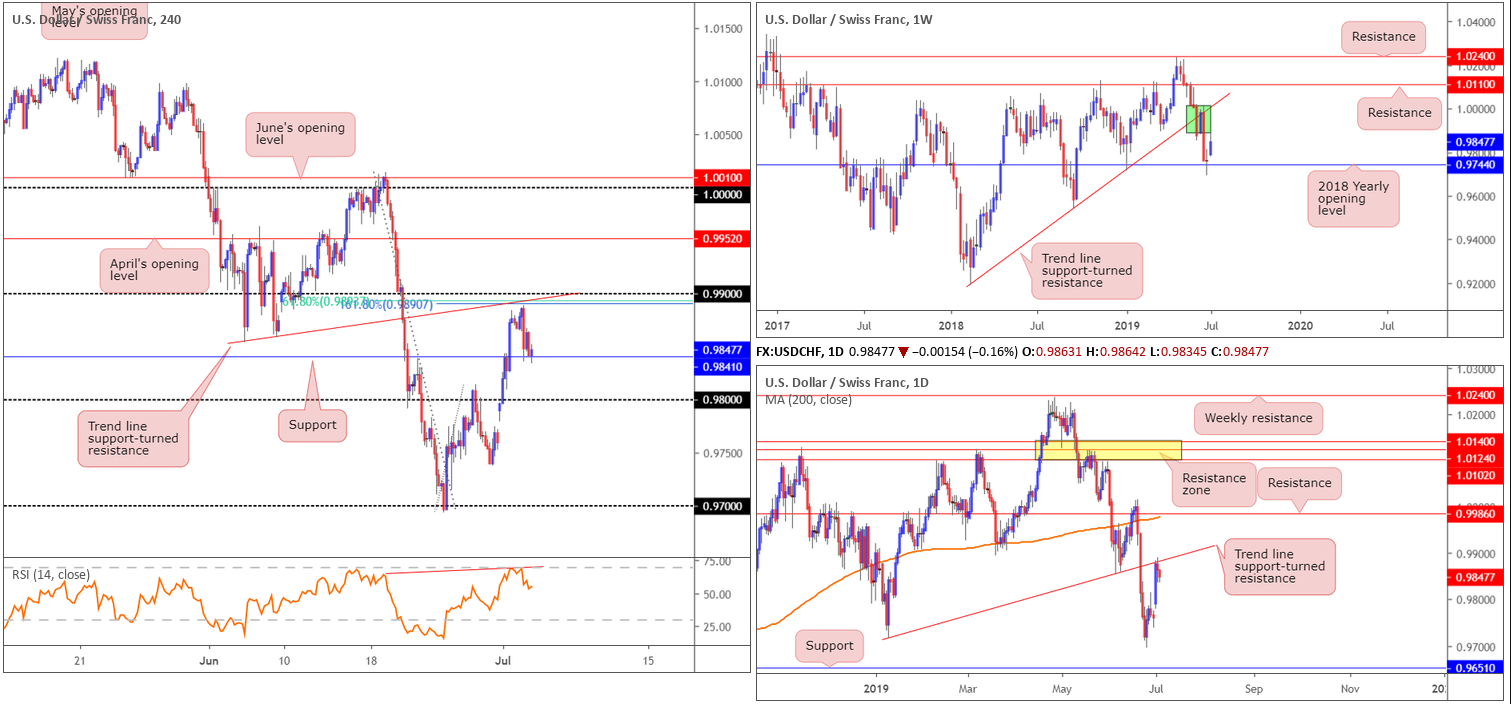
From the weekly timeframe, we can see price action came within a couple of points of connecting with a thick body of supply at 1.0014-0.9892 (green) after respecting the 2018 yearly opening level (support) at 0.9744 last week. This – coupled with daily price also crossing swords with a trend line support-turned resistance taken from the low 0.9716 – collectively weighed on the unit.
What was unfortunate was H4 price failed to connect with its 0.99 handle for a possible sell yesterday. Note this figure boasts strong local confluence from a trend line support-turned resistance taken from the low 0.9853, a 161.8% Fibonacci extension point at 0.9890 and a 61.8% Fibonacci retracement at 0.9894. In addition to this, indicator-based traders may have noted the RSI pencilled in a hidden divergence reading near overbought territory (red line).
Going forward, the research team notes the H4 candles concluded Tuesday testing support at 0.9841. Beyond this barrier, we have the 0.98 handle, which, as you can see, is a respected support and resistance level by and of itself.
Areas of consideration:
Technically, two potential scenarios are present, according to our technical studies:
- Further selling occurs and breaks through the current H4 support at 0.9841. This is possible, owing to where we’re coming from on the bigger picture (see above). A H4 close beyond 0.9841, therefore, opens the door to short-term selling opportunities towards 0.99 and quite possibly beyond.
- In the event the current H4 support holds and we move higher, a test of 0.99, by way of a H4 bearish candlestick configuration, is high probability, given the surrounding confluence both locally and on the bigger picture, targeting H4 support at 0.9841 as the initial take-profit zone.
Dow Jones Industrial Average:
Traders’ optimism had been lifted after Donald Trump and Xi Jinping struck a truce in the US-China trade war over the weekend, but the prospect of another trade war between the US and Europe “dented the market sentiment,” said Konstantinos Anthis, head of research at ADSS. Traders were jittery Tuesday after the Trump administration threatened to slap tariffs on $4 billion of meat, cheese, and other EU goods in retaliation for the union’s subsidies to aircraft-manufacturer Airbus (Markets.businessinsider.com). The Dow Jones industrial average rose 0.26%; the S&P 500 advanced 0.29% and the tech-heavy Nasdaq 100 also added 0.41%.
As far as price movement goes, the unit went relatively unchanged.
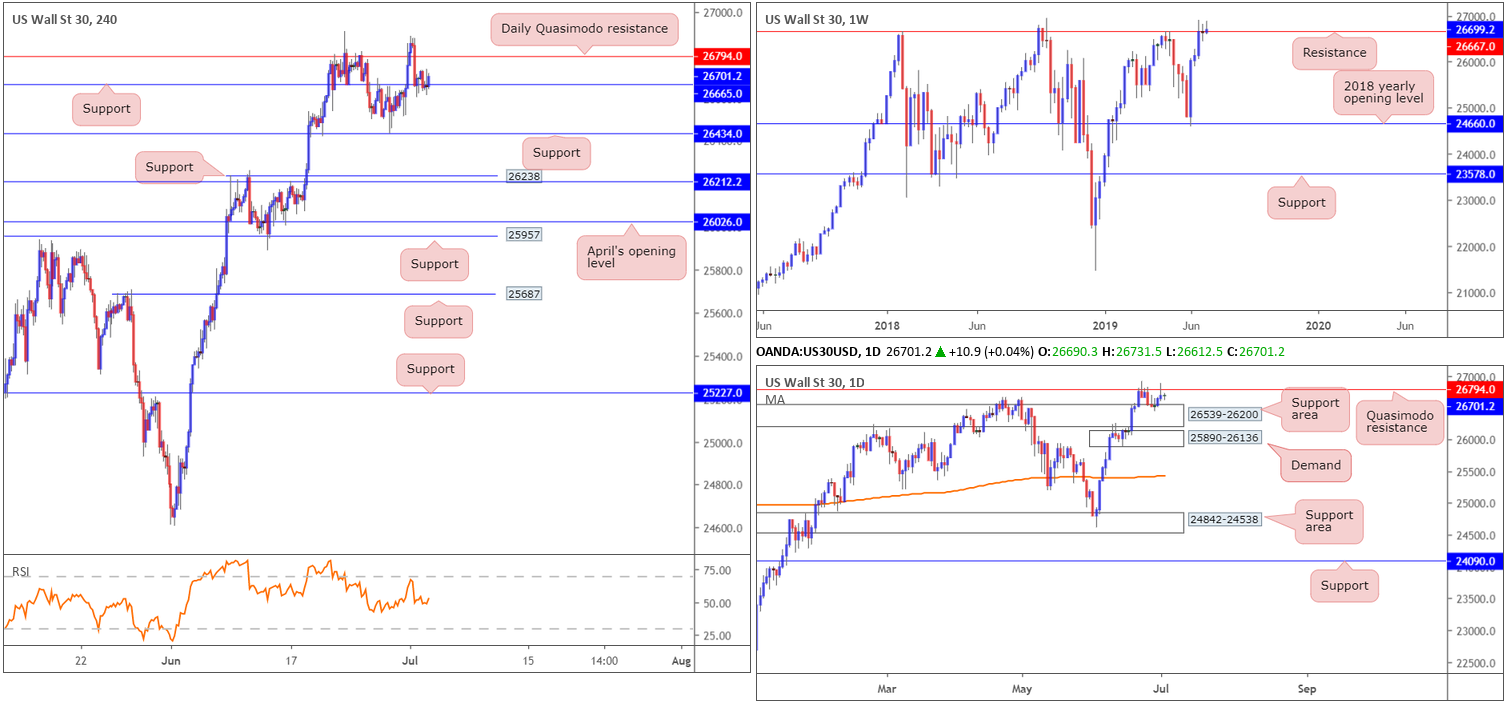
Weekly resistance at 26667 is under pressure and demonstrates little sign of holding at this time. For that reason, it is certainly worth pencilling in the next upside target on this scale: the all-time high at 26939. Quasimodo resistance on the daily timeframe at 26794 re-entered the fight Monday, and held ground by way of a shooting star bearish candlestick pattern, though has yet to generate much downside flow. The next downside target on this scale resides close by at the support area drawn from 26539-26200.
H4 support at 26665 remains in position, bolstering yesterday’s action. Upside is limited by the aforementioned daily Quasimodo resistance from here, whereas downside displays some open space to approach H4 support at 26434, closely followed by another layer of support at 26238.
Areas of consideration:
With buyers and sellers undecided on the weekly timeframe, and price action sandwiched between Quasimodo resistance at 26794 and a support area at 26539-26200 on the daily timeframe, as well as H4 buying off support at 26665 potentially hampered by the aforesaid Quasimodo resistance, trading this market remains a challenge.
With that being the case, the research team’s outlook remains flat for the time being.
XAU/USD (GOLD):
Safe-haven assets from US Treasuries to gold resumed rallies Tuesday as investors remained on edge over Federal Reserve rate policy and the Trump trade wars.
For traders who read Tuesday morning’s brief you may recall the following:
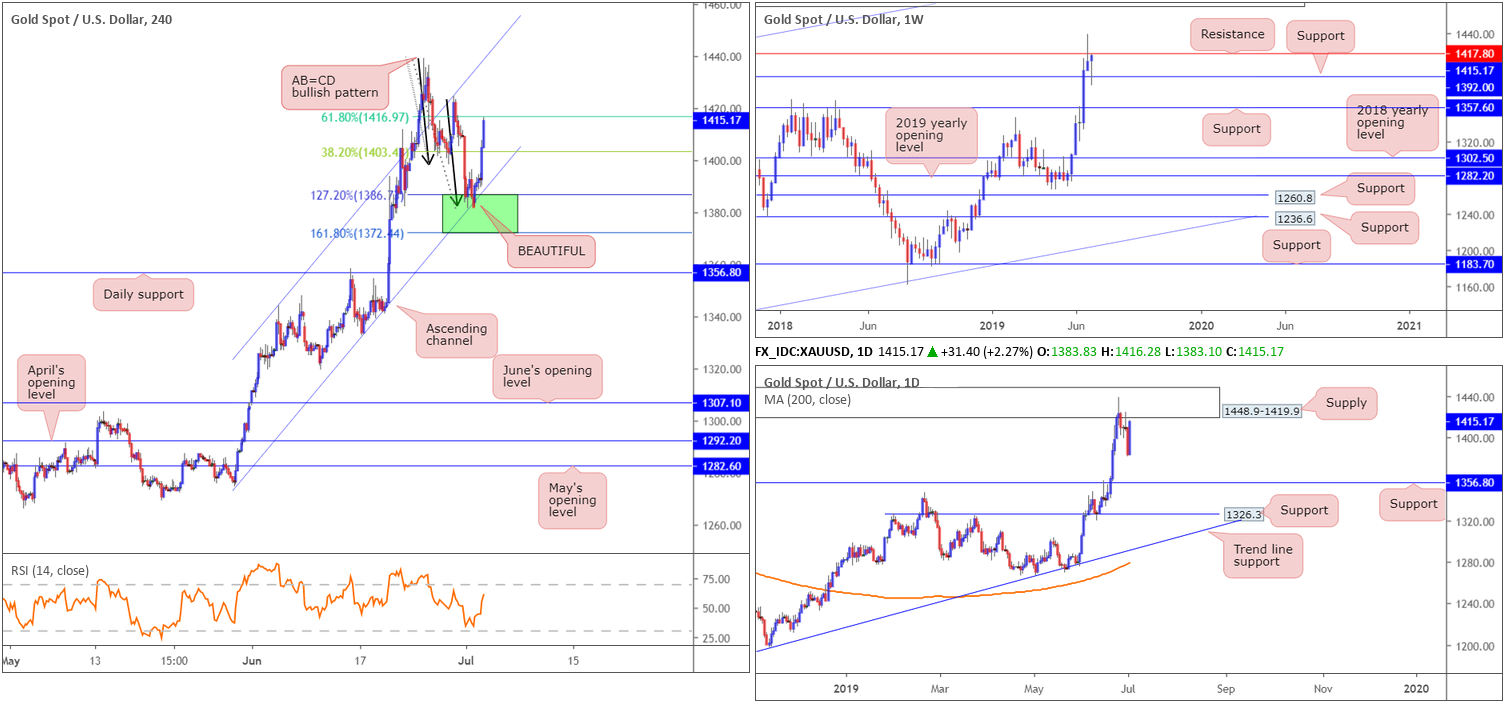
Traders may also wish to acknowledge the possibility of an AB=CD bullish pattern forming (black arrows), which has a termination zone positioned between the 127.2% and 161.8% Fibonacci extension points between 1372.4/1386.7 (green area).
As is evident from the H4 timeframe this morning, price action is testing 1372.4/1386.7. Knowing this area is closely positioned to weekly support at 1392.0, there’s a chance we could observe a reaction take shape from here. This is despite daily price selling from supply at 1448.9-1419.9, and showing space to press as far south as support at 1356.8.
Tuesday’s report also covered the following:
The H4 green zone is considered a high-probability buy. Ultimately, stop-loss orders can be positioned beyond the area’s range, with the first upside target generally set around the 38.2% Fibonacci retracement of legs A-D (of the AB=CD pattern) at 1403.4, followed by a second take-profit level at the 61.8% Fibonacci retracement at 1416.9.
Areas of consideration:
Well done to any of our readers who managed to jump aboard yesterday’s upside move from 1372.4/1386.7. The final take-profit target was recently hit at 1416.9.
Traders are urged to consider the possibility sellers may re-enter the fold around current price. The research team notes weekly resistance at 1417.8 and the underside of daily supply at 1419.9.
The accuracy, completeness and timeliness of the information contained on this site cannot be guaranteed. IC Markets does not warranty, guarantee or make any representations, or assume any liability with regard to financial results based on the use of the information in the site.
News, views, opinions, recommendations and other information obtained from sources outside of www.icmarkets.com.au, used in this site are believed to be reliable, but we cannot guarantee their accuracy or completeness. All such information is subject to change at any time without notice. IC Markets assumes no responsibility for the content of any linked site.
The fact that such links may exist does not indicate approval or endorsement of any material contained on any linked site. IC Markets is not liable for any harm caused by the transmission, through accessing the services or information on this site, of a computer virus, or other computer code or programming device that might be used to access, delete, damage, disable, disrupt or otherwise impede in any manner, the operation of the site or of any user’s software, hardware, data or property.


