
EUR/USD:
Outlook unchanged.
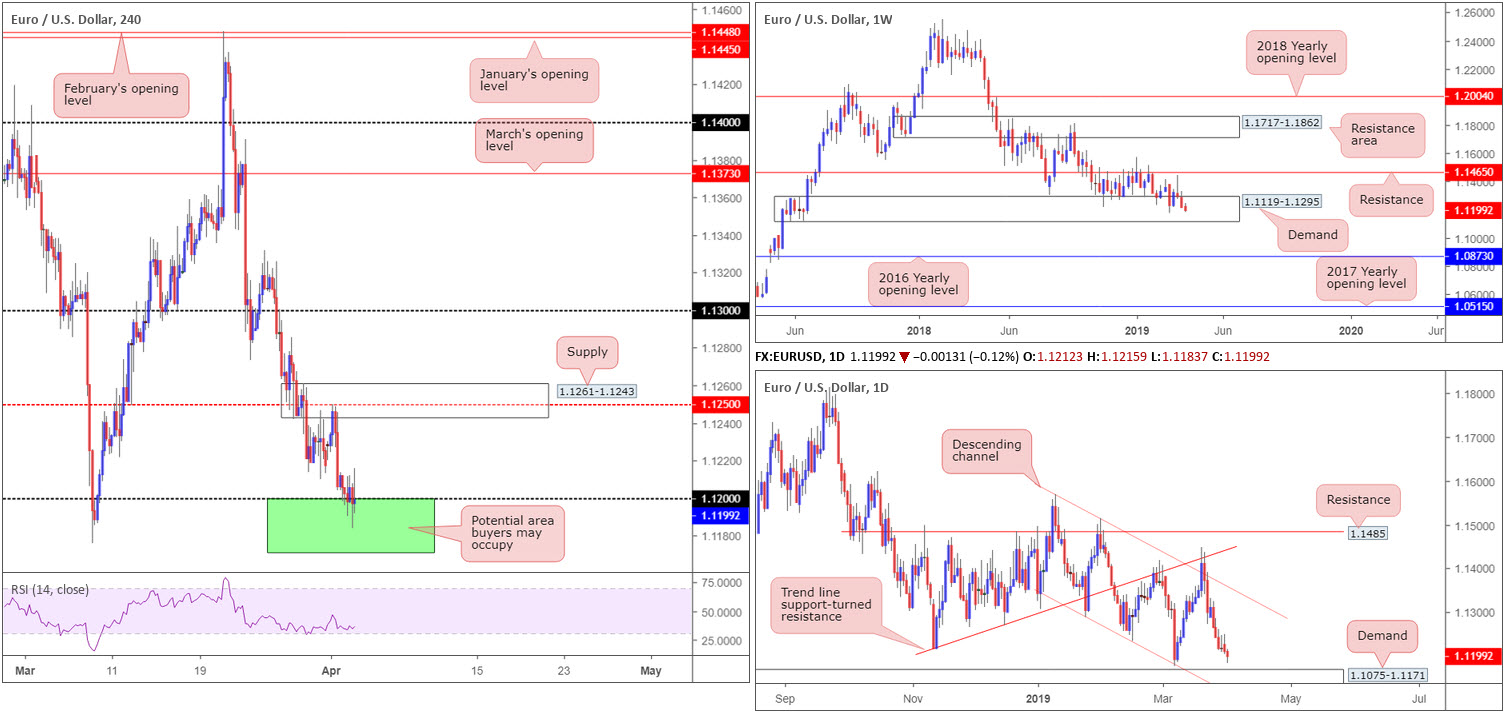
In recent sessions, the single currency was driven lower by an overall stronger dollar, despite weaker-than-expected US durable goods orders m/m. The H4 candles, as you can see, dipped their toes into 1.12 territory and from thereon entered into a phase of indecisiveness. 1.12, as underlined in Tuesday’s report, is an interesting support in view of its connection with higher-timeframe structure.
Weekly flow remains within the walls of demand at 1.1119-1.1295. Overall, the long-term trend on the weekly timeframe continues to face a southerly direction, with traders’ crosshairs now likely fixed on 1.1176: the 2019 yearly low. The next area of interest beyond the current demand, however, falls in around the 2016 yearly opening level priced in at 1.0873. According to the daily timeframe, nevertheless, the pair remains poised to approach demand at 1.1075-1.1171 this week. Note this demand area is fastened to the underside of the current weekly demand.
Traders may want to acknowledge 1.12 applied on the H4 timeframe is sited within the walls of the aforementioned weekly demand area, and less than thirty points above the current daily demand zone.
Areas of consideration:
With buyers and sellers seen battling for position around the top edge of 1.1171/1.12 (green H4), this area remains a potential area buyers may eventually make an appearance from. Not only is this zone enclosed within weekly demand, we have the top edge of daily demand present at 1.1171 and also the yearly low lurking at 1.1176.
A handsome H4 bullish candlestick pattern (entry/risk levels can be determined according to this structure) printed from 1.1171/1.12, in light of the region’s confluence, serves as an ideal trigger for buyer intent.
Today’s data points: US ADP Non-Farm Employment Change; US ISM Non-Manufacturing PMI.
GBP/USD:
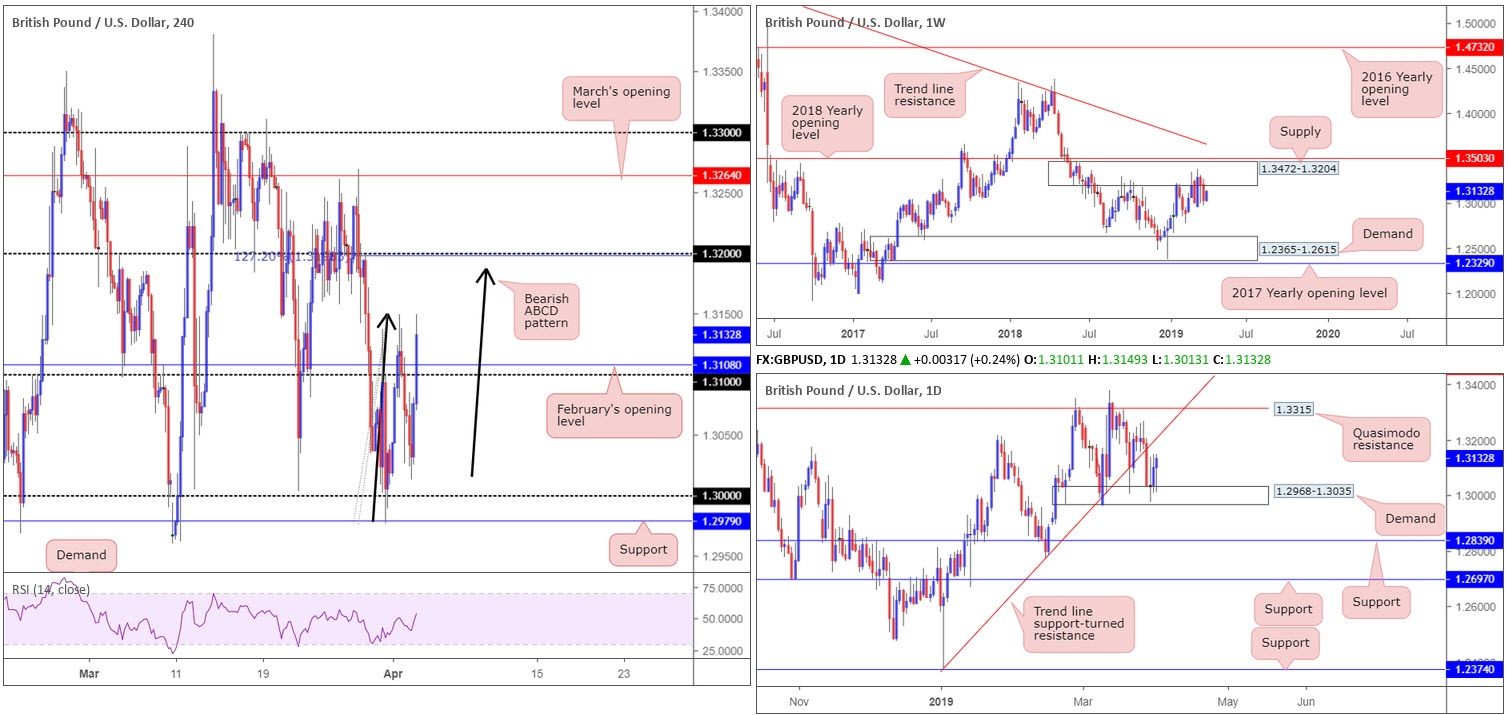
The British pound rose against its US counterpart Tuesday as concerns over a no-deal Brexit eased. UK PM May stated the UK needs a further extension of Article 50, and would end when a deal has been passed. The PM further added she will reach out to UK opposition leader Corbyn to help break the Brexit logjam.
After clocking a session low at 1.3013, the GBP/USD firmly brushed aside 1.31 and nearby February’s opening level at 1.3108 on the H4 timeframe. Beyond here, traders likely have their crosshairs fixed on a run towards 1.32ish, which happens to merge with a 127.2% ABCD (black arrows) bearish pattern. What’s also notable from a technical standpoint is trend line support-turned resistance (extended from the low 1.2373) out of the daily timeframe fusing closely with 1.12.
The story on the weekly timeframe shows the unit trading from supply drawn from 1.3472-1.3204. Since the end of February this has been home to many traders as price flips between gains/losses. The next obvious downside target from here falls in around demand at 1.2365-1.2615.
Areas of consideration:
A retest at 1.31 as support today could unlock the doors to a short-term buying opportunity, targeting 1.32 on the H4 timeframe. With psychological numbers prone to fakeouts, waiting for additional confirmation to form is recommended. Having this provides traders a way of identifying buyer intent as well as offering entry and risk levels to work with (based on the chosen confirmation method).
In the event our analysis is correct and the market observes a run towards 1.32, this number, in light of its surrounding confluence highlighted above, sets a strong foundation for a sell from this region. Like above, though, psychological numbers are prone to fakeouts and, therefore, waiting for additional confirmation to form is also recommended.
Today’s data points: UK Services PMI; US ADP Non-Farm Employment Change; US ISM Non-Manufacturing PMI.
AUD/USD:
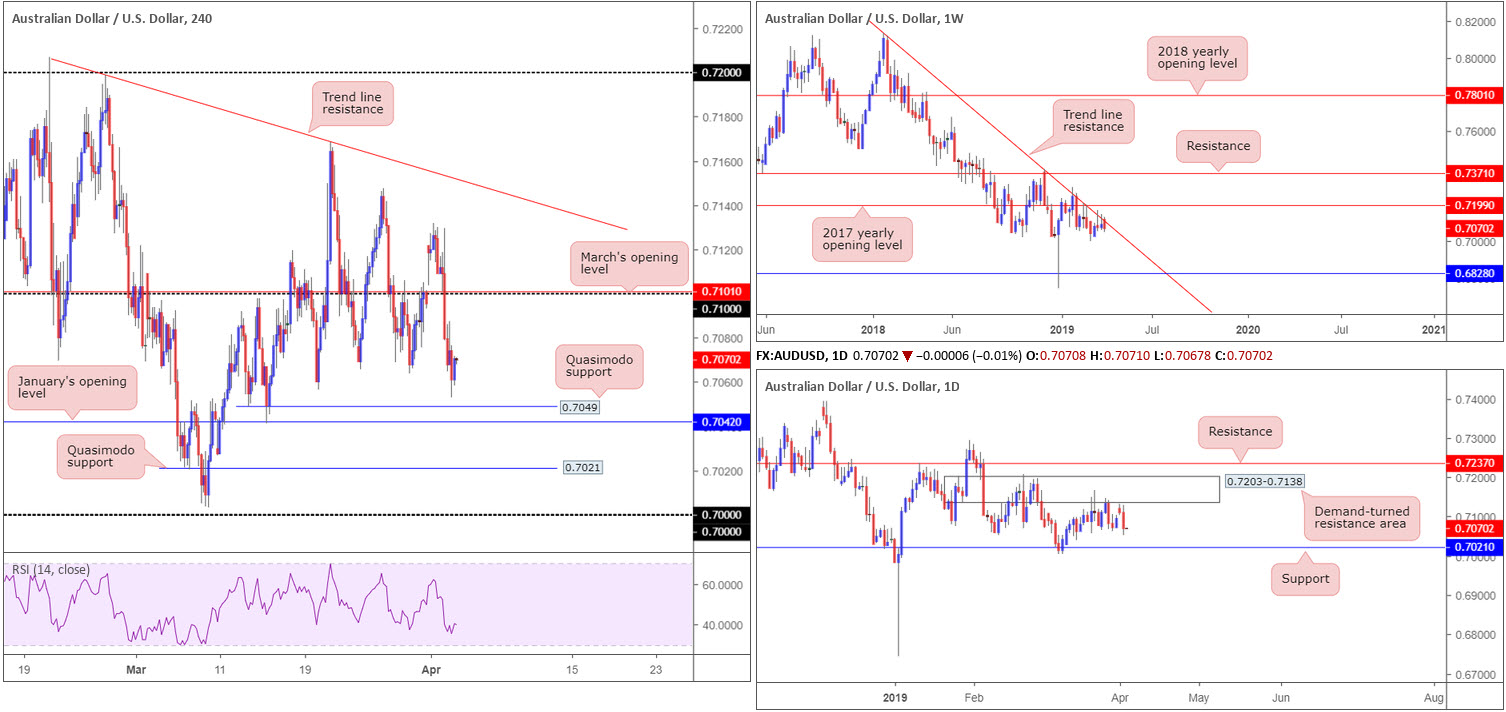
Dovish tweaks to the RBA’s statement weighed on the Australian dollar in the early hours of Asia Tuesday, consequently swallowing nearby 0.71 on the H4 timeframe. As anticipated, the central bank also kept interest rates unchanged at 1.5%.
From the top this morning, longer-term flows reveal weekly action fading a long-standing trend line resistance (etched from the high 0.8135). The market could eventually observe additional selling take shape from here as downside appears reasonably free until connecting with support coming in at 0.6828. Further adding to this bearish note, the daily timeframe has its candles driving lower from a demand-turned resistance area positioned at 0.7203-0.7138, with support plotted at 0.7021 as the next downside target.
H4 price, as already highlighted, crossed beneath 0.71 yesterday. Persistent selling carried forward into London and US hours; though the pair received some respite into the close as price action bottomed a few points north of Quasimodo support at 0.7049, followed closely by January’s opening level at 0.7042.
Areas of consideration:
A bounce north from 0.7042/0.7049 could materialise on the H4 timeframe today – a ‘bounce’ simply because of where the higher timeframe candles are possibly heading. With weekly price fading trend line resistance and daily price eyeing support at 0.7021, a move beyond 0.7042/0.7049 is potentially on the cards.
The Quasimodo support seen beneath 0.7042/0.7049 at 0.7021 is an interesting point for longs, due to it aligning with the daily support underscored above at 0.7021. Despite the clear confluence presented here, however, traders still have to contend with possible selling from the weekly timeframe. For that reason, trading long with additional confirmation is certainly something to consider.
Today’s data points: AUD Retail Sales m/m; AUD Trade Balance; CNY Caixin Services PMI; US ADP Non-Farm Employment Change; US ISM Non-Manufacturing PMI.
USD/JPY:
Outlook unchanged.
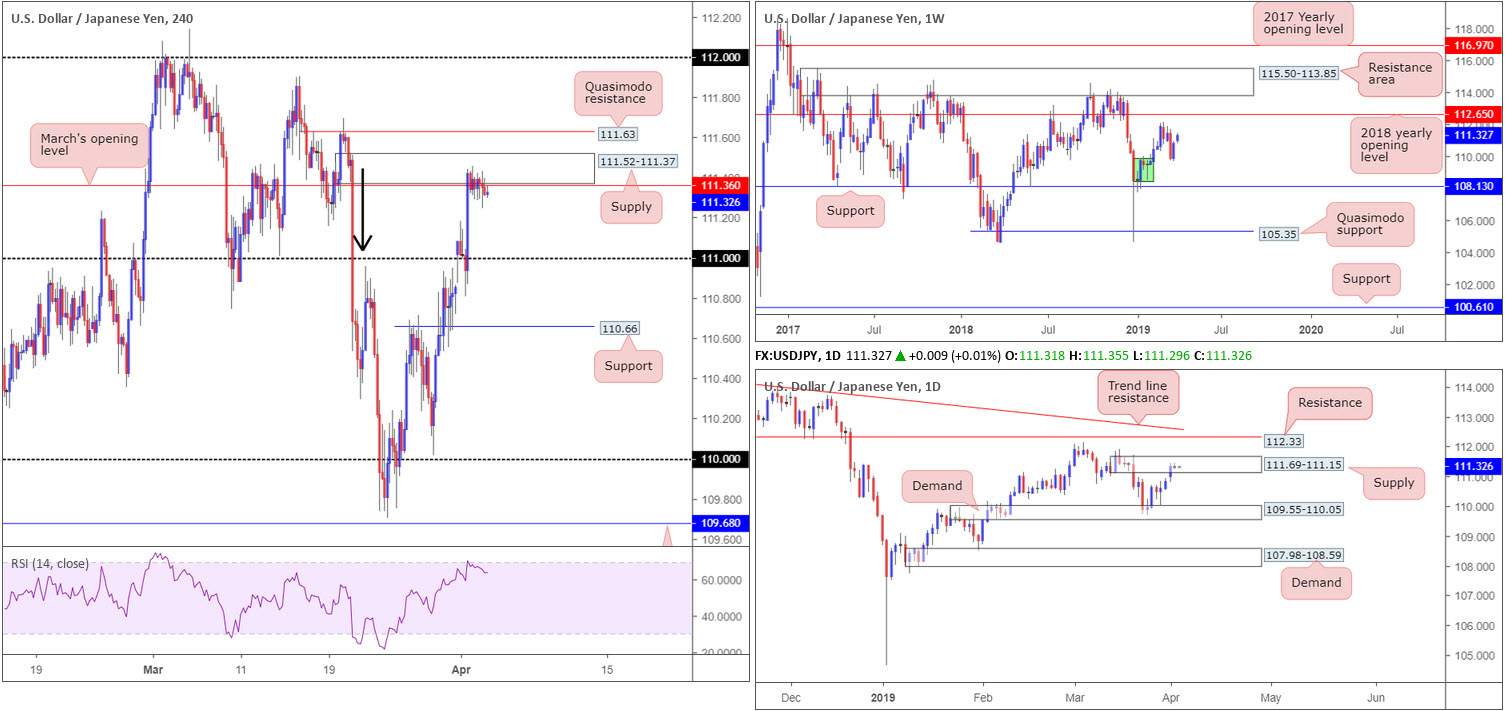
USD/JPY price is little changed this morning, ranging no more than 20 points yesterday (-0.02%). On account of this, much of the following piece will echo thoughts put forward in Tuesday’s briefing…
H4 supply at 111.52-111.37 (fuses with March’s opening level at 111.36) is, as you can see, currently capping upside. Not only is the supply itself attractive given the strength of the sellers from its base (black arrow); the area also resides within the parapets of daily supply coming in at 111.69-111.15. Therefore, this may generate sufficient impetus to force a retest at 111 today. It might also interest traders to note the RSI indicator is seen rotating lower from its overbought value.
In the event we push for higher levels today, nonetheless, the H4 Quasimodo resistance nearby at 111.63, which is also fixed within the walls of the current daily supply zone, is next in the firing range.
Areas of consideration:
In light of the current H4 supply being sited within daily supply, a sell from here is an idea today, targeting 111 as an initial take-profit target. Should the H4 zone fail to hold and we head for H4 Quasimodo resistance mentioned above at 111.63, a sell from here is also a consideration, again targeting 111 as the initial port of call.
Waiting for additional confirmation to form before pulling the trigger is something to consider at the aforesaid H4 supply (entry/risk levels can be defined according to the confirmation technique selected). This helps avoid an unnecessary loss should the pair head for the noted H4 Quasimodo resistance, which we believe is a clear enough barrier to trade without confirmation (stops can be positioned above the upper limit of daily supply at 111.69).
Today’s data points: US ADP Non-Farm Employment Change; US ISM Non-Manufacturing PMI.
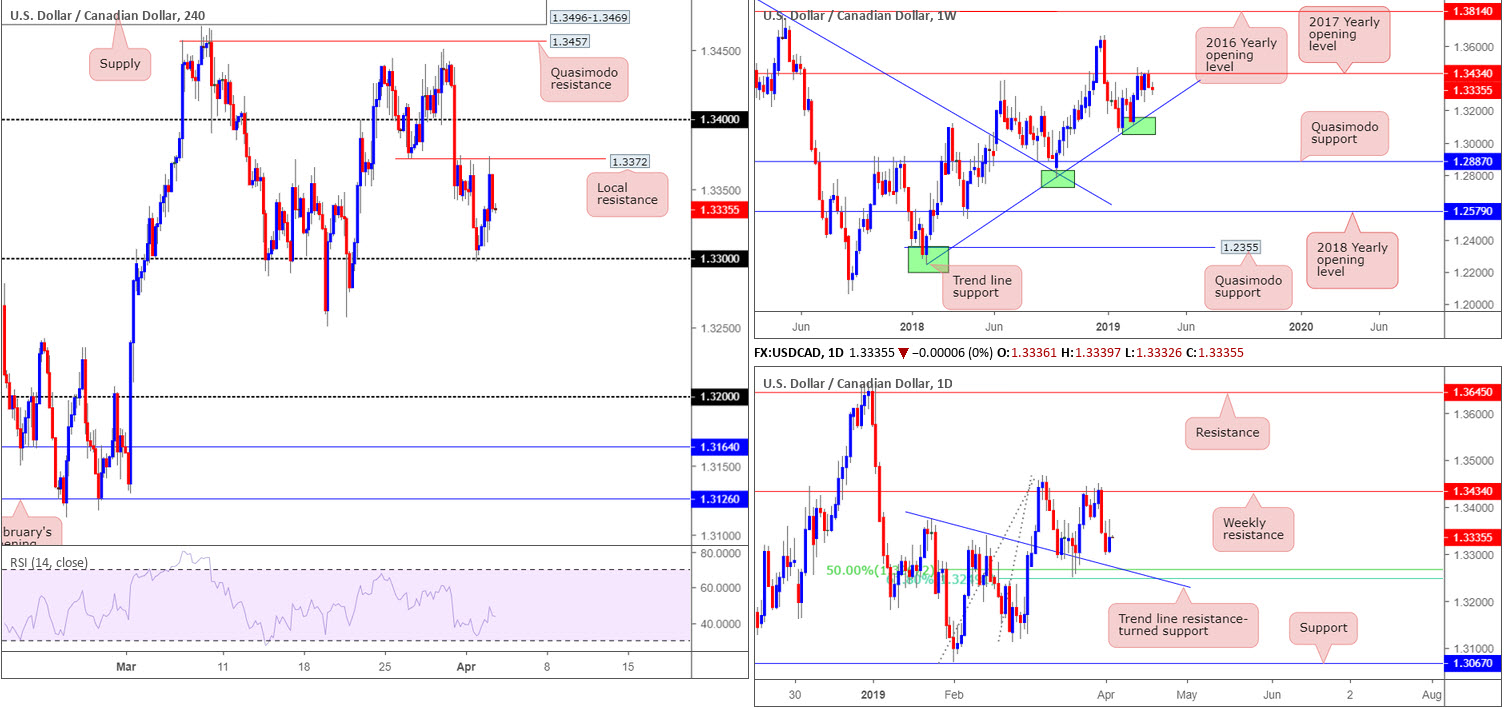
USD/CAD:
Outlook unchanged.
Despite WTI refreshing 2019 highs above $62.50 Tuesday, the USD/CAD also scoured higher ground. Although recording gains of 0.22% on the day and breaking a two day-bearish phase, local resistance on the H4 timeframe coming in at 1.3372 shoved its way into the spotlight.
With the H4 candles now emphasising a somewhat indecisive tone between 1.3372/1.33, it’d be difficult to decipher which direction we’re headed next without employing additional timeframes.
In terms of where the market is positioned on the weekly timeframe, the pair remains engaged with notable resistance at 1.3434 (the 2017 yearly opening level) following a dominant push higher from trend line support (taken from the low 1.2247). In conjunction with weekly movement, daily flow could also generate additional selling, targeting a 50.0% support at 1.3267, which happens to merge closely with a 61.8% Fibonacci support at 1.3248 and a trend line resistance-turned support (extended from the high 1.3375).
Areas of consideration:
With daily candles likely to eventually bring in 1.3260ish and weekly price indicating we may head for levels beyond here, further buying on the H4 timeframe is unlikely. On account of this, the research team notes a potential H4 close beneath 1.33 is possible, which is enough to underline a sell towards the 50.0% support at 1.3267 on the daily timeframe as the initial target. While breakout traders may be satisfied entering short at the close of a breakout candle, conservative traders may opt to wait and see if a retest at the underside of 1.33 is seen before pulling the trigger. An ideal scenario would be for the retest to form in the shape of a H4 (or a lower-timeframe pattern if you prefer) bearish candlestick formation, as traders can use this to outline entry/risk levels as well as define seller intent.
Today’s data points: US ADP Non-Farm Employment Change; US ISM Non-Manufacturing PMI.
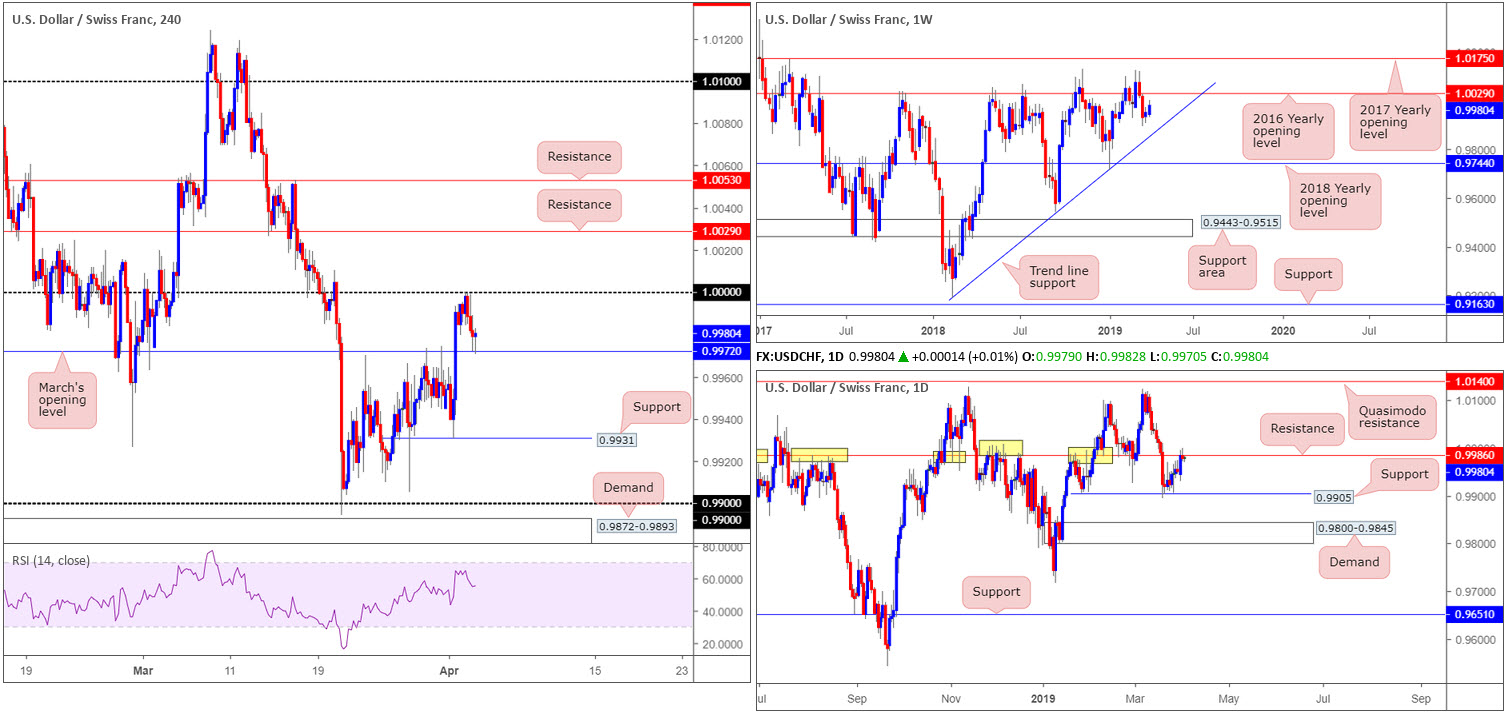
USD/CHF:
The USD/CHF settled a few points north of March’s opening level at 0.9972 on the H4 timeframe Tuesday, following a modest selloff from 1.0000 (parity) during London and US sessions. Bolstering 1.0000 is daily resistance priced in at 0.9986, which, by and of itself, is a notable barrier with history dating as far back as November 2017. A selloff from here has nearby daily support fixed at 0.9905 to target.
A broader perspective, however, has weekly price eyeing a run towards its 2016 yearly opening level at 1.0029, after failing to test nearby trend line support (etched from the low 0.9187).
Areas of consideration:
To confirm seller intent, a H4 close beneath March’s opening level at 0.9972 is required, according to our technical studies. This potentially sets the stage for a run towards H4 support at 0.9931, followed closely by daily support plotted at 0.9905.
Aggressive traders may opt to simply sell the breakout candle, be it of a H4 or H1 range. Conservative traders, however, will likely look for a retest to be seen at the underside of 0.9972, preferably in the form of a bearish candlestick signal, either on the H4 or H1 scale (entry/risk levels can be determined according to this structure).
Today’s data points: US ADP Non-Farm Employment Change; US ISM Non-Manufacturing PMI.
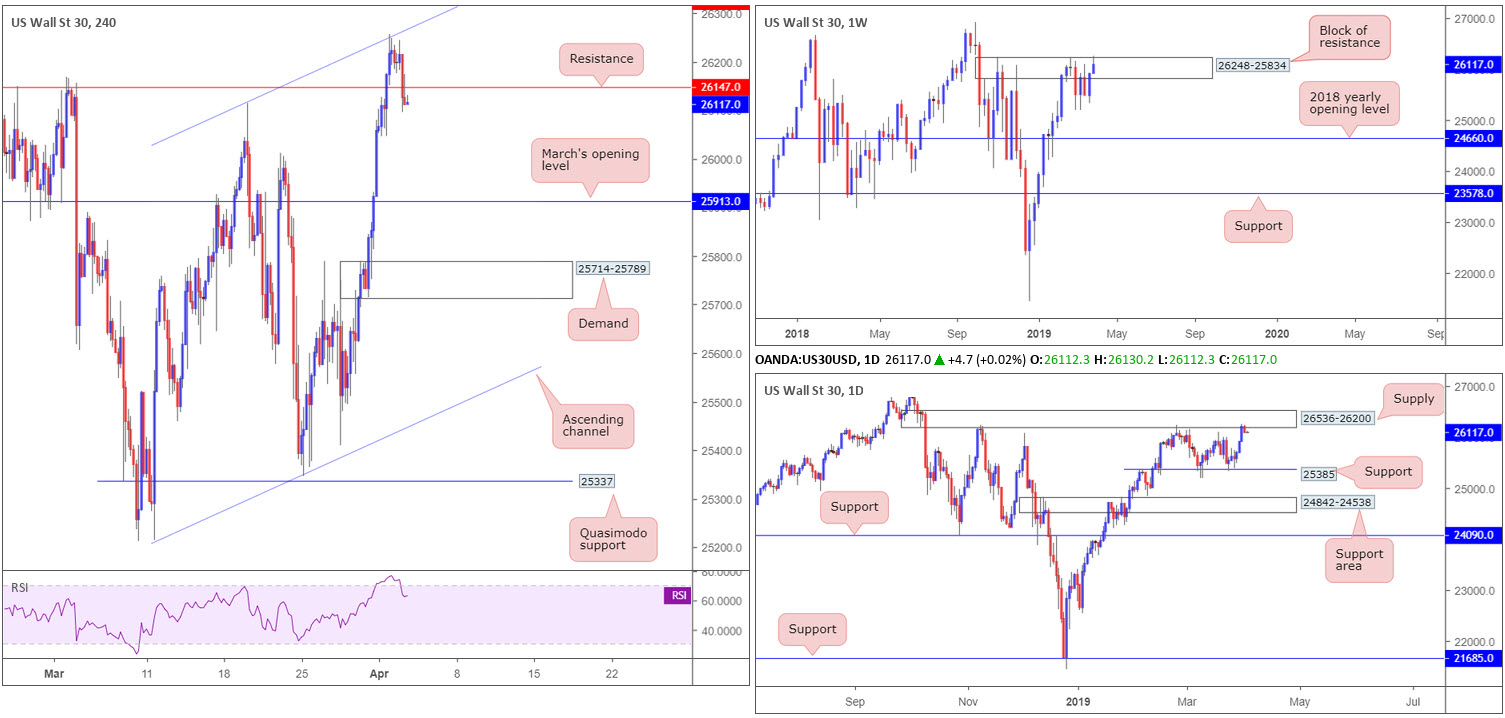
Dow Jones Industrial Average:
Breaking a three-day bullish run, profit taking ensued on Wall Street Tuesday, down 0.40% on the day.
Despite a firm start to the week on the back of Chinese data and optimism over trade talks between the US and China, the index was pulled lower by Walgreens Boots Alliance Inc. yesterday after lower pharmacy reimbursements hurt earnings at the drugstore chain.
Monday witnessed the H4 candles cross swords with channel resistance (taken from the high 26114). The response seen thus far, which reclaimed H4 support at 26147 to the downside, could encourage further selling towards support at 25913: March’s opening level. In conjunction with H4 structure, weekly price is seen testing the top edge of a block of resistance coming in at 26248-25834. A clean sweep beyond here could see the index knocking on the door of the all-time high 26939. A closer reading of price action on the daily timeframe directs the spotlight towards supply pencilled in at 26536-26200. Note this area has capped upside on a number of occasions as it is glued to the top edge of the weekly resistance mentioned above at 26248-25834.
Areas of consideration:
A retest of the recently broken support on the H4 timeframe at 26147 as resistance could be seen today (entry/risk levels can be defined according to the range of the rejecting H4 candle). This, given both weekly and daily timeframes show room to press lower from notable resistances, is a reasonably high-probability trade.
Today’s data points: US ADP Non-Farm Employment Change; US ISM Non-Manufacturing PMI.
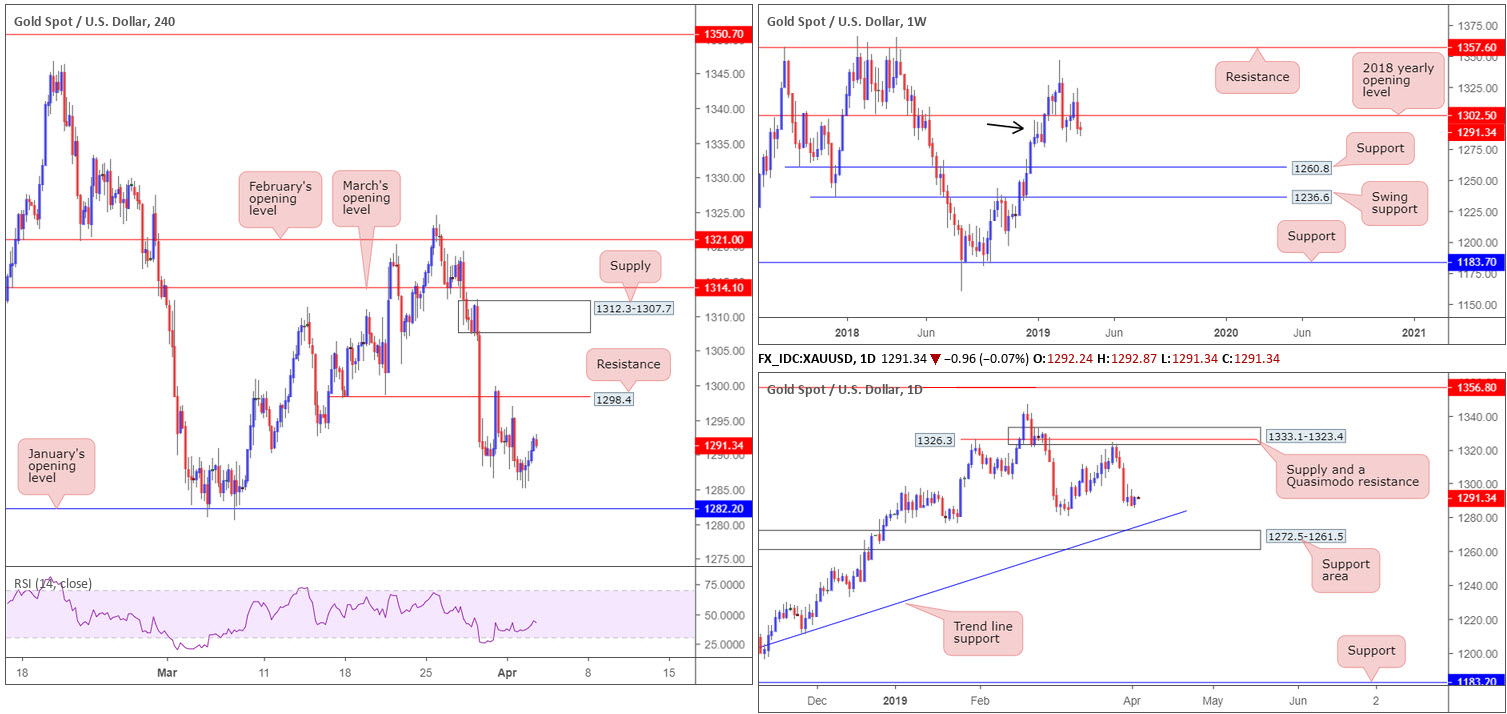
XAU/USD (GOLD):
Outlook unchanged.
Leaving January’s opening level at 1282.2 unchallenged on the H4 timeframe Tuesday, the price of gold churned higher. Ultimately, the next upside objective on the H4 scale is seen at resistance drawn from 1298.4, which held price lower last week. The next area of interest beyond here falls in around supply coming in at 1312.3-1307.7.
The broader picture reveals the metal recently snapped back beneath its 2018 yearly opening level at 1302.5, by way of a strong bearish engulfing candle. Although viewed by some as a bearish cue to potentially push lower this week, it is worth pencilling in demand (black arrow) at 1276.9-1295.8. A break south of this area has support at 1260.8 to target.
Immediate support on the daily timeframe to be aware of is the 1281.0 March 7 low, followed by a support area coming in at 1272.5-1261.5 and merging trend line support (taken from the low 1160.3).
Areas of consideration:
As the yellow metal recently re-entered the jaws of weekly demand at 1276.9-1295.8, albeit on the back of strong selling, a bounce from January’s opening level on the H4 timeframe at 1282.2 and merging support seen at the 1281.0 March 7 low (daily timeframe) is still an idea should the area be tested. An added bonus would be H4 price chalking up bullish a candlestick signal off 1281.0/1282.2, consequently identifying buyer intent and also serving as a base to determine entry and risk levels.
The accuracy, completeness and timeliness of the information contained on this site cannot be guaranteed. IC Markets does not warranty, guarantee or make any representations, or assume any liability with regard to financial results based on the use of the information in the site.
News, views, opinions, recommendations and other information obtained from sources outside of www.icmarkets.com.au, used in this site are believed to be reliable, but we cannot guarantee their accuracy or completeness. All such information is subject to change at any time without notice. IC Markets assumes no responsibility for the content of any linked site. The fact that such links may exist does not indicate approval or endorsement of any material contained on any linked site.
IC Markets is not liable for any harm caused by the transmission, through accessing the services or information on this site, of a computer virus, or other computer code or programming device that might be used to access, delete, damage, disable, disrupt or otherwise impede in any manner, the operation of the site or of any user’s software, hardware, data or property.


