
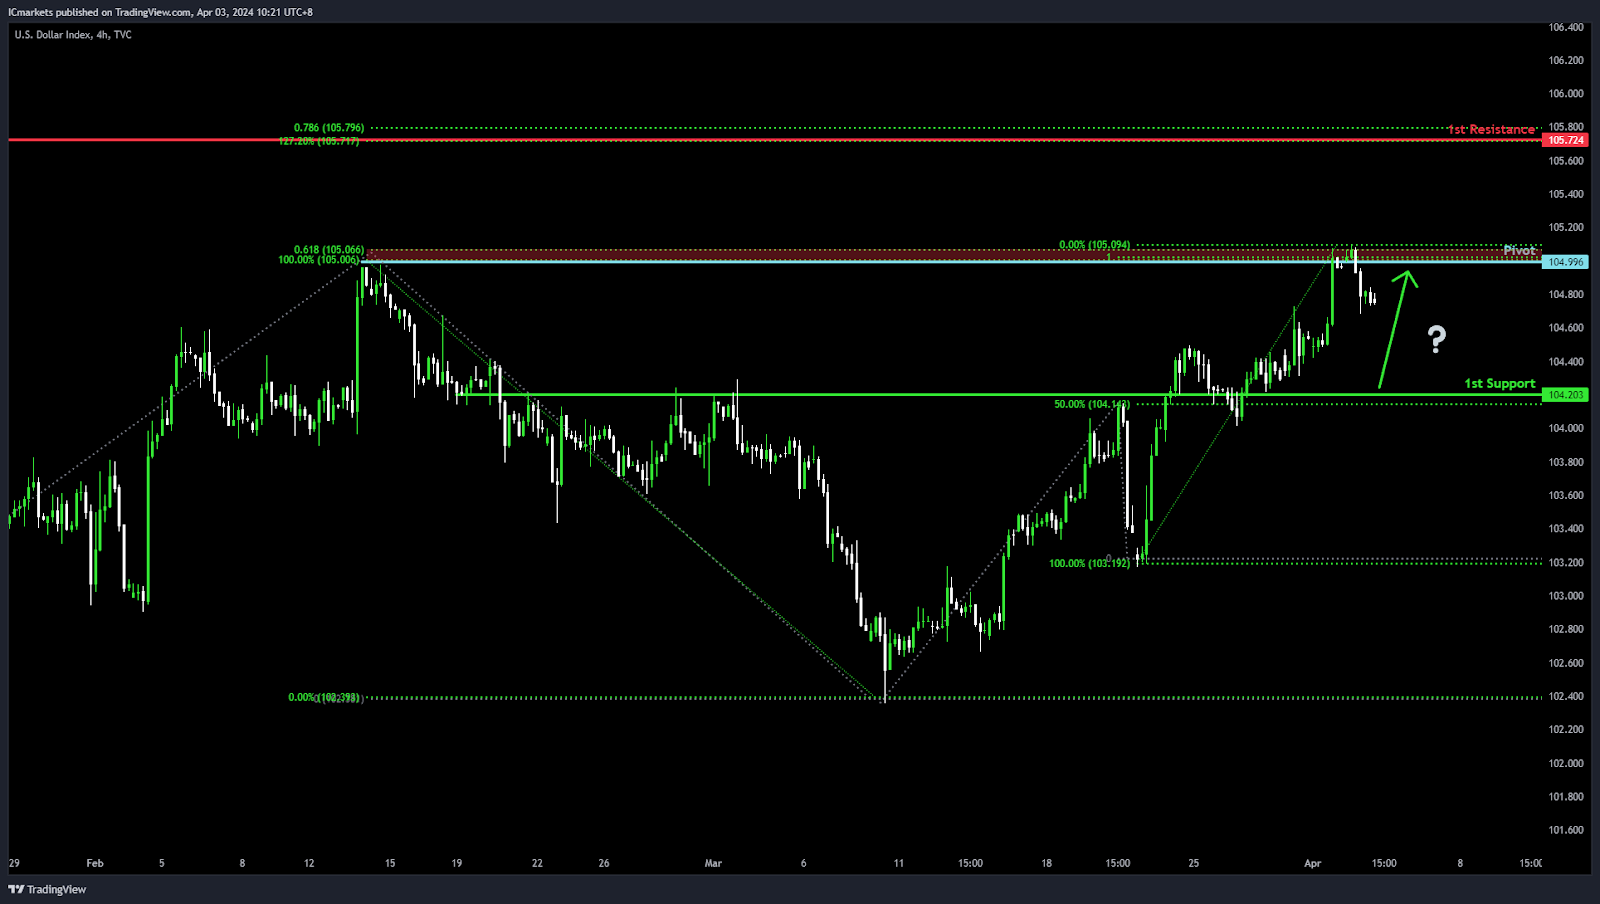
DXY (US Dollar Index):
Potential Direction: Bullish
Overall momentum of the chart: Bullish
Price could potentially make a: Bullish bounce off pivot and head towards 1st resistance
Pivot: 104.20
Supporting reasons: Acts as an Overlap support with a 50% Fibonacci Retracement, indicating a key level where buying interest might intensify, suggesting a solid foundation for a potential upward movement within the context of the overall bullish trend.
1st support: 103.56
Supporting reasons: Known as Pullback support with a 78.60% Fibonacci Retracement, suggesting a significant area where the market has previously found strong buying interest, providing a foundation for potential price stabilization or a minor rebound.
1st resistance: 104.99
Supporting reasons: Identified as Multi-swing high resistance, marking a significant barrier that has capped previous upward movements.
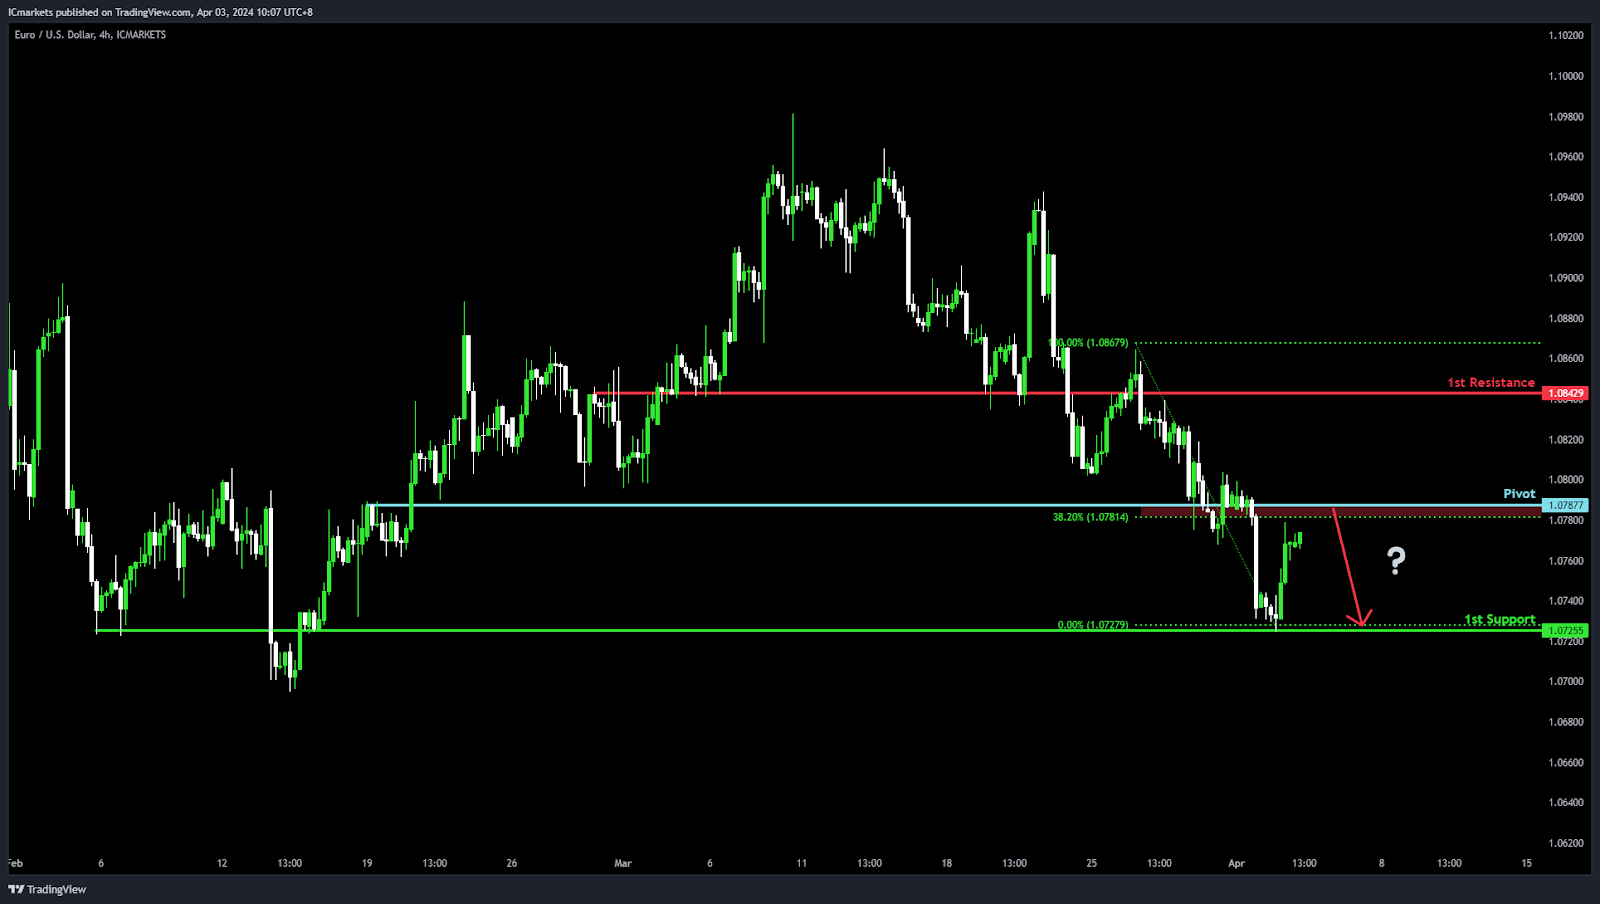
EUR/USD:
Potential Direction: Bearish
Overall momentum of the chart: Bearish
Price could potentially make a: Bearish reaction off pivot and drop to 1st support
Pivot: 1.0787
Supporting reasons: Acts as Pullback resistance with a 38.20% Fibonacci Retracement, indicating a key level where selling pressure might intensify, suggesting a potential turning point for the price to continue its downward movement.
1st support: 1.0725
Supporting reasons: Known as an Overlap support, suggesting a significant area where the market has previously found strong buying interest, providing a foundation for potential price stabilization or a minor rebound within the context of a bearish move.
1st resistance: 1.0842
Supporting reasons: Identified as an Overlap resistance, marking a significant barrier that has capped previous upward movements.
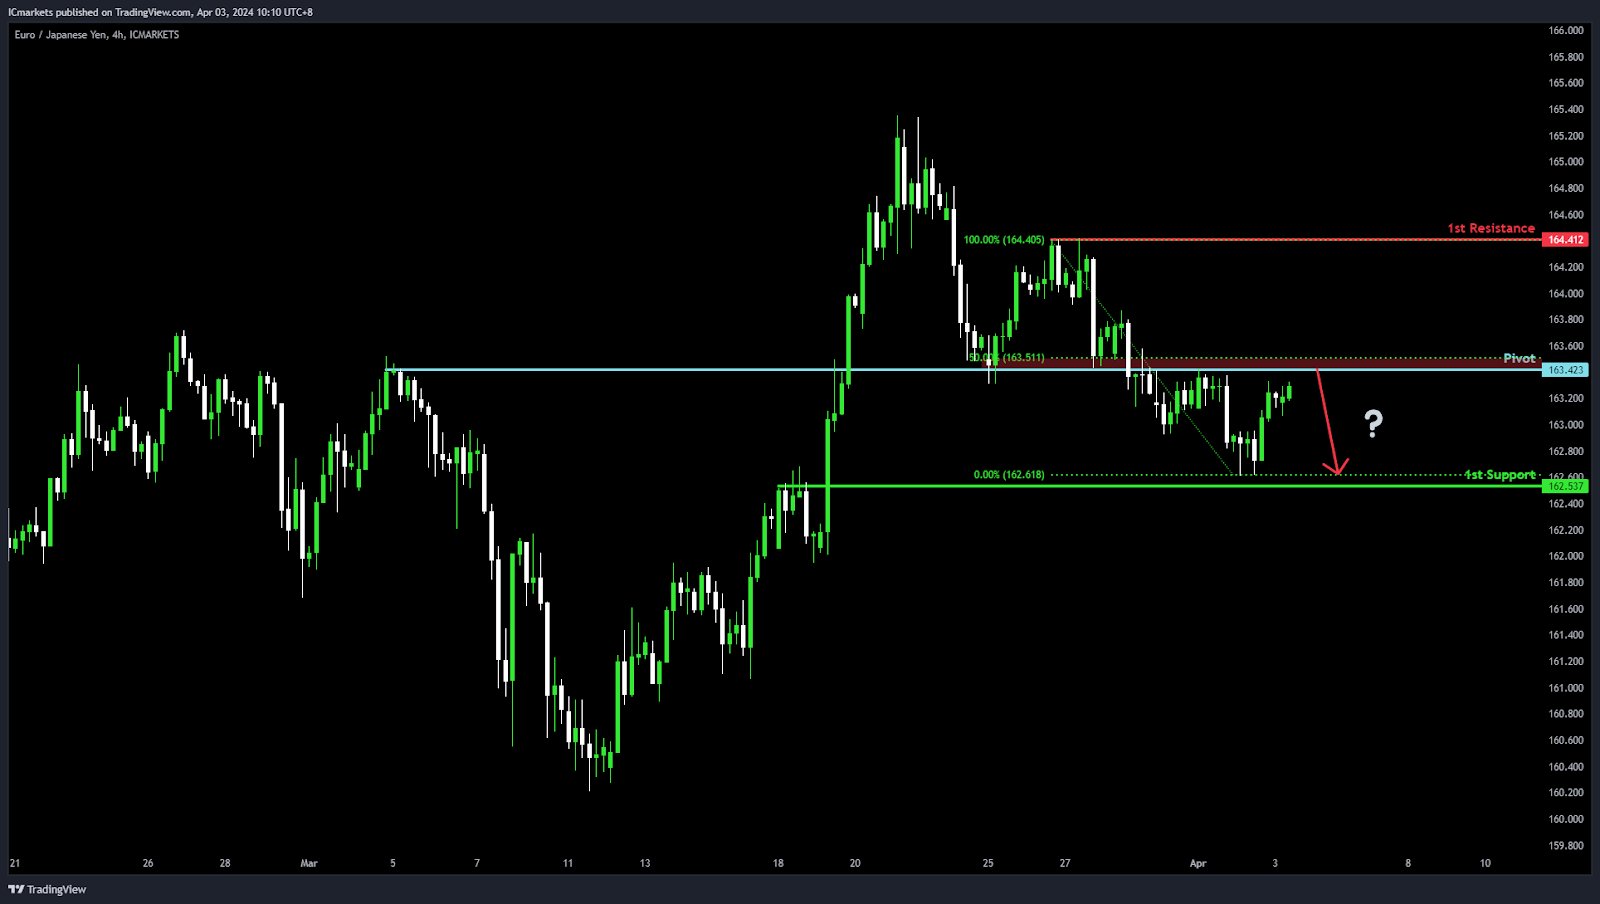
EUR/JPY:
Potential Direction: Bearish
Overall momentum of the chart: Bearish
Price could potentially make a: Bearish reaction off pivot and drop to 1st support
Pivot: 163.42
Supporting reasons: Acts as an Overlap resistance with a 50% Fibonacci Retracement, indicating a key level where selling pressure might intensify, suggesting a potential turning point for the price to reverse and move downwards within the context of the overall bearish trend.
1st support: 162.53
Supporting reasons: Known as Pullback support, suggesting a significant area where the market has previously found strong buying interest, providing a foundation for potential price stabilization or a minor rebound within the context of a bearish move.
1st resistance: 164.41
Supporting reasons: Identified as Multi-swing high resistance, marking a significant barrier that has capped previous upward movements.
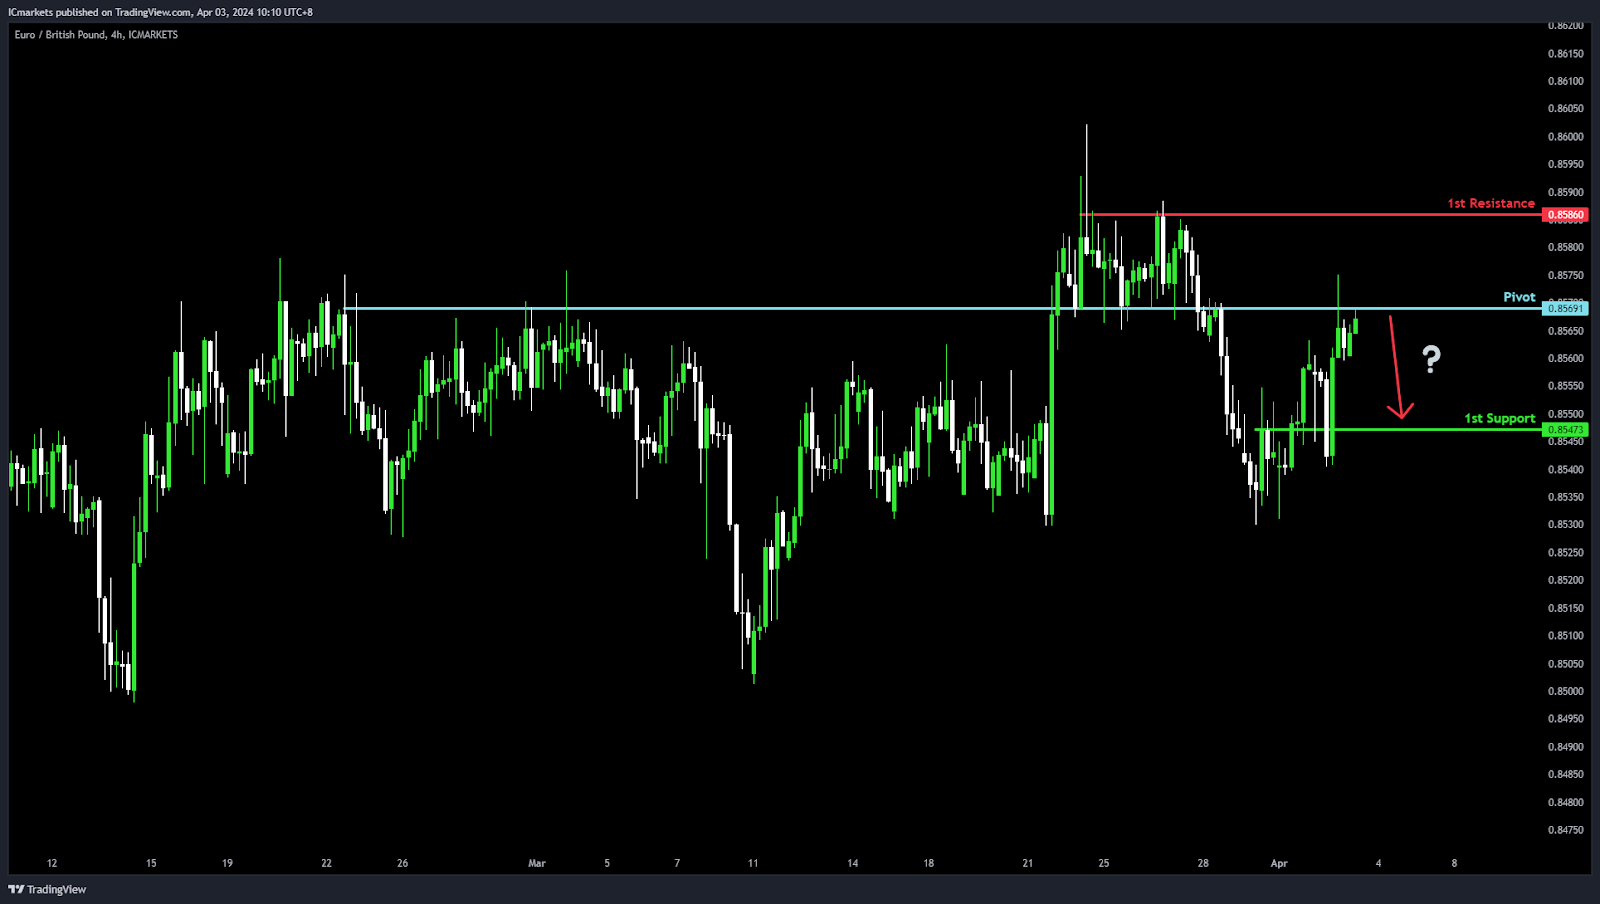
EUR/GBP:
Potential Direction: Bearish
Overall momentum of the chart: Bearish
Price could potentially make a: Bearish reaction off pivot and drop to 1st support
Pivot: 0.8569
Supporting reasons: Acts as an Overlap resistance, indicating a key level where selling pressure might intensify, suggesting a potential turning point for the price to reverse and move downwards within the context of the overall bearish trend.
1st support: 0.8547
Supporting reasons: Known as Pullback support, suggesting a significant area where the market has previously found strong buying interest, providing a foundation for potential price stabilization or a minor rebound within the context of a bearish move.
1st resistance: 0.8586
Supporting reasons: Identified as Multi-swing high resistance, marking a significant barrier that has capped previous upward movements.
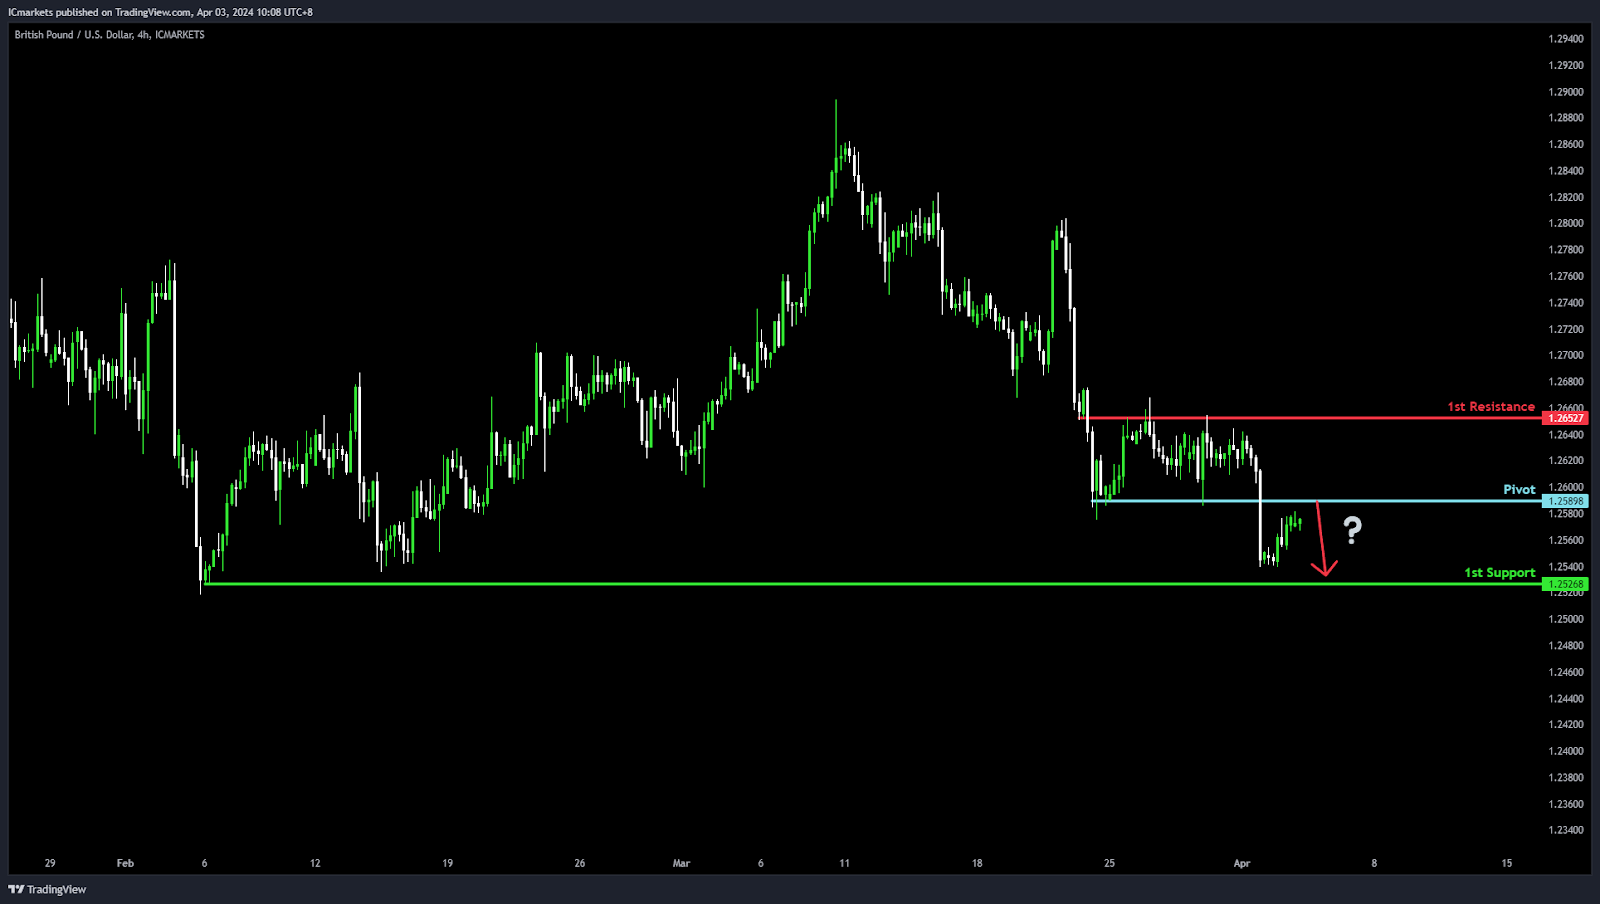
GBP/USD:
Potential Direction: Bearish
Overall momentum of the chart: Bearish
Price could potentially make a: Bearish reaction off pivot and drop to 1st support
Pivot: 1.2589
Supporting reasons: Acts as Pullback resistance, indicating a key level where selling pressure might intensify, suggesting a potential turning point for the price to continue its downward movement within the context of the overall bearish trend.
1st support: 1.2526
Supporting reasons: Known as Swing low support, suggesting a significant area where the market has previously found support, providing a foundation for potential price stabilization or a minor rebound, reinforcing the bearish outlook.
1st resistance: 1.2652
Supporting reasons: Identified as Multi-swing high resistance, marking a significant barrier that has capped previous upward movements.
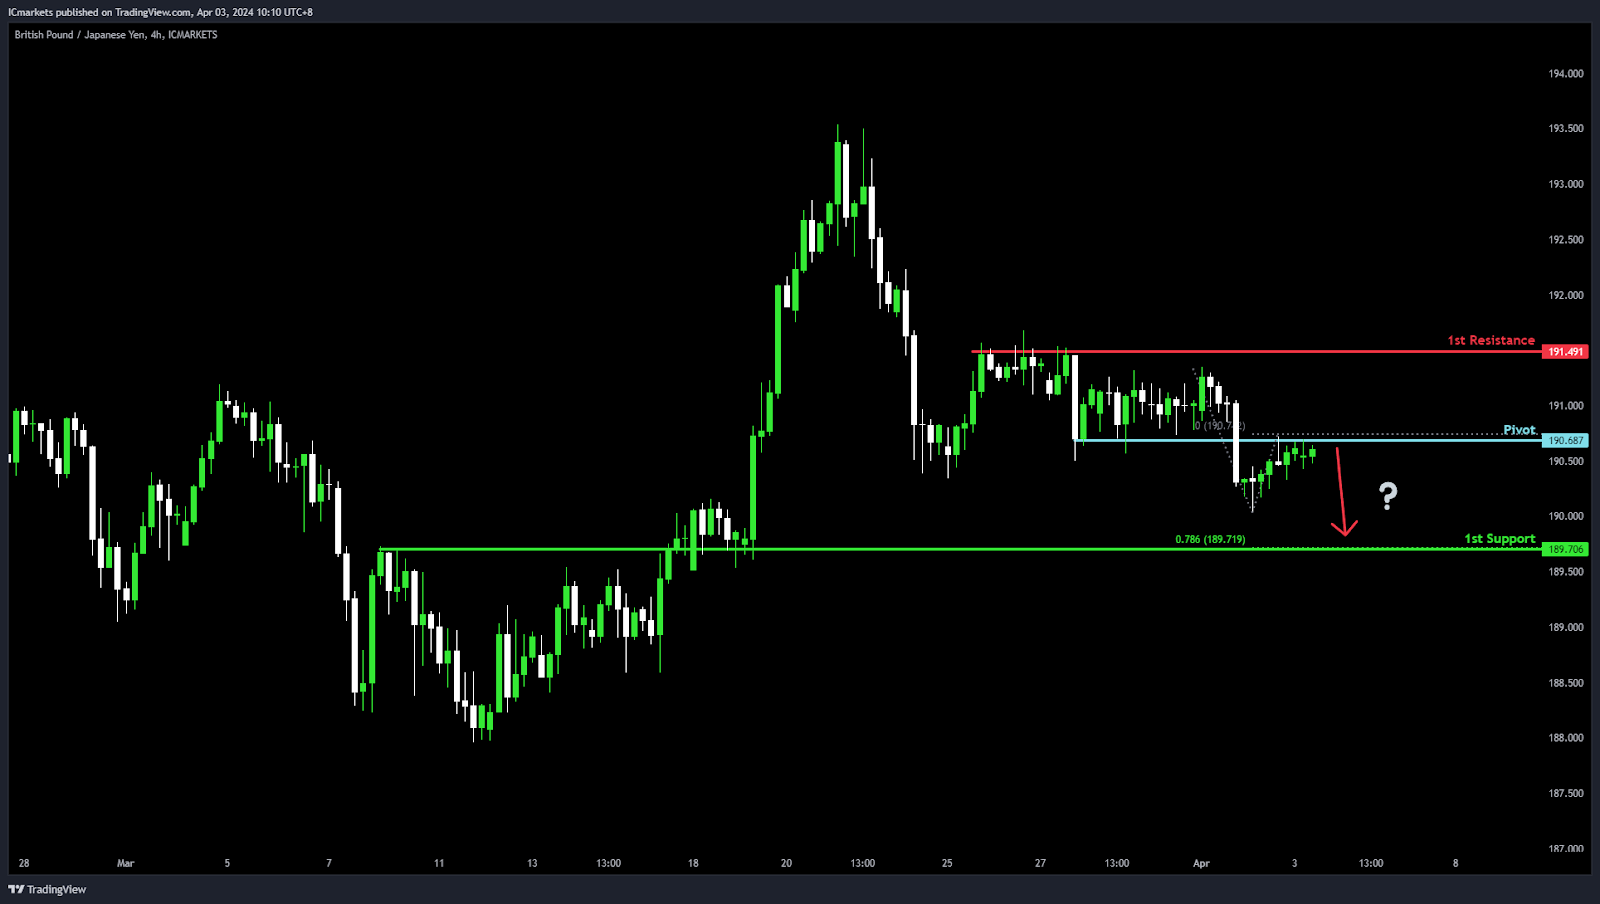
GBP/JPY:
Potential Direction: Bearish
Overall momentum of the chart: Bearish
Price could potentially make a: Bearish reaction off pivot and drop to 1st support
Pivot: 190.68
Supporting reasons: Acts as an Overlap resistance, indicating a key level where selling pressure might intensify, suggesting a potential turning point for the price to reverse and move downwards within the context of the overall bearish trend.
1st support: 189.70
Supporting reasons: Known as an Overlap support, suggesting a significant area where the market has previously found strong buying interest, providing a foundation for potential price stabilization or a minor rebound within the context of a bearish move.
1st resistance: 191.49
Supporting reasons: Identified as Multi-swing high resistance, marking a significant barrier that has capped previous upward movements.
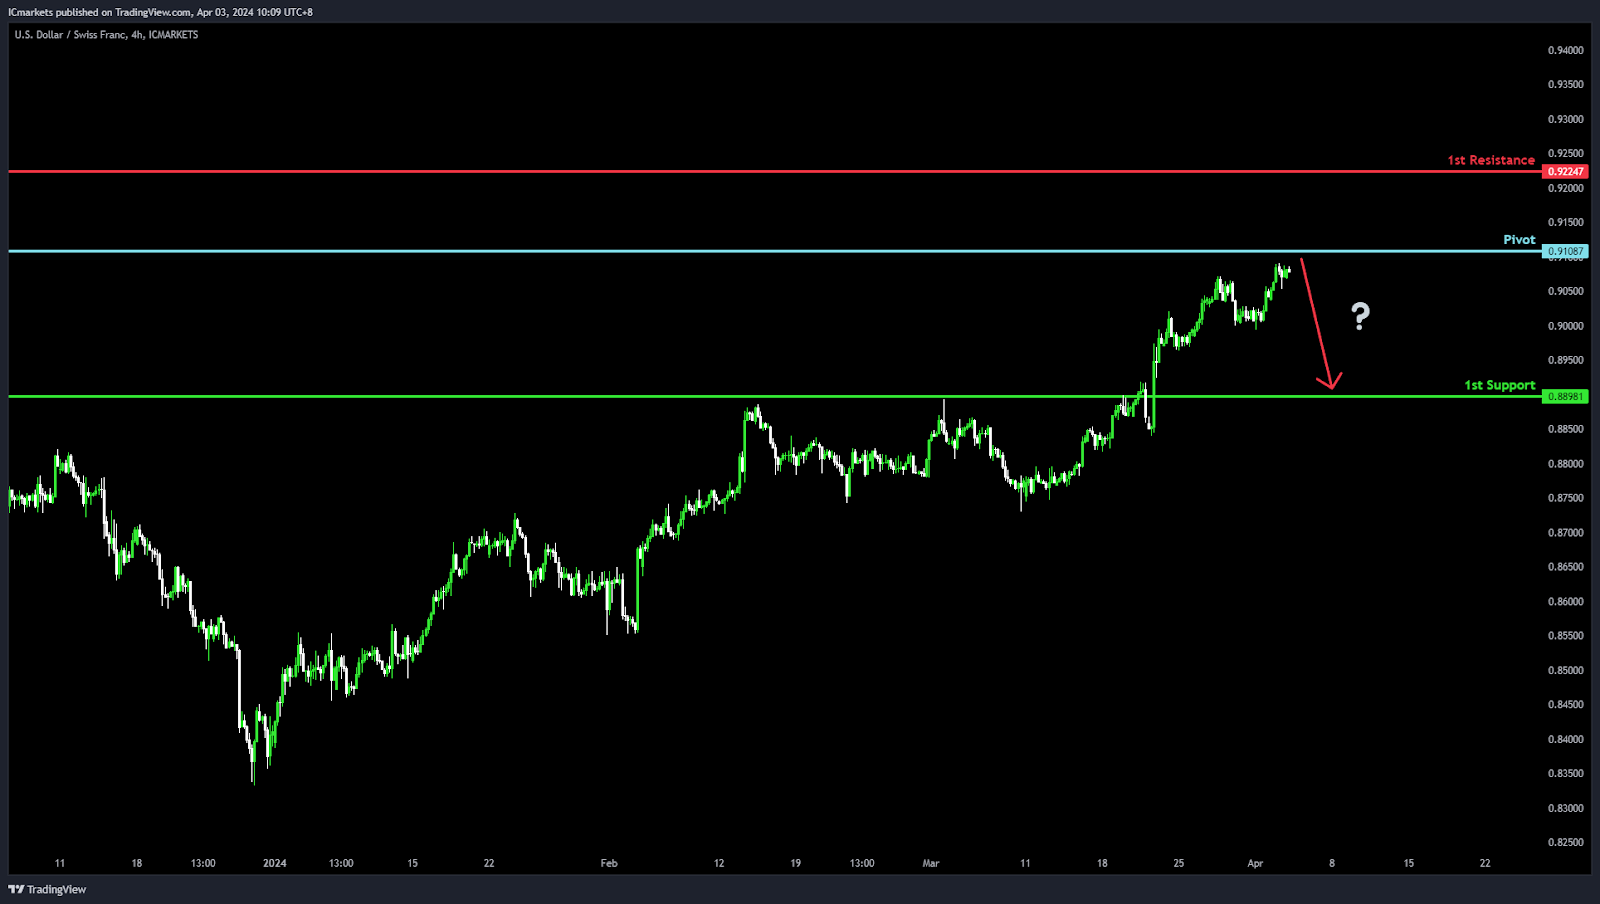
USD/CHF:
Potential Direction: Bearish
Overall momentum of the chart: Bullish
Price could potentially make a: Bearish reaction off pivot and drop to 1st support
Pivot: 0.9108
Supporting reasons: Acts as Pullback resistance, a critical level where selling pressure might intensify, indicating a potential turning point for the price to reverse and move downwards despite the prevailing bullish trend.
1st support: 0.8898
Supporting reasons: Known as Pullback support, suggesting a significant area where the market has previously found support, providing a foundation for potential price stabilization or a minor rebound within the context of a bearish move.
1st resistance: 0.9224
Supporting reasons: Identified as Swing high resistance, marking a significant barrier that has capped previous upward movements.
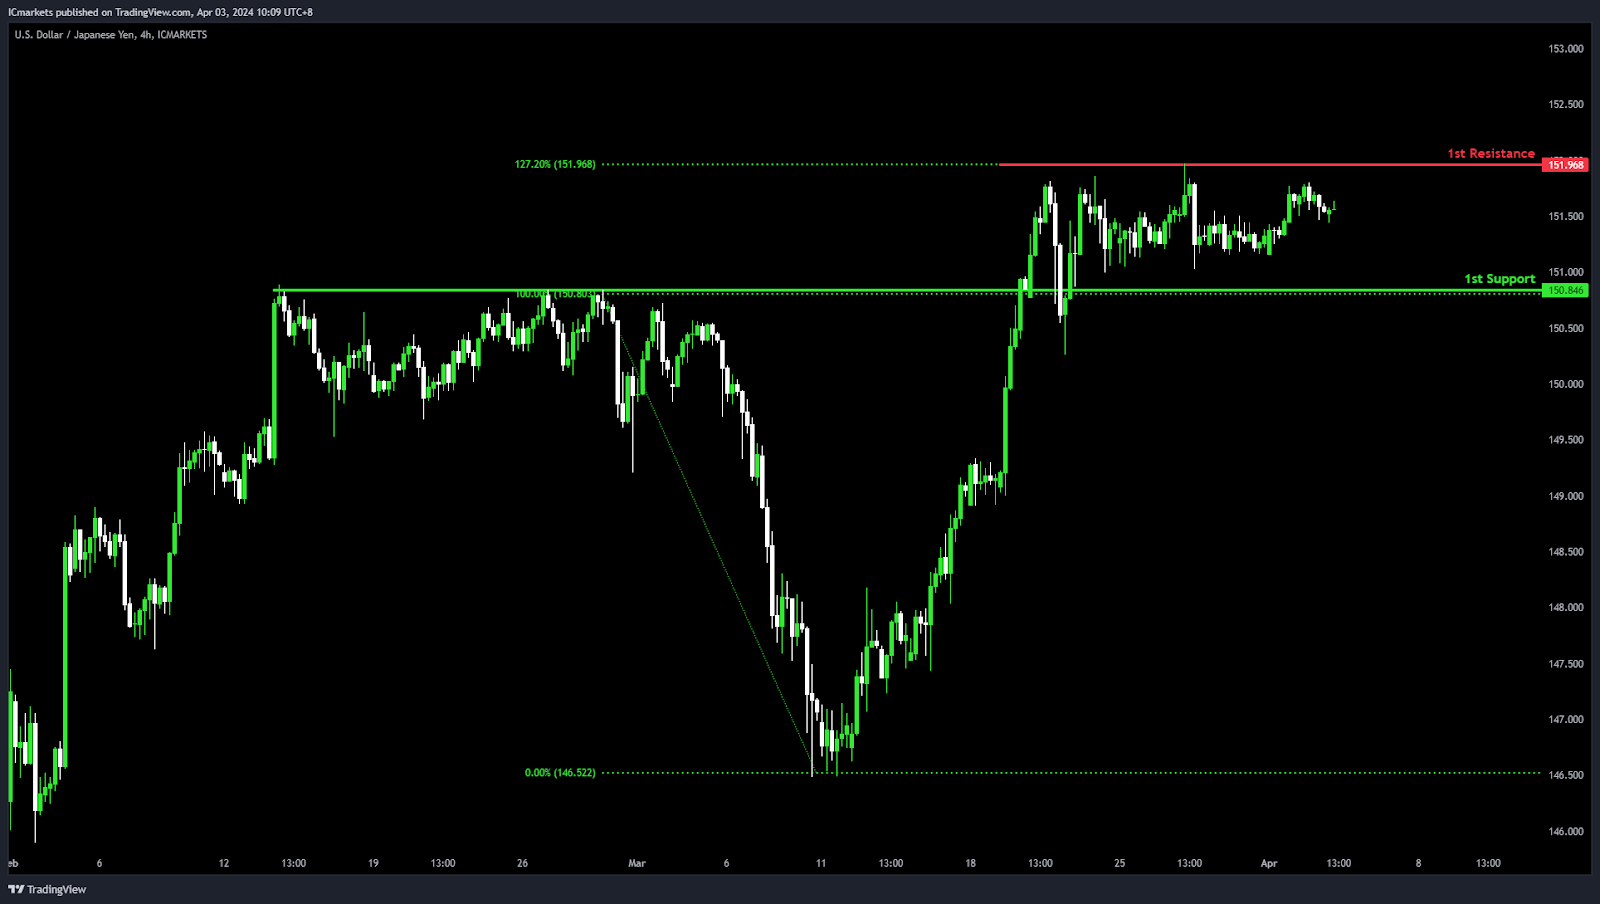
USD/JPY:
Potential Direction: Neutral
Overall momentum of the chart: Neutral
Price could potentially: Fluctuate between the 1st resistance and 1st support level.
1st support: 150.84
Supporting reasons: Acts as an Overlap support, indicating a key level where buying interest has historically been strong, suggesting a solid foundation for potential price stabilization or a rebound if it retreats from higher levels.
1st resistance: 151.96
Supporting reasons: Identified as Multi-swing high resistance with a 127.20% Fibonacci Extension, marking a significant barrier that has capped previous upward movements.
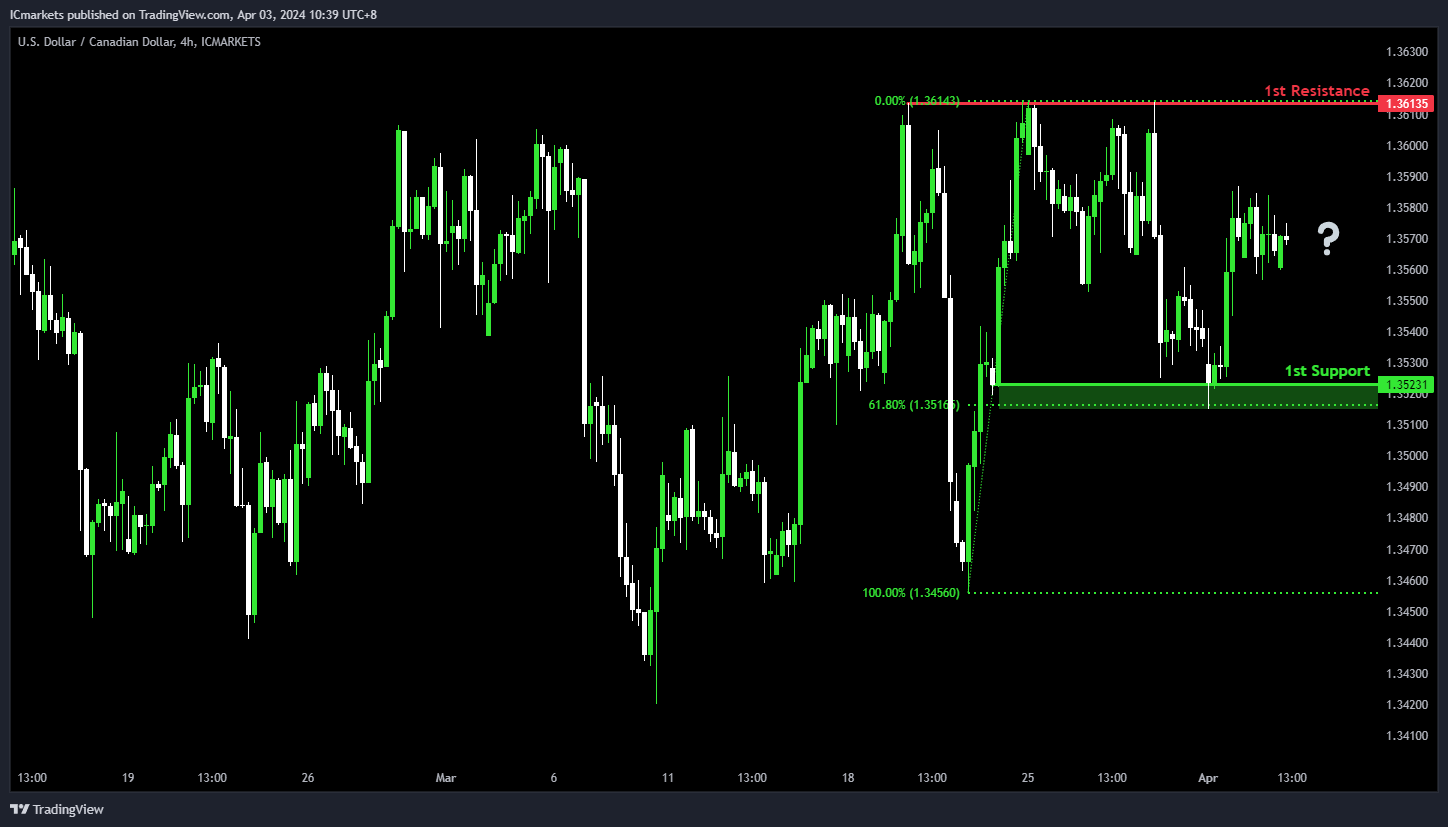
USD/CAD:
Potential Direction: Bearish
Overall momentum of the chart: Neutral
Price could potentially make a bearish drop towards the 1st support
1st support: 1.3523
Supporting reasons: Identified as a pullback support that aligns close to a 61.8% Fibonacci retracement level suggesting a significant area where the market has previously found strong buying interest, providing a foundation for potential price stabilization.
1st resistance: 1.3613
Supporting reasons: Identified as a multi-swing-high resistance, marking a significant barrier that could cap further upward movements.
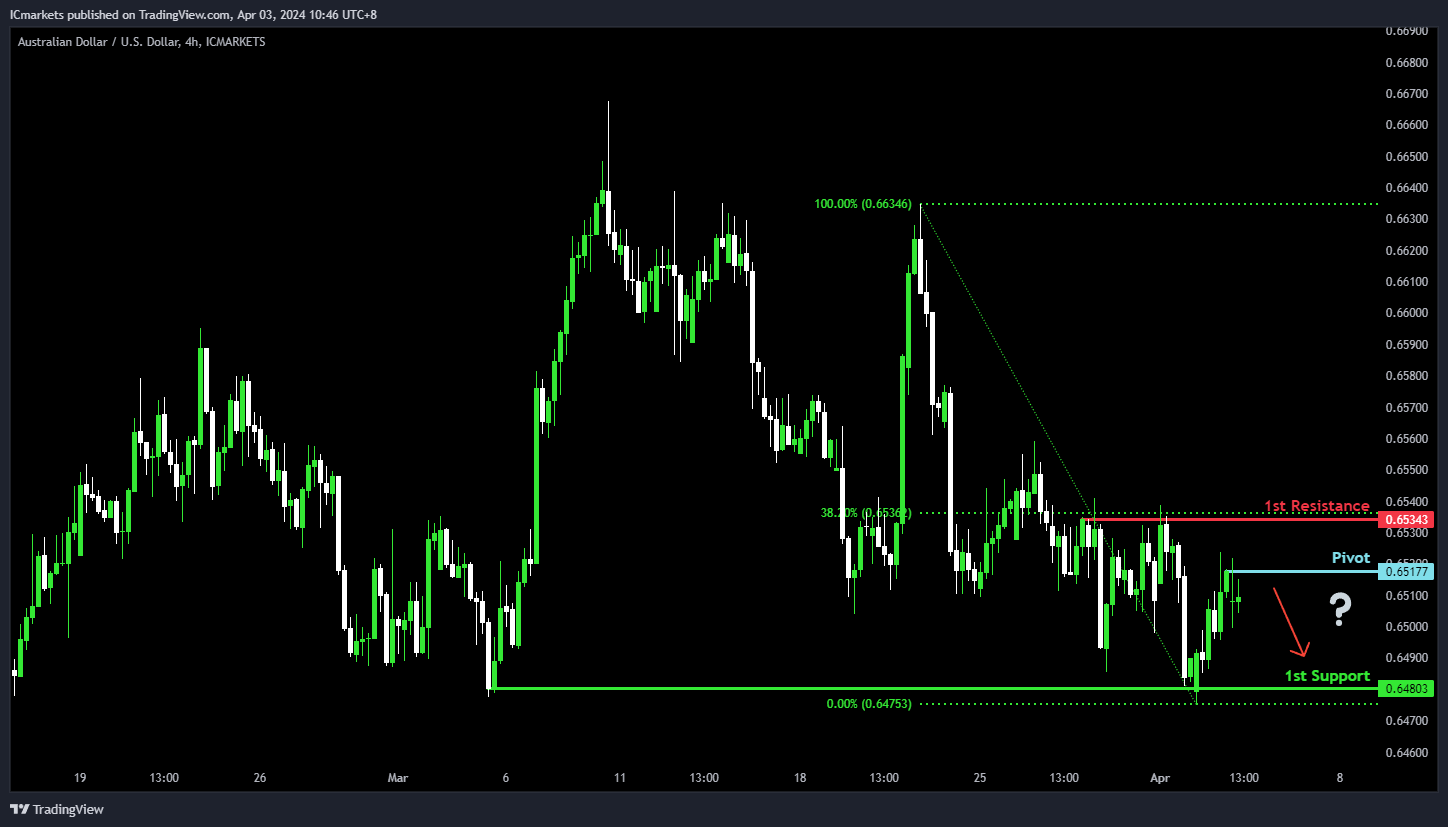
AUD/USD:
Potential Direction: Bearish
Overall momentum of the chart: Bearish
Price has reacted off the pivot and could potentially make a bearish drop towards the 1st support
Pivot: 0.6517
Supporting reasons: Acts as pullback resistance, suggesting a potential barrier against further upward movement.
1st support: 0.6480
Supporting reasons: Acts as a swing-low support, suggesting a significant area where price has previously found strong support, providing a basis for a potential price stabilization or a minor rebound.
1st resistance: 0.6534
Supporting reasons: Identified as a pullback resistance that aligns close to a 38.2% Fibonacci retracement level, marking a significant barrier that has previously capped upward movements.
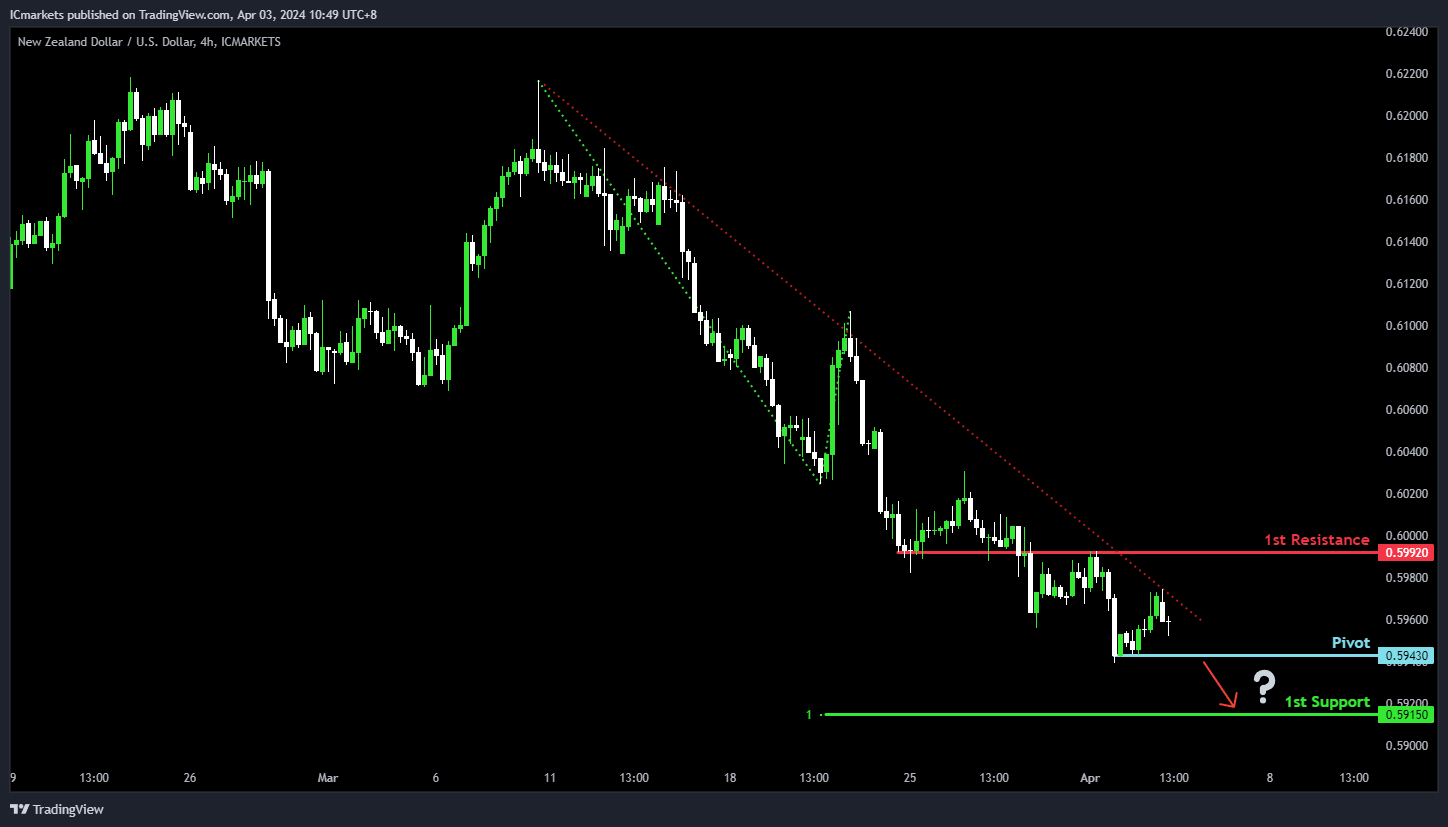
NZD/USD
Potential Direction: Bearish
Overall momentum of the chart: Bearish
Price could potentially make a bearish break below the pivot and drop to 1st support
Pivot: 0.5943
Supporting reasons: Acts as a pullback support where price could potentially break under to extend the bearish continuation.
1st support: 0.5915
Supporting reasons: Acts as a pullback support that aligns with a 100% Fibonacci projection level, suggesting a potential area for price stabilization or a minor rebound within the bearish context.
1st resistance: 0.5992
Supporting reasons: Identified as an overlap resistance, marking a significant barrier that could cap upward movements.
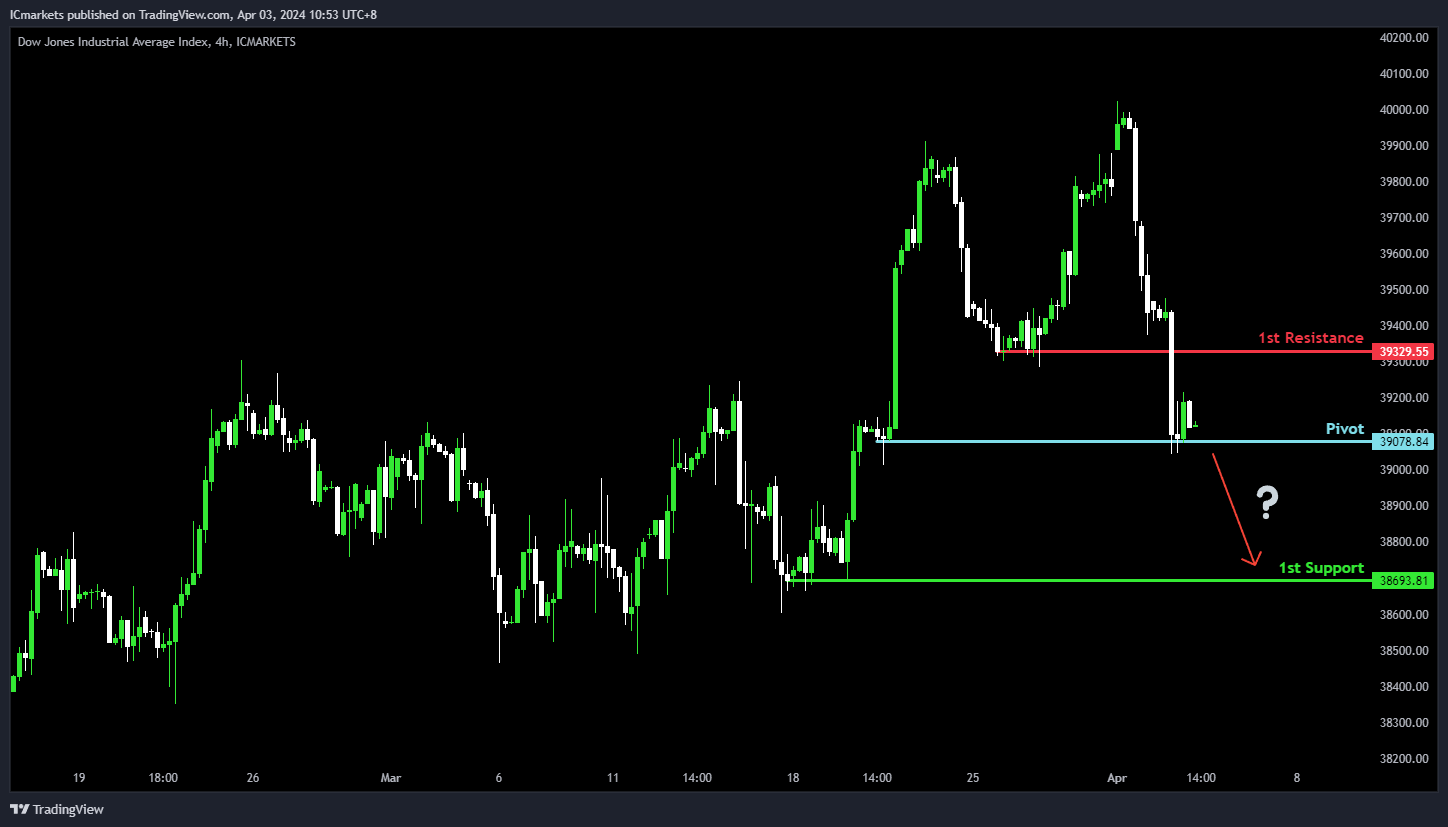
US30 (DJIA):
Potential Direction: Bearish
Overall momentum of the chart: Neutral
Price could potentially break below the pivot and make a bearish continuation towards the 1st support
Pivot: 39,078.84
Supporting reasons: Acts as a pullback support where price could potentially break under to extend the bearish continuation.
1st support: 38,693.81
Supporting reasons: Identified as a pullback support, suggesting a significant area where price has previously found strong buying interest and could provide a solid foundation for potential price stabilization or a rebound.
1st resistance: 39,329.55
Supporting reasons: Identified as a pullback resistance, indicating a potential barrier that could cap further upward movements.
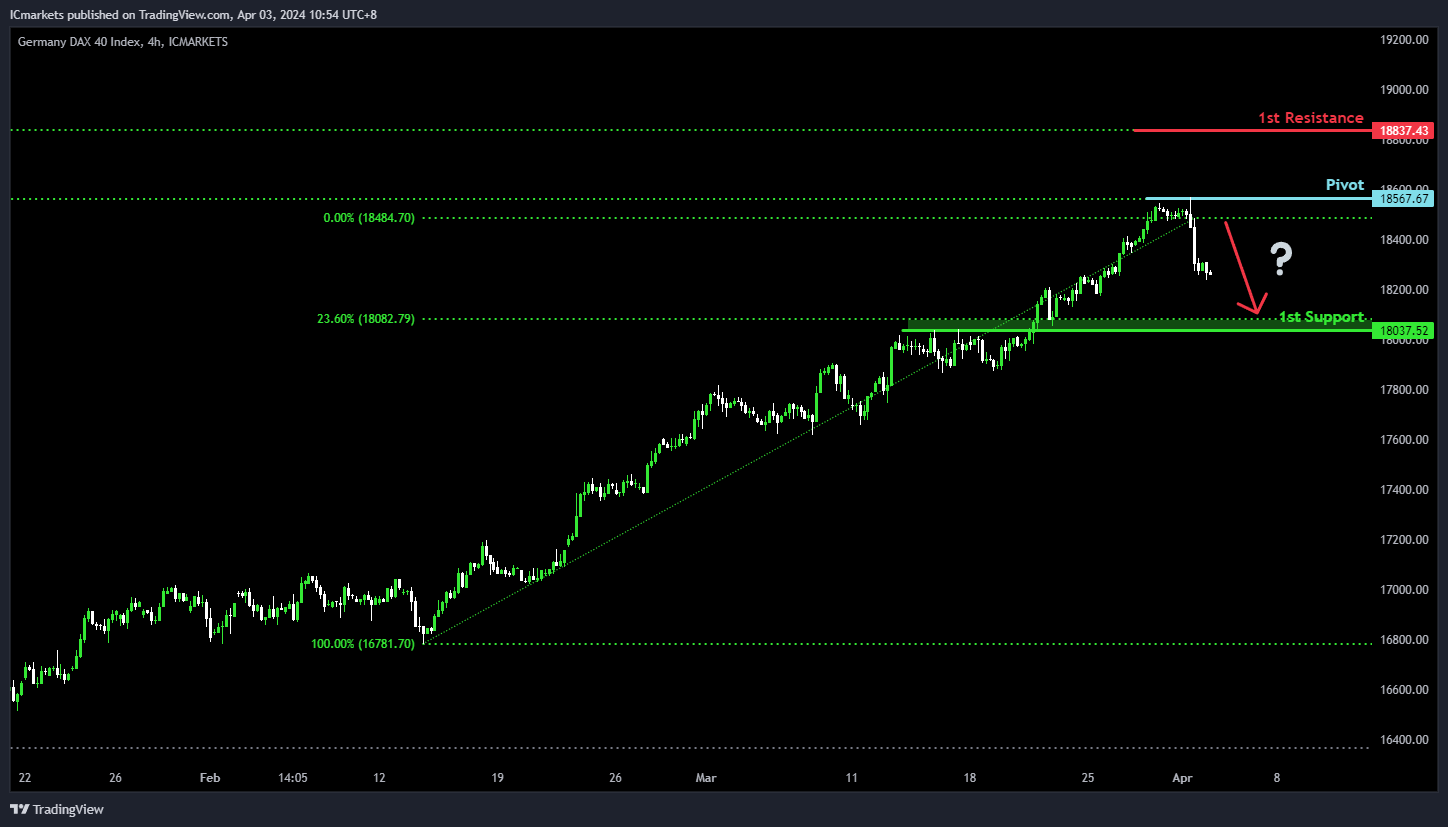
DE40 (DAX):
Potential Direction: Bearish
Overall momentum of the chart: Bullish
Price has made a bearish reaction off the pivot and could potentially drop towards the 1st support
Pivot: 18,567.67
Supporting reasons: Identified as a pullback resistance that aligns with a 78.6% Fibonacci projection level, suggesting a potential zone where price could face selling pressures and make a bearish reaction.
1st support: 18,037.52
Supporting reasons: Acts as an overlap support that aligns close to a 23.6% Fibonacci retracement level, suggesting a significant area where price has previously found strong buying interest and could provice a solid foundation for a potential price stabilization or a rebound.
1st resistance: 18,837.43
Supporting reasons: Marked by a 100% Fibonacci Projection, indicating a significant barrier that could cap further upward movements. Overcoming this level would underscore the strength of the bullish momentum.
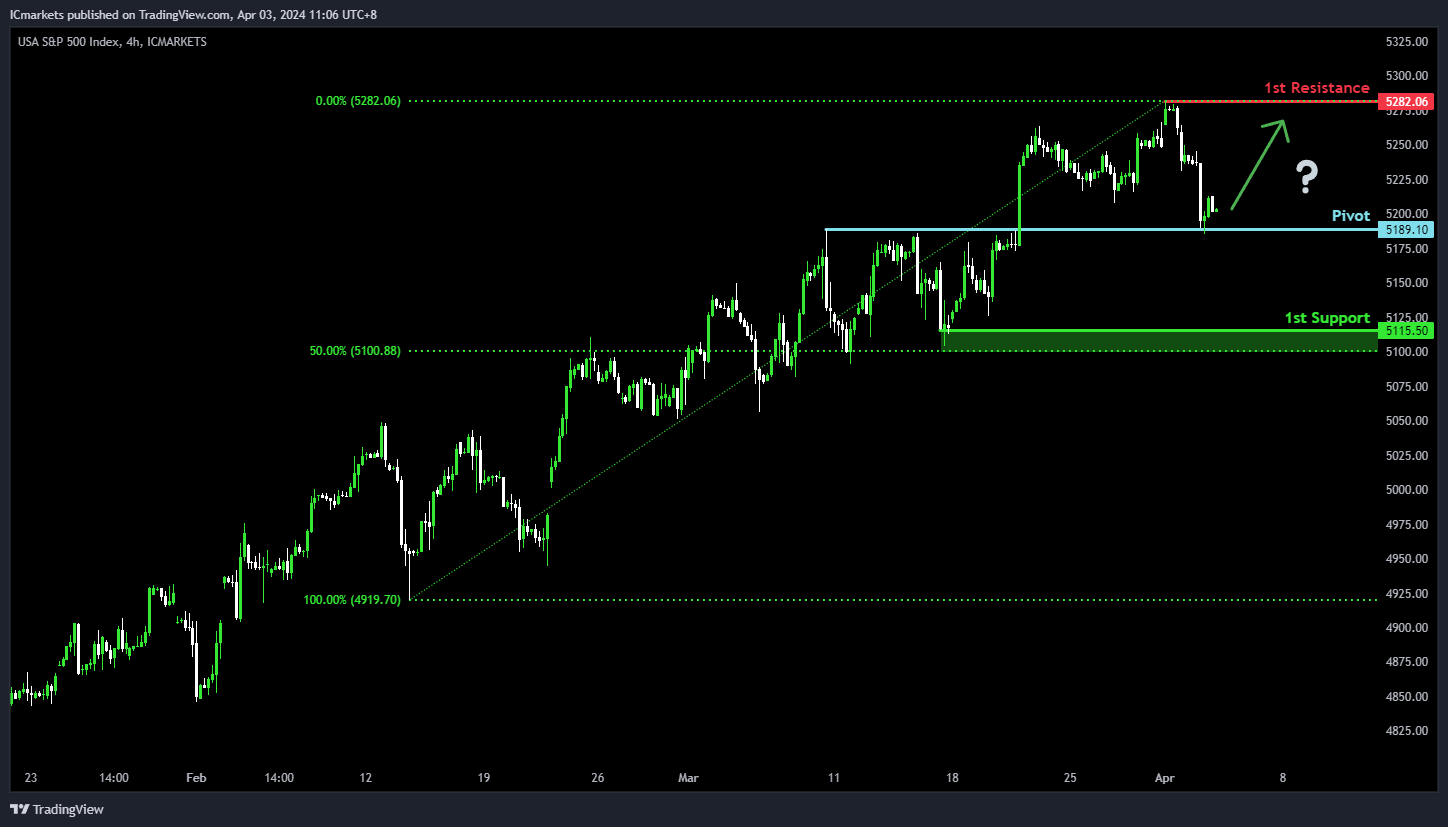
US500 (S&P 500):
Potential Direction: Bullish
Overall momentum of the chart: Neutral
Price could potentially make a bullish bounce and rise towards the 1st resistance
Pivot: 5,189.10
Supporting reasons: Acts as an overlap support where buying interest could be strong, suggesting a solid foundation for a potential price stabilization or a rebound.
1st support: 5,115.50
Supporting reasons: Acts as a pullback support that aligns close to a 50% Fibonacci retracement level suggesting a significant area where price has previously found strong buying interest, providing a solid foundation should price beyond the pivot.
1st resistance: 5,282.06
Supporting reasons: Marked by a pullback resistance at the all-time high, indicating a significant barrier that could cap further upward movements.
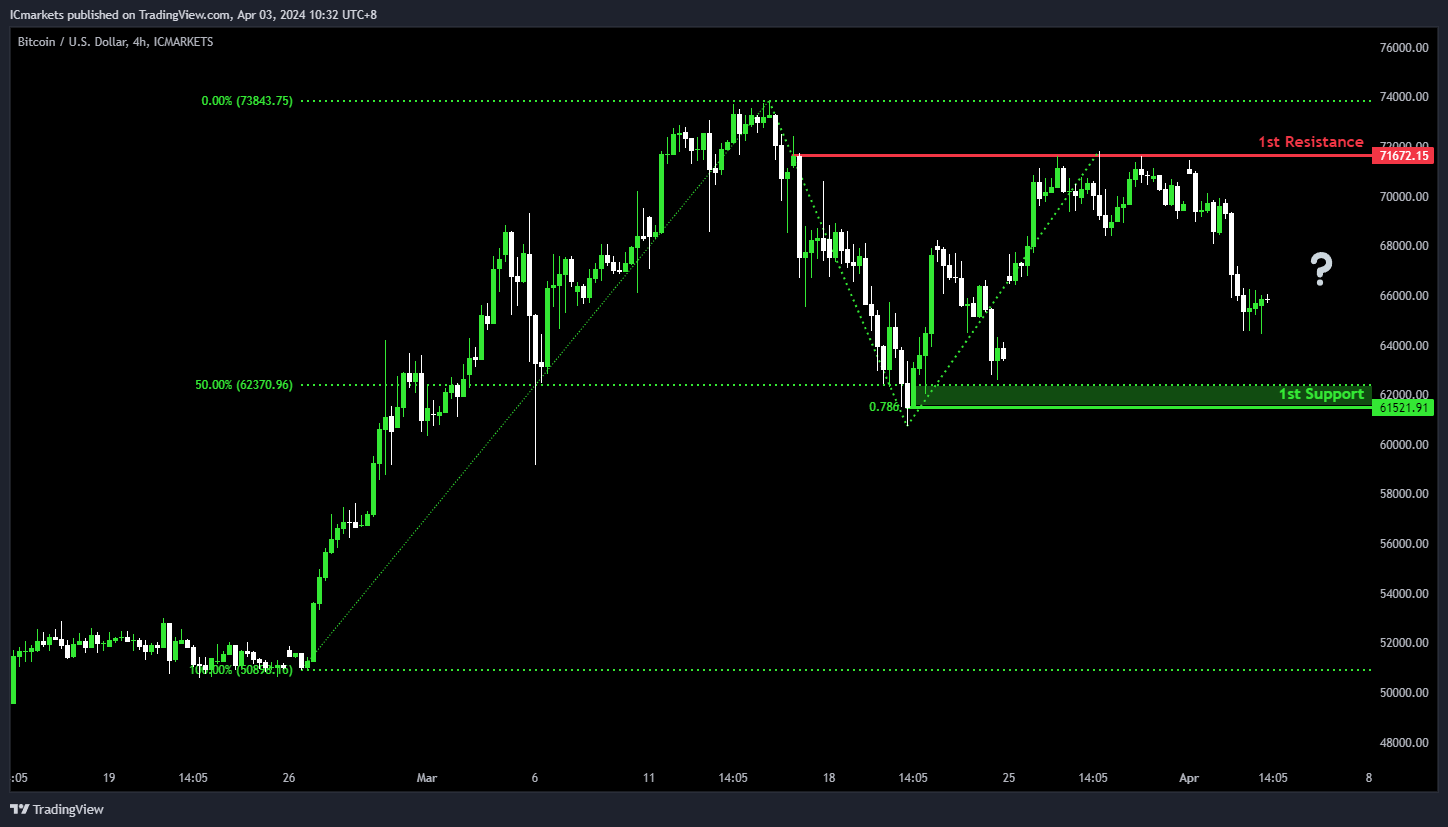
BTC/USD (Bitcoin):
Potential Direction: Bearish
Overall momentum of the chart: Neutral
Price could potentially make a bearish continuation towards the 1st support
1st support: 61,521.91
Supporting reasons: Acts as a swing-low support that aligns with a confluence of Fibonacci levels i.e. a 50% retracement and a 78.6% projection levels, suggesting a significant area where price has previously found strong buying interest and could provide a solid foundation for potential price stabilization or a rebound in the event of a pullback.
1st resistance: 71,672.15
Supporting reasons: Marked by a pullback resistance, indicating a significant barrier that could cap further upward movements.
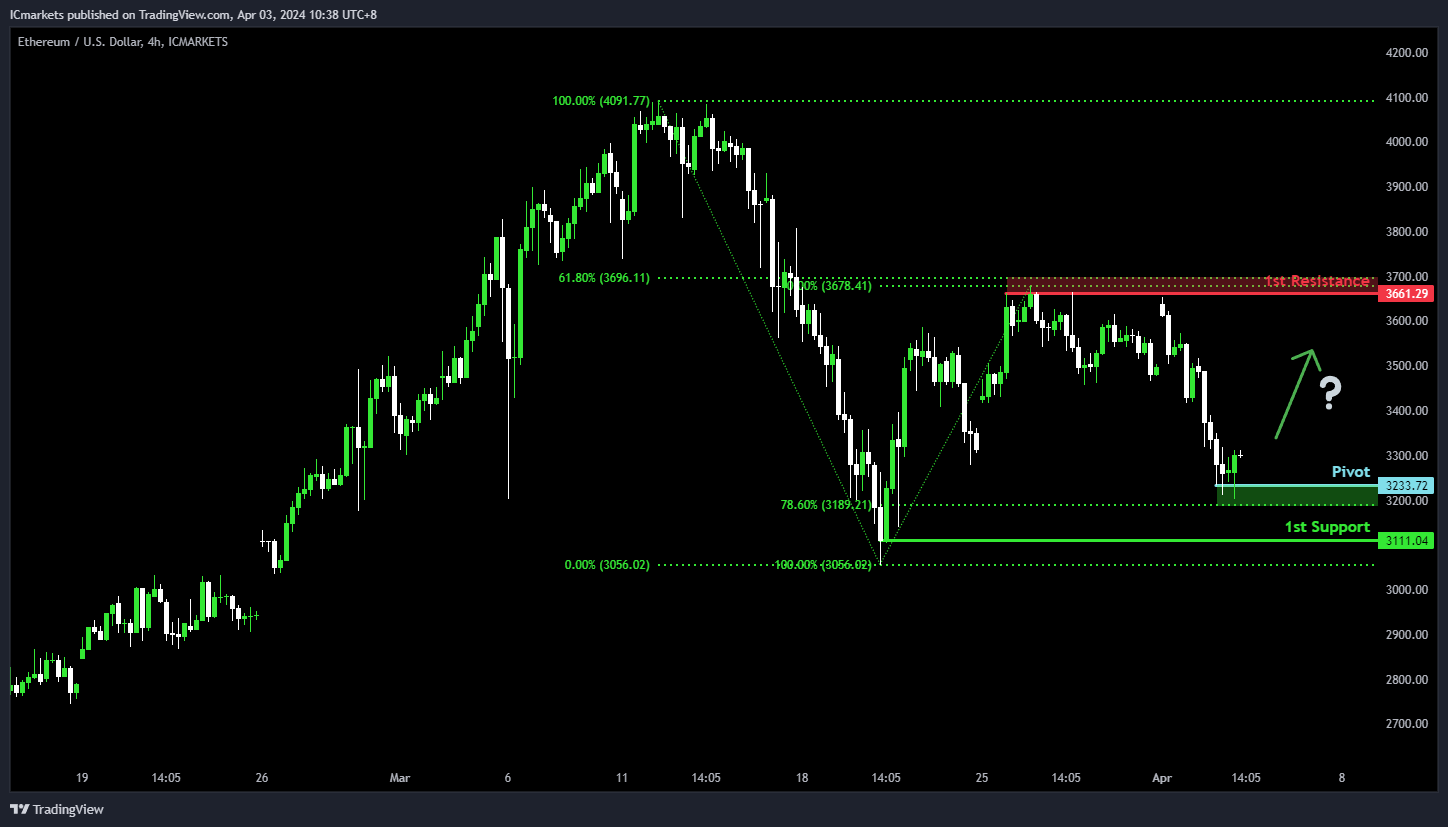
ETH/USD (Ethereum):
Potential Direction: Bullish
Overall momentum of the chart: Neutral
Price could potentially make a bullish bounce off the pivot and rise towards the 1st resistance
Pivot: 3,233.72
Supporting reasons: Acts as a pullback support that aligns close to a 78.6% Fibonacci retracement level indicating a key level where buying interest has historically been strong, suggesting a solid foundation for a potential price stabilization or a rebound.
1st support: 3,111.04
Supporting reasons: Identified as a swing-low support suggesting a significant area where price has previously found support, providing a strong foundation for further downward movements.
1st resistance: 3,661.29
Supporting reasons: Identified as a pullback resistance that aligns close to a 61.8% Fibonacci retracement level, marking a significant barrier that has previously capped upward movements.
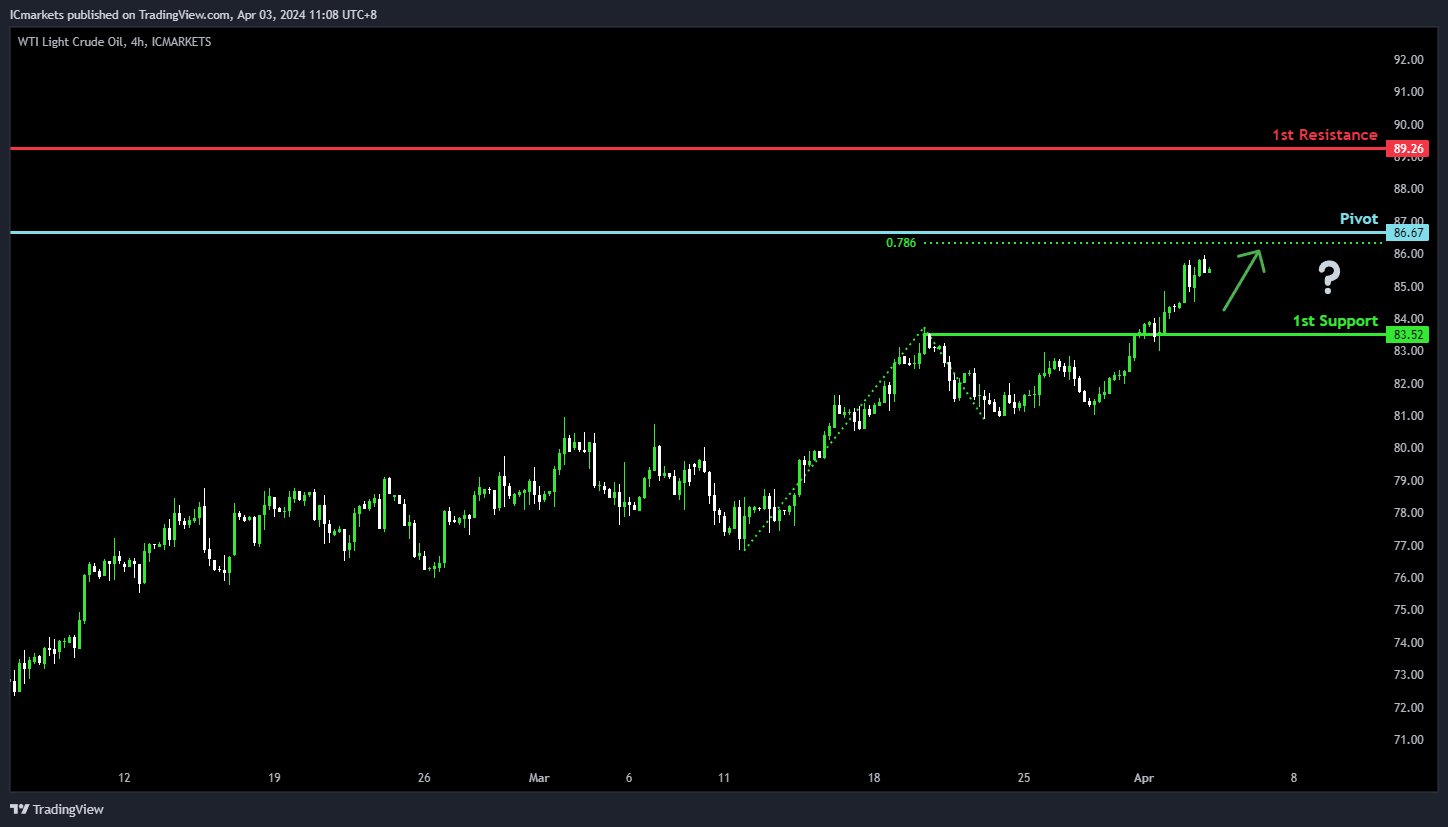
WTI/USD (Oil):
Potential Direction: Bullish
Overall momentum of the chart: Bullish
Price could potentially make a bullish continuation towards the pivot and stall around this region
Pivot: 86.67
Supporting reasons: Marked by an overlap resistance that aligns close to a 78.6% Fibonacci projection level, indicating a significant level where selling pressure might intensify.
1st support: 83.52
Supporting reasons: Identified as an overlap support, suggesting a significant area where price has previously found strong buying interest and could provide a solid foundation for potential price stabilization or a rebound.
1st resistance: 89.26
Supporting reasons: Identified as a pullback resistance, marking a significant barrier that could cap further upward movements.
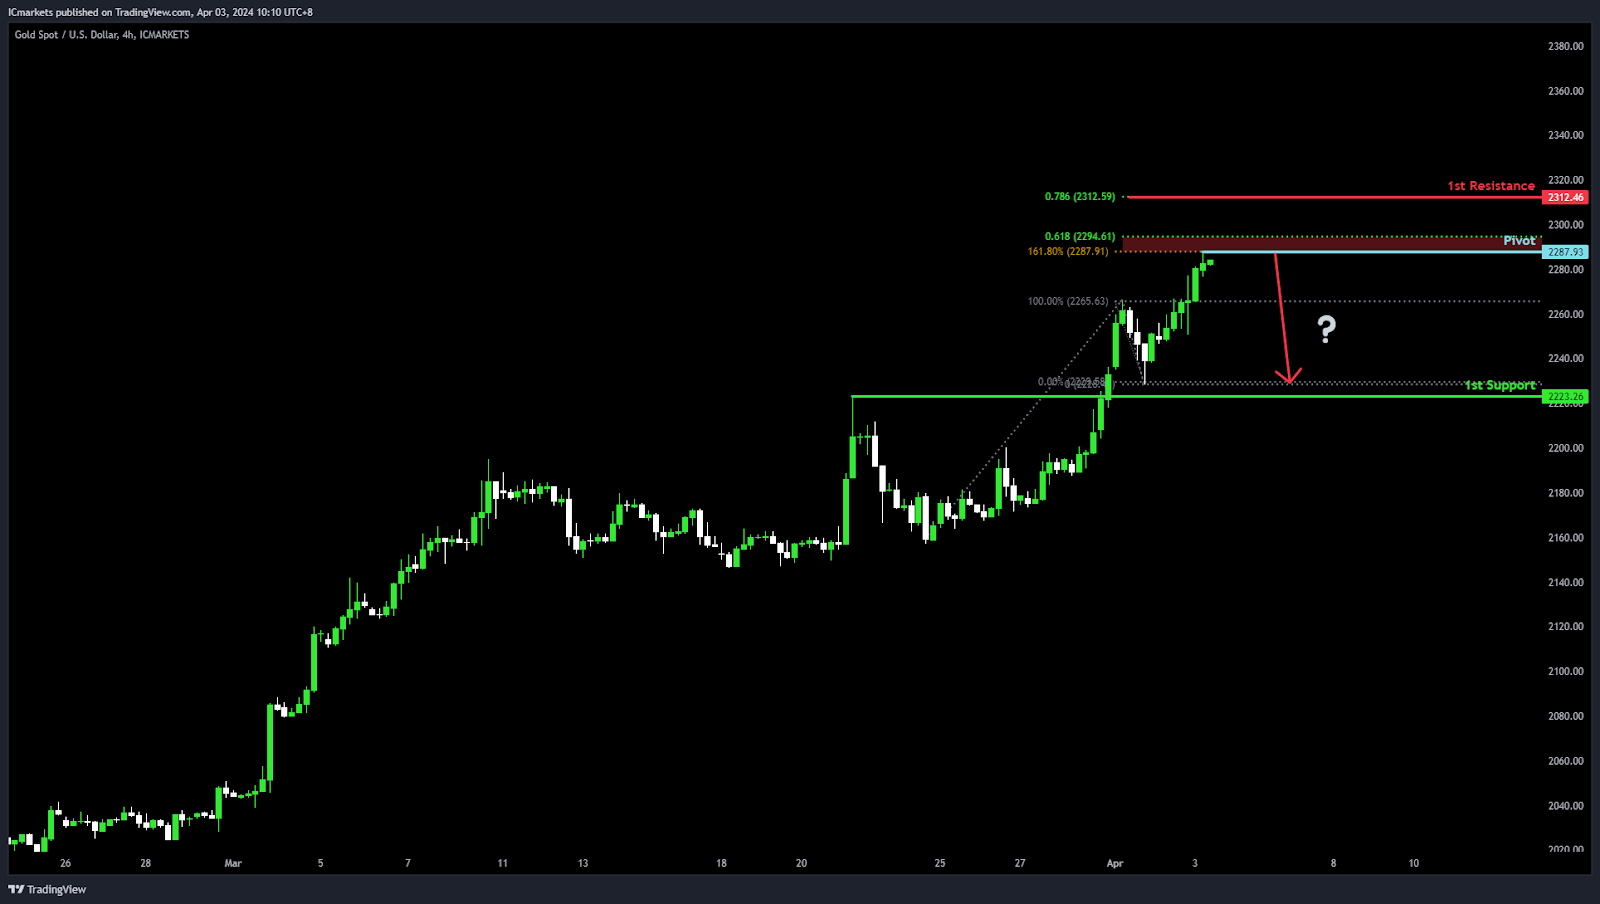
XAU/USD (GOLD):
Potential Direction: Bearish
Overall momentum of the chart: Bullish
Price could potentially make a: Bearish continuation towards 1st support
Pivot: 2287.93
Supporting reasons: Acts as Swing high resistance with a 161.80% Fibonacci Extension and a 61.80% Fibonacci Projection, indicating a significant level where selling pressure might intensify, suggesting a potential turning point for the price to continue its downward movement within the context of an overall bullish trend.
1st support: 2223.26
Supporting reasons: Known as Pullback support, suggesting a significant area where the market has previously found support, providing a foundation for potential price stabilization or a minor rebound within the bearish movement.
1st resistance: 2312.46
Supporting reasons: Marked by a 78.60% Fibonacci Projection, indicating a significant barrier that could cap upward movements.
The accuracy, completeness and timeliness of the information contained on this site cannot be guaranteed. IC Markets does not warranty, guarantee or make any representations, or assume any liability regarding financial results based on the use of the information in the site.
News, views, opinions, recommendations and other information obtained from sources outside of www.icmarkets.com, used in this site are believed to be reliable, but we cannot guarantee their accuracy or completeness. All such information is subject to change at any time without notice. IC Markets assumes no responsibility for the content of any linked site.
The fact that such links may exist does not indicate approval or endorsement of any material contained on any linked site. IC Markets is not liable for any harm caused by the transmission, through accessing the services or information on this site, of a computer virus, or other computer code or programming device that might be used to access, delete, damage, disable, disrupt or otherwise impede in any manner, the operation of the site or of any user’s software, hardware, data or property.


