
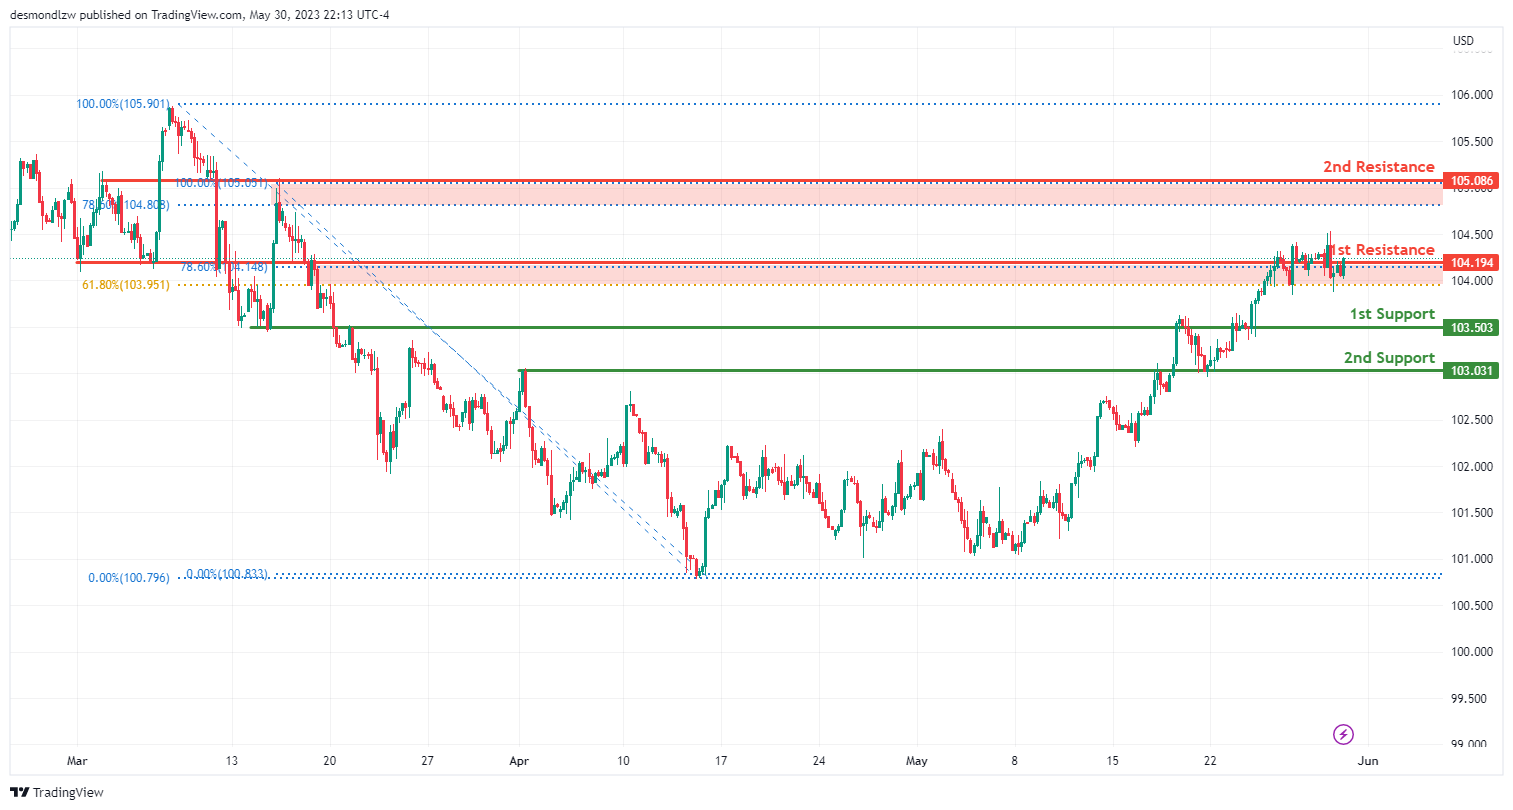
DXY:
The Dollar Index (DXY) currently shows bullish momentum with potential for a bullish breakthrough of the first resistance, possibly rising to the second resistance. The first support level is at 103.50, serving as an overlap support. A second support level stands at 103.03, also recognized as an overlap support. On the resistance side, the first resistance level is at 104.19. This pullback resistance level aligns with both 61.80% and 78.60% Fibonacci retracements, a scenario known as Fibonacci confluence. Further, the second resistance level is at 105.08, serving as an overlap resistance and the 78.60% Fibonacci retracement level.
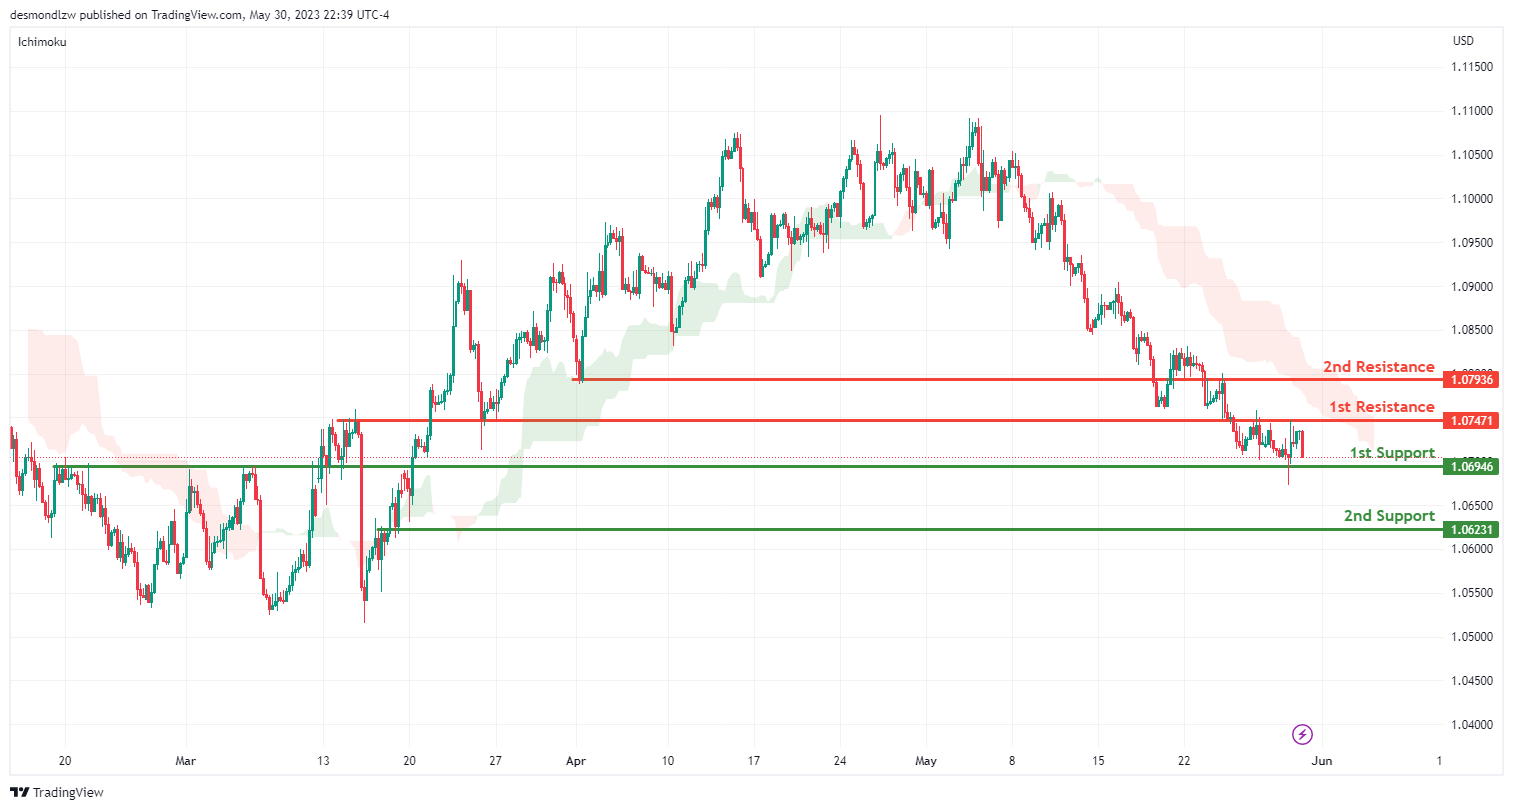
EUR/USD:
The EUR/USD pair is currently showing bearish momentum, with the price being below the bearish Ichimoku cloud contributing to this momentum. The price could potentially make a bearish break off the first support and drop towards the second support.
The first support is at 1.0694 and is deemed favorable due to it being an overlap support. The second support is at 1.0623 and is also an overlap support, making it a significant level to monitor.
On the flip side, the first resistance level is at 1.0747, acting as an overlap resistance. This might pose challenges to any potential upward price movement. Similarly, the second resistance is at 1.0793, which is another overlap resistance that could potentially prevent the price from rising further.
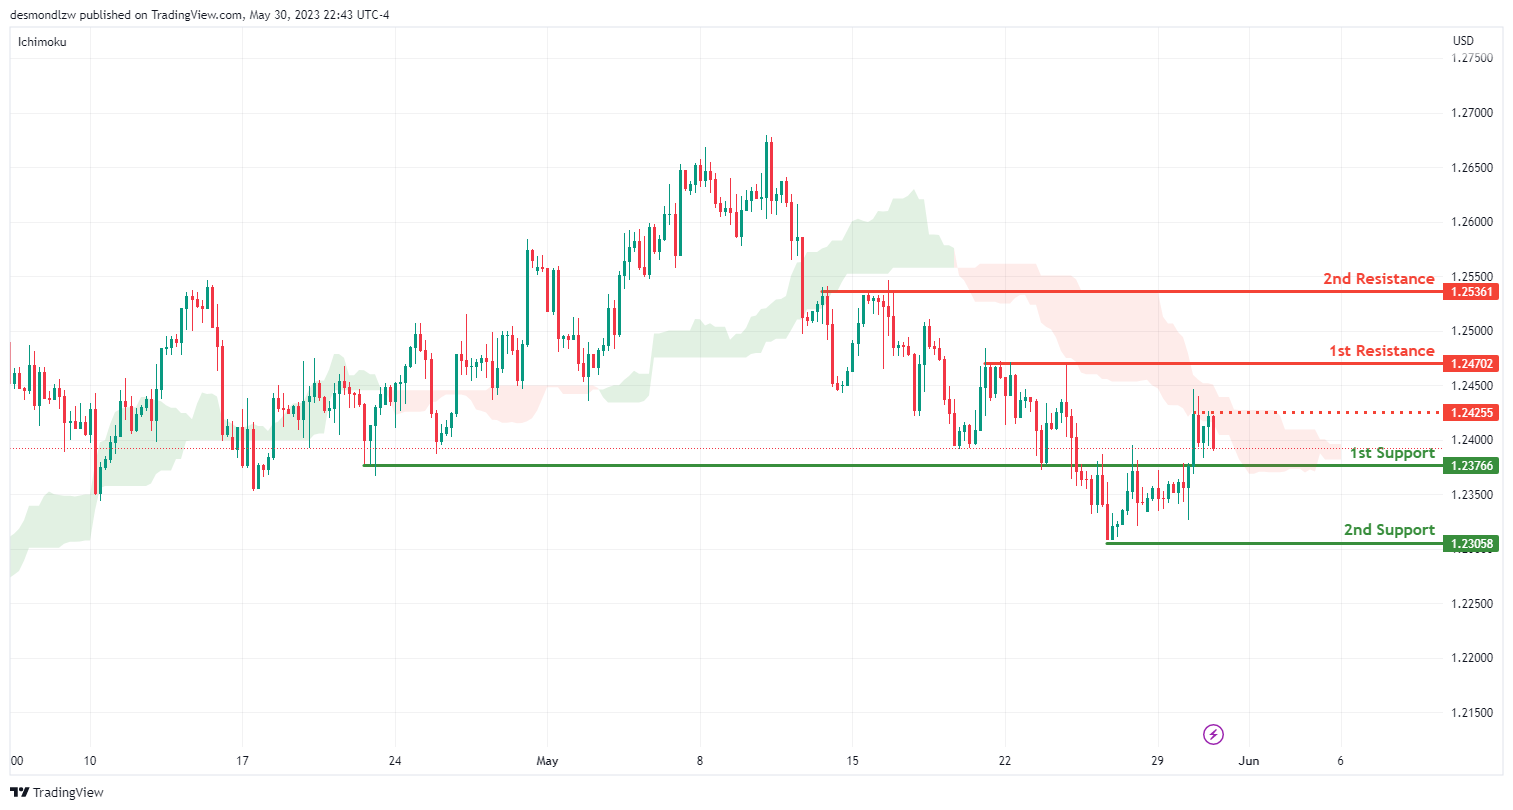
GBP/USD:
The GBP/USD pair is currently showing bearish momentum, with the price being below the bearish Ichimoku cloud contributing to this downward momentum. The price might potentially follow a bearish continuation towards the first support.
The first support is at 1.2376, which is an overlap support, a level significant in the market structure. The second support is at 1.2305 and acts as a swing low support, which could potentially attract buyers in the market.
In contrast, the first resistance level is at 1.2470. This level serves as a multi-swing high resistance and could potentially pose challenges to any potential upward price movement. Similarly, the second resistance is at 1.2536, which also serves as a multi-swing high resistance and might prevent the price from rising further.
Moreover, there’s an intermediate resistance level at 1.2425, representing another multi-swing high resistance, suggesting that it could act as a significant barrier to price increases.
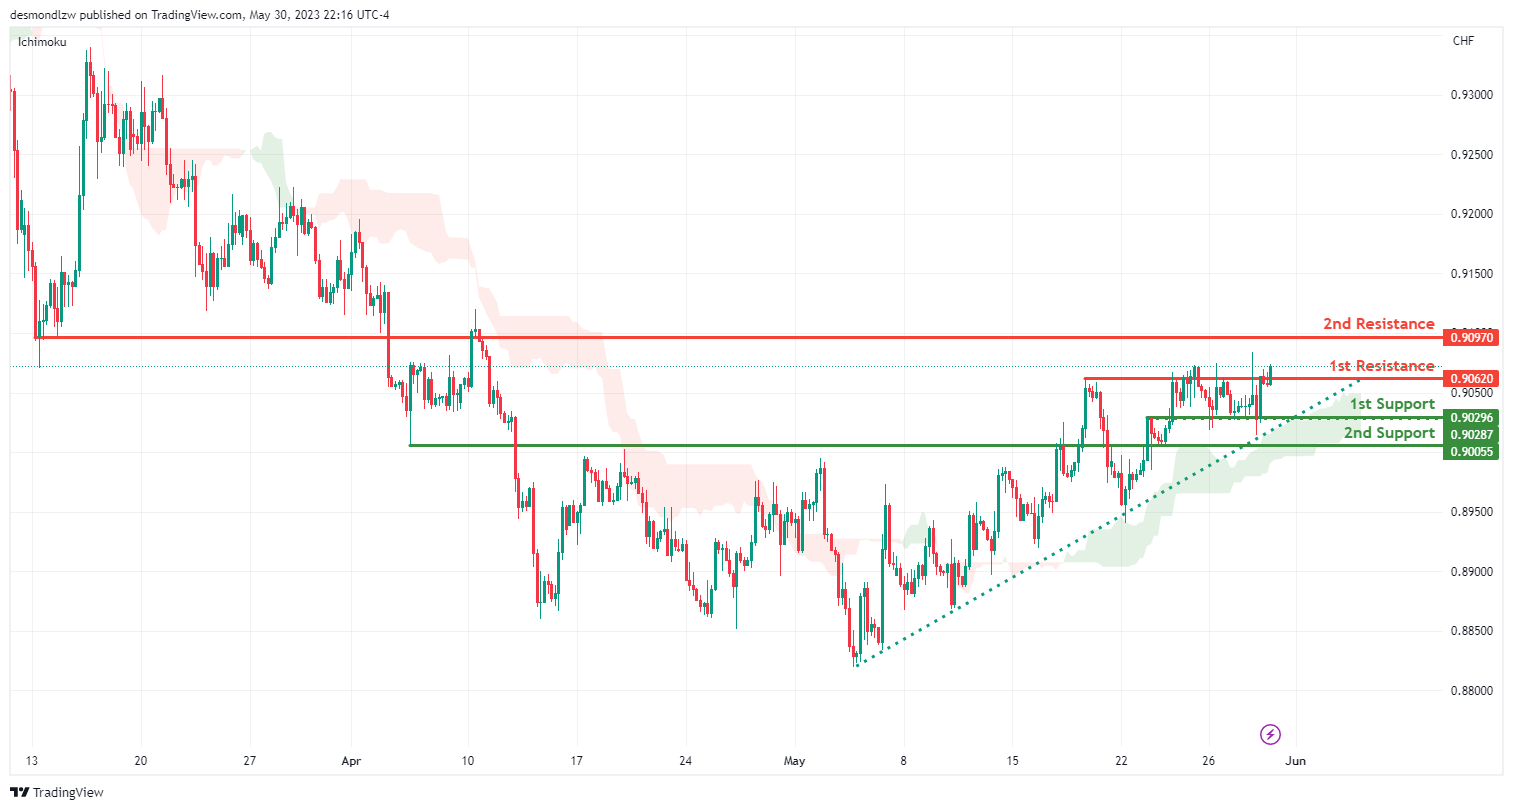
USD/CHF:
The USD/CHF pair is currently demonstrating strong bullish momentum with high confidence. The price being above the bullish Ichimoku cloud and a significant ascending trendline suggests further bullish momentum could be anticipated.
The first level of support is at 0.9029. This point serves as an overlap support, which could potentially attract buyers into the market, preventing the price from falling further.
If the price breaks below this level, the second line of support is at 0.9005. This level is an overlap support and could serve as a strong buy zone to prevent the price from declining further.
On the upside, the first resistance level is at 0.9062, acting as a multi-swing high resistance. If the bullish momentum continues, and the price manages to break above this resistance, further upward movement could be expected.
The second resistance is located at 0.9097, serving as an overlap resistance. This resistance might be significant, as sellers previously found this level attractive enough to cause a price reversal.
USD/JPY:
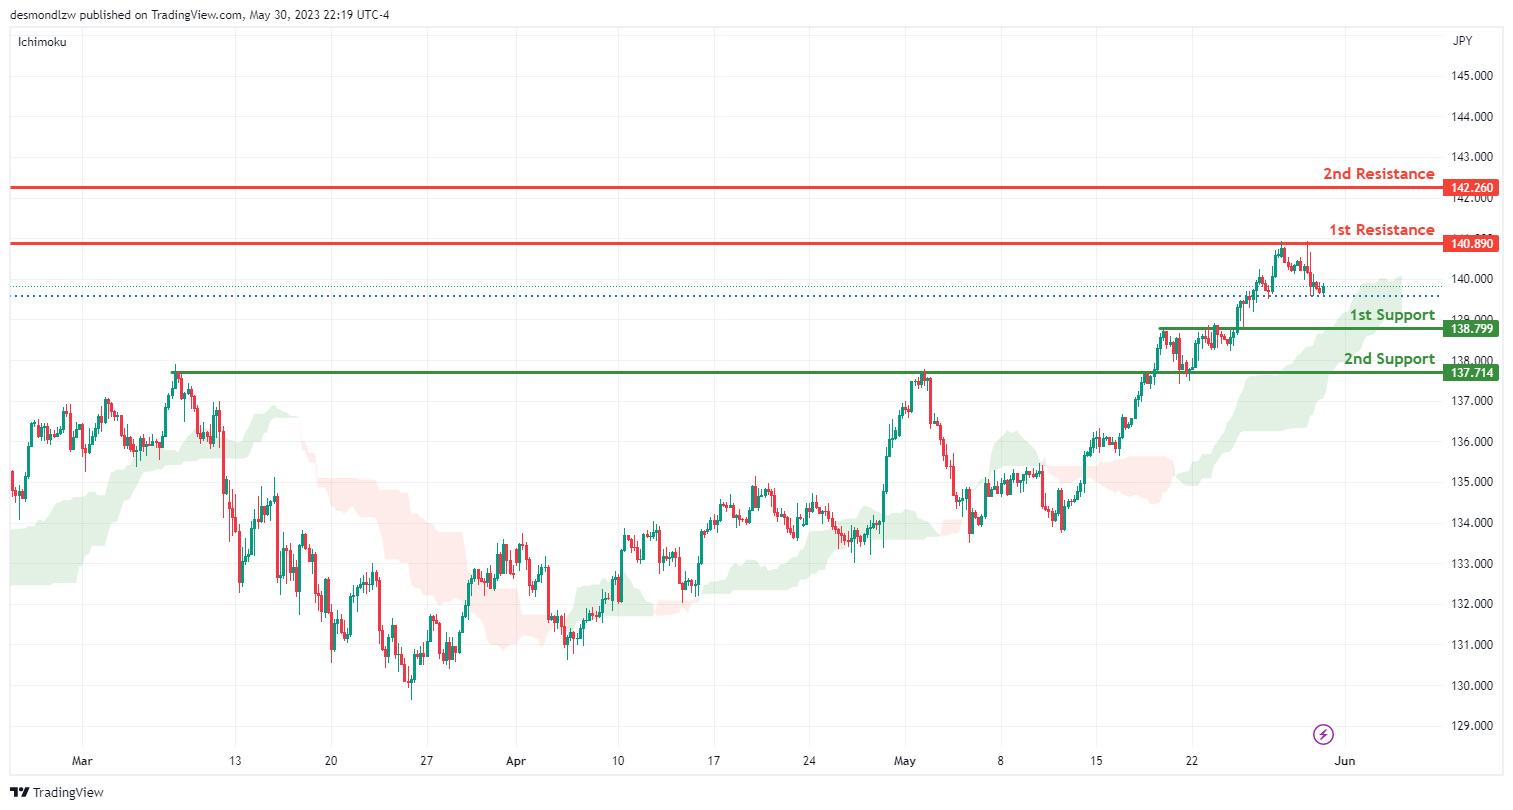
The USD/JPY pair is currently demonstrating bullish momentum, with the price being above the bullish Ichimoku cloud indicating further bullish momentum could be anticipated.
In the short term, the price might drop further towards the first support level at 138.79. This point, serving as an overlap support, could attract buyers into the market, preventing the price from falling further and potentially instigating a bullish bounce.
If the price breaks below this level, the second line of support is at 137.71. This level is also an overlap support, and could serve as a strong buy zone to prevent the price from declining further.
On the upside, the first resistance level is at 140.89, acting as a pullback resistance. If the bullish momentum continues and the price manages to bounce off the support and break above this resistance, further upward movement could be expected.
The second resistance is located at 142.26, serving as a swing high resistance. This resistance might be significant, as sellers previously found this level attractive enough to cause a price reversal.
USD/CAD:
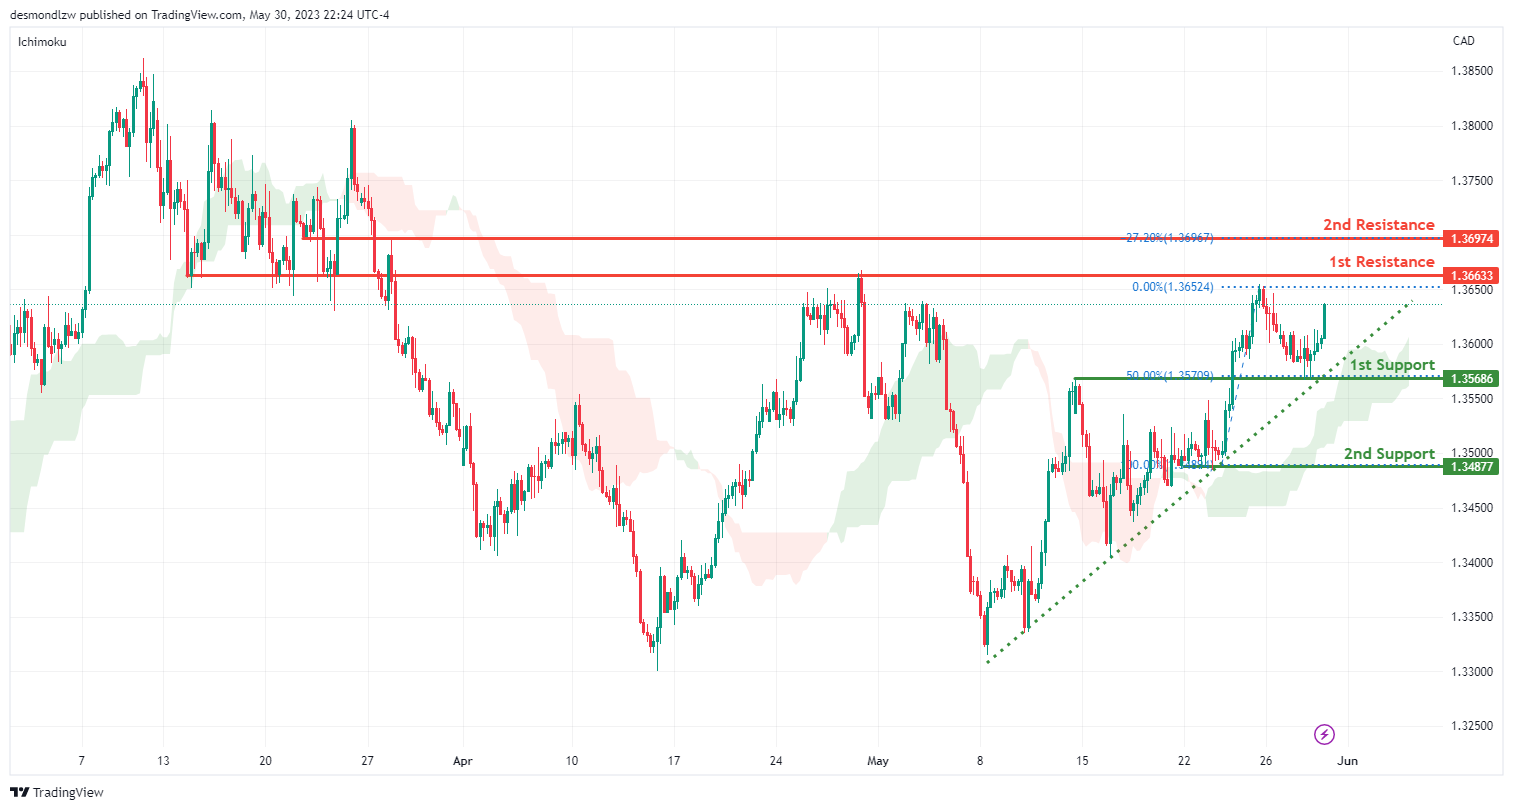
The USD/CAD chart currently shows a bullish trend, supported by the price being above the bullish Ichimoku cloud and a major ascending trendline, indicating potential for further bullish momentum.
The first support level is at 1.3568, characterized as an overlap support and aligns with the 50% Fibonacci retracement level, indicating its significance. The second support level is at 1.3487, which is identified as a multi-swing low support, bolstering its potential to uphold price movements.
There’s a likelihood for a bullish continuation towards the first resistance level at 1.3663, which serves as an overlap resistance. The second resistance level at 1.3697 is also characterized as an overlap resistance and corresponds to the -27% Fibonacci expansion, further reinforcing its potential as a resistance area.
AUD/USD:
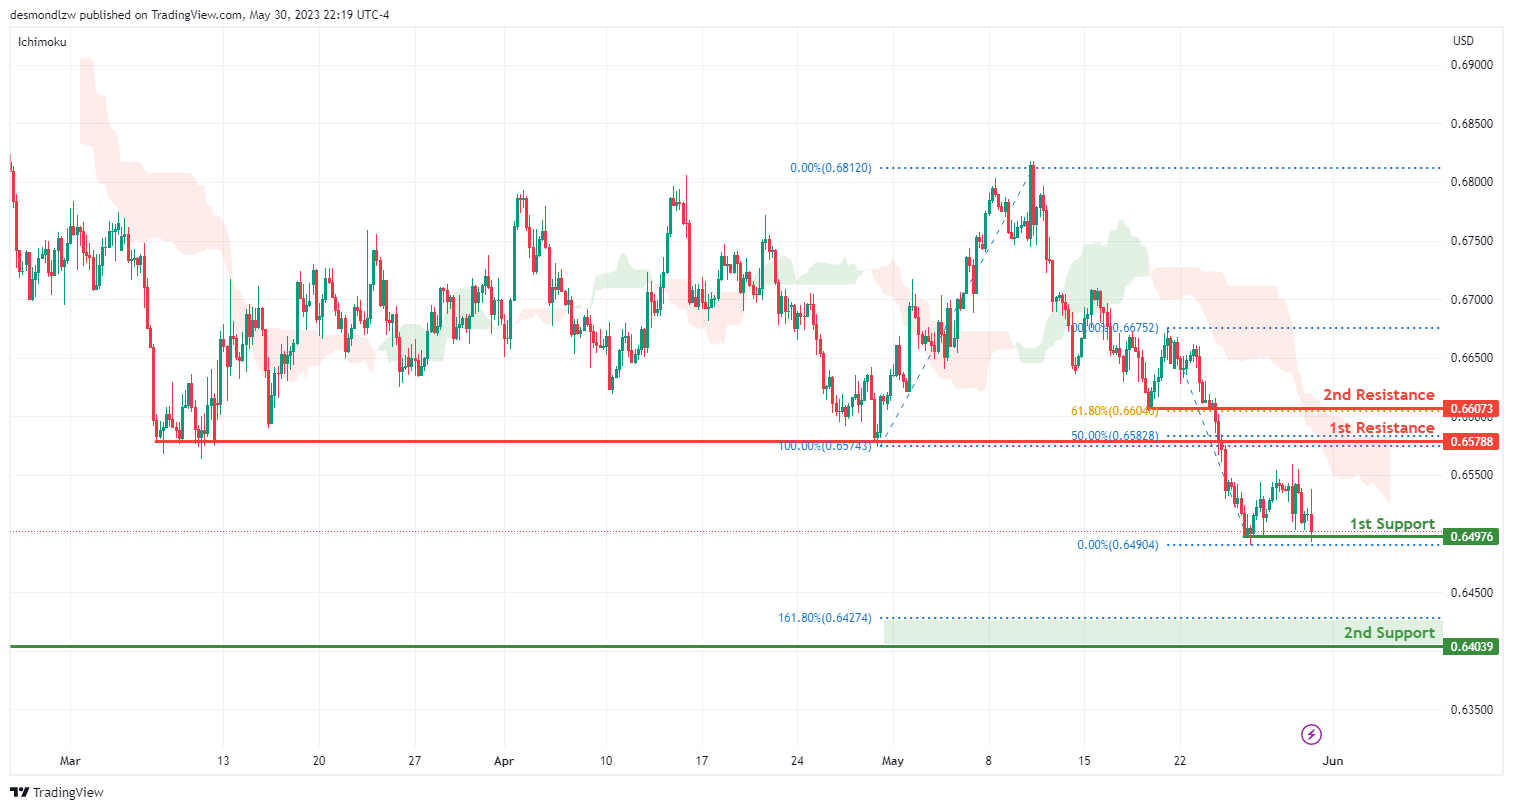
The AUD/USD chart currently displays a bearish trend, indicated by the price being below a major descending trend line and the bearish Ichimoku cloud, suggesting possible continuation of the bearish momentum.
The first support level is at 0.6497, identified as a multi-swing low support, suggesting it could act as a floor for price movements. The second support level at 0.6403, defined as a swing low support, is also of note due to its alignment with the 161.80% Fibonacci extension, further reinforcing its potential as a support area.
There’s a potential for a bearish break off the first support and a drop towards the second support. If a reversal happens, the first resistance level to consider is at 0.6578, which serves as a pullback resistance and aligns with the 50% Fibonacci retracement. The second resistance at 0.6607, defined as an overlap resistance, aligns with the 61.80% Fibonacci retracement, reinforcing its potential to limit upward movements.
NZD/USD
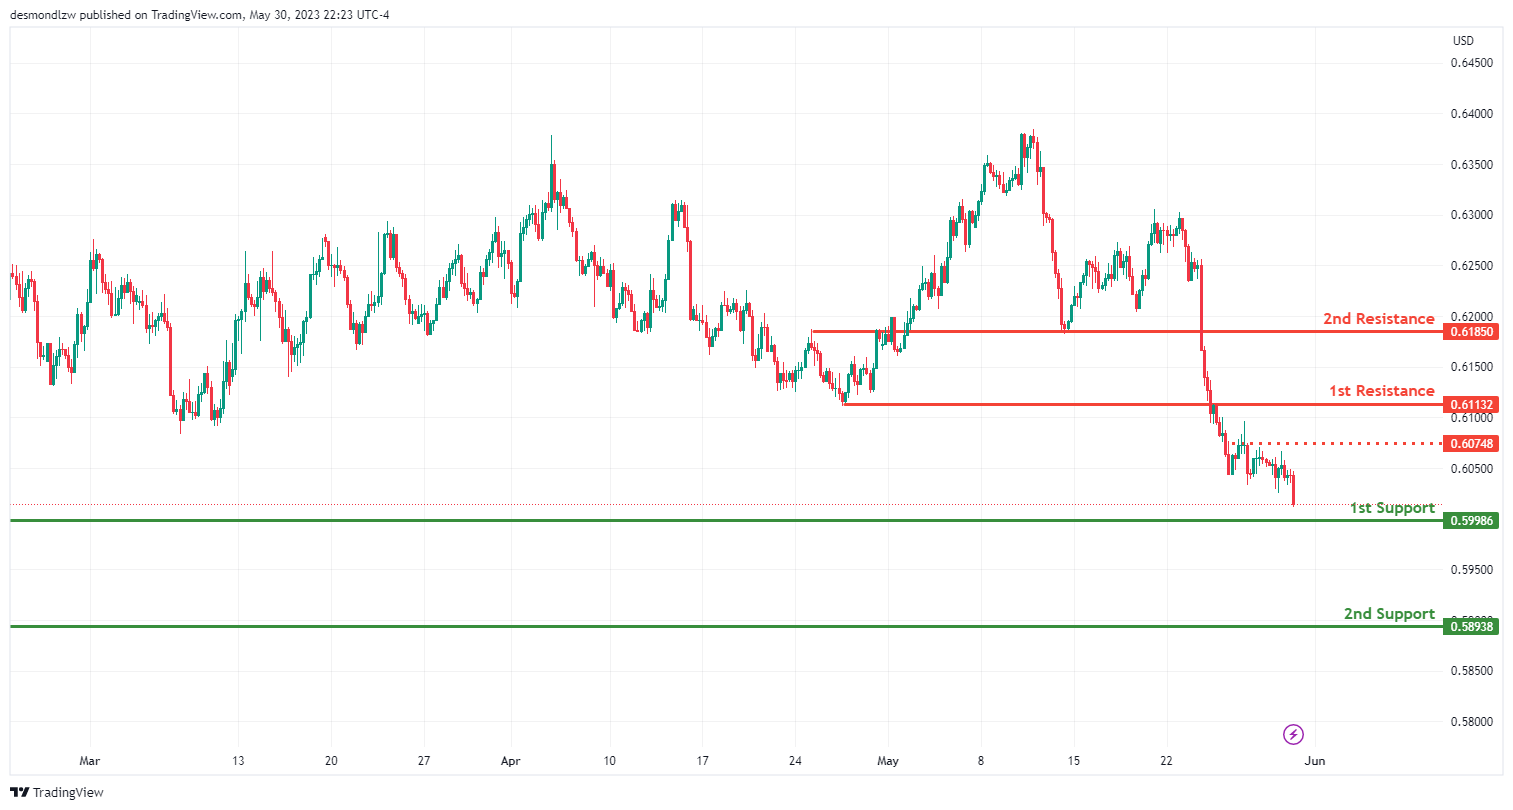
The NZD/USD chart currently exhibits a bearish momentum, suggesting a potential continuation of the downward trend.
The first support level is at 0.5998, identified as a pullback support, which could act as a floor for price movements. The second support level is at 0.5893, also recognized as a pullback support, further reinforcing its potential as a support area.
In the scenario of a bearish continuation, the price might move towards the first support. However, if a reversal occurs, the first resistance level to consider is at 0.6113, which serves as a pullback resistance. There’s also an intermediate resistance level at 0.6078, identified as a pullback resistance, which could potentially act as a barrier for price movements. The second resistance level is at 0.6185, also recognized as a pullback resistance, further adding strength to its potential as a price ceiling.
DJ30:
The DJ30 chart is currently exhibiting a bearish momentum, suggesting a potential continuation of the downward trend.
The first support level is at 32945.92, identified as a pullback support, which aligns with the 50% Fibonacci retracement level. This implies that the level may serve as a significant area where buyers could enter the market.
The second support level is at 32711.64, identified as a multi-swing low support, which aligns with the 78.60% Fibonacci retracement level, further supporting its potential as a strong floor for price movements.
In the scenario of a bearish continuation, the price might break off the first support and drop towards the second support.
On the flip side, if a reversal occurs, the first resistance level to watch is 33227.44, an overlap resistance. The second resistance level is at 33458.57, also recognized as an overlap resistance and aligns with the 78.60% Fibonacci retracement level, providing a significant potential price ceiling.
GER30:
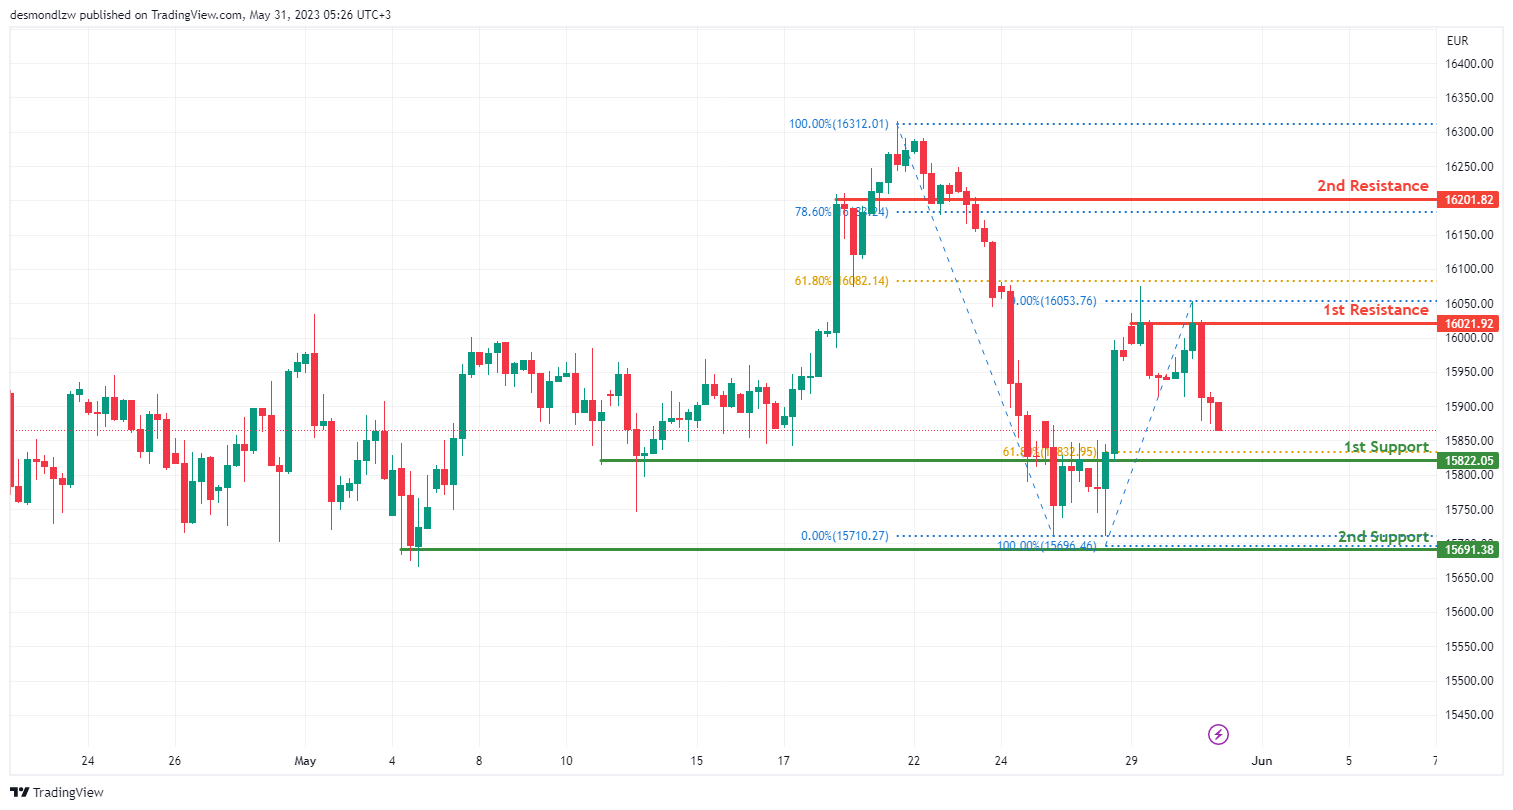
The GER30 chart is currently exhibiting a bearish momentum, indicating a potential continuation of the downward trend.
The first support level at 15822.05 serves as a significant area of pullback support, aligning with the 61.80% Fibonacci retracement level. This level has historical significance, serving as a potential floor for price movements.
The second support level at 15691.38 is identified as a multi-swing low support, further reinforcing its potential as a key support area.
In the event of a bearish continuation, the price might move towards these support levels.
On the resistance side, the first resistance level at 16021.92 is a multi-swing high resistance. This could act as a temporary ceiling to price movements, potentially causing a pause or retracement in the bearish trend.
The second resistance level at 18201.82 is identified as an overlap resistance and aligns with the 78.60% Fibonacci retracement, adding further credibility to its potential as a resistance area.
US500
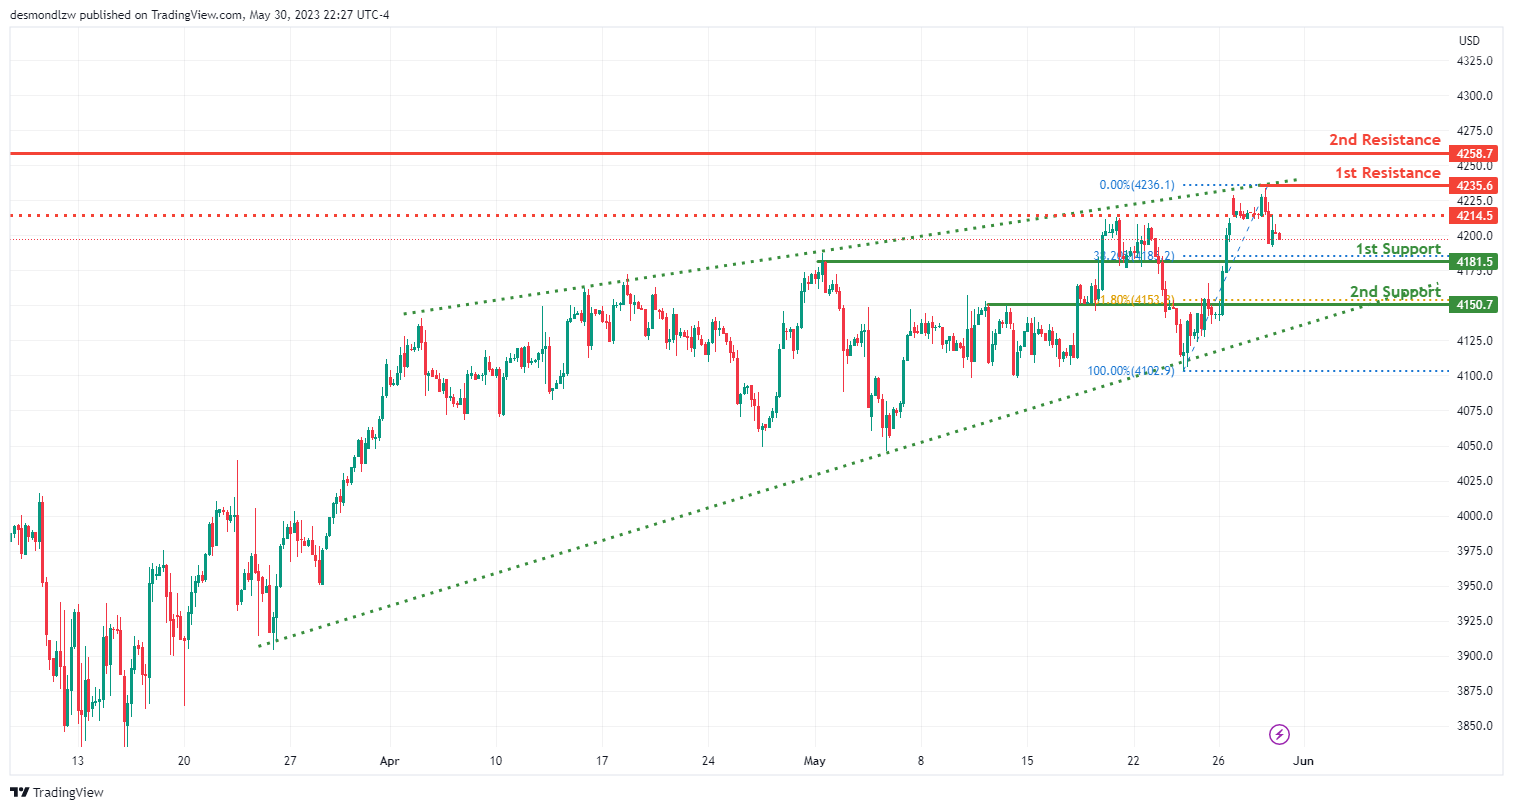
The US500 chart is currently showing a bearish trend, suggesting a possible continuation of the downward movement. A bearish rising wedge pattern further signals potential future declines.
The first support level is at 4181.5, identified as a pullback support and aligns with the 38.20% Fibonacci retracement. This level has historical significance, acting as a potential floor for the price action.
The second support level is at 4150.70. This pullback support aligns with the 61.80% Fibonacci retracement, adding further strength to its potential as a critical support area.
If the bearish trend continues, the price could move towards these support levels.
On the resistance side, the first resistance level is at 4235.60, which has been identified as a swing high resistance. This level could temporarily halt upward price movements, potentially causing a pause or retracement in the bearish trend.
The second resistance is at 4258.70, which is also a swing high resistance. An intermediate resistance is also identified at 4241.50, acting as a pullback resistance.
BTC/USD:
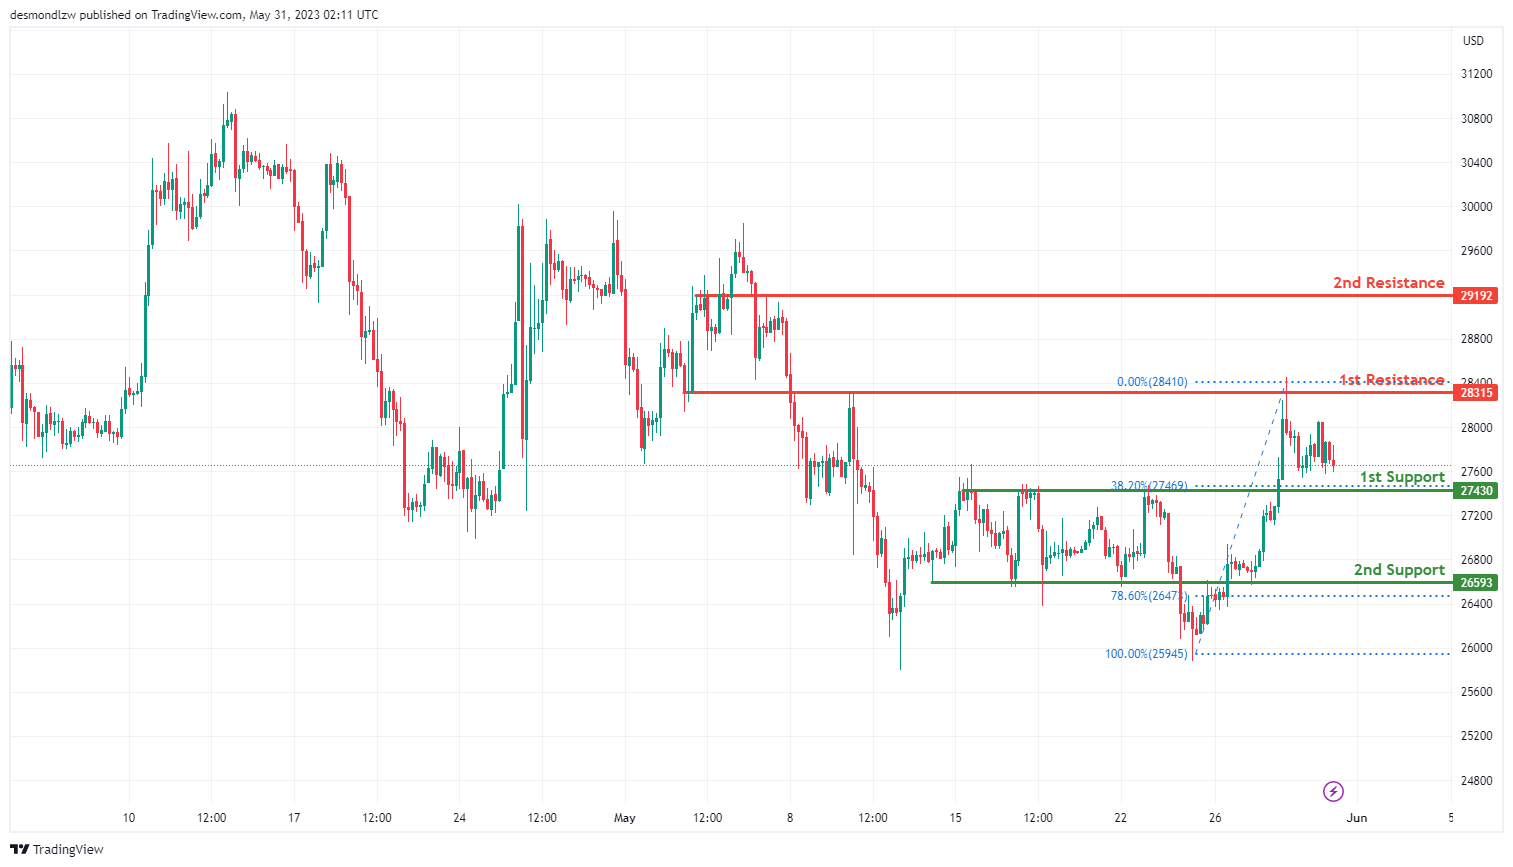
The BTC/USD chart currently exhibits a bearish momentum, suggesting a potential continuation of the downward trend.
The first support level is at 27430, identified as a pullback support. It aligns with the 38.20% Fibonacci retracement, indicating historical significance as a price level where buyers may re-enter the market, potentially reversing or slowing the bearish trend.
The second support level is at 26539, which is recognized as an overlap support. This level is particularly significant as it coincides with the 78.60% Fibonacci retracement, strengthening its potential as a pivotal support area.
In terms of resistance, the first level is at 28315, marked as an overlap resistance. This level could act as a temporary barrier to upward price movements, potentially causing a pause or retracement in the bearish trend.
The second resistance level is at 29192, which is also characterized as an overlap resistance. This level could further resist upward price movements if the bearish trend is to reverse.
The overall trend suggests that price may continue to drop towards the identified support levels.
ETH/USD:
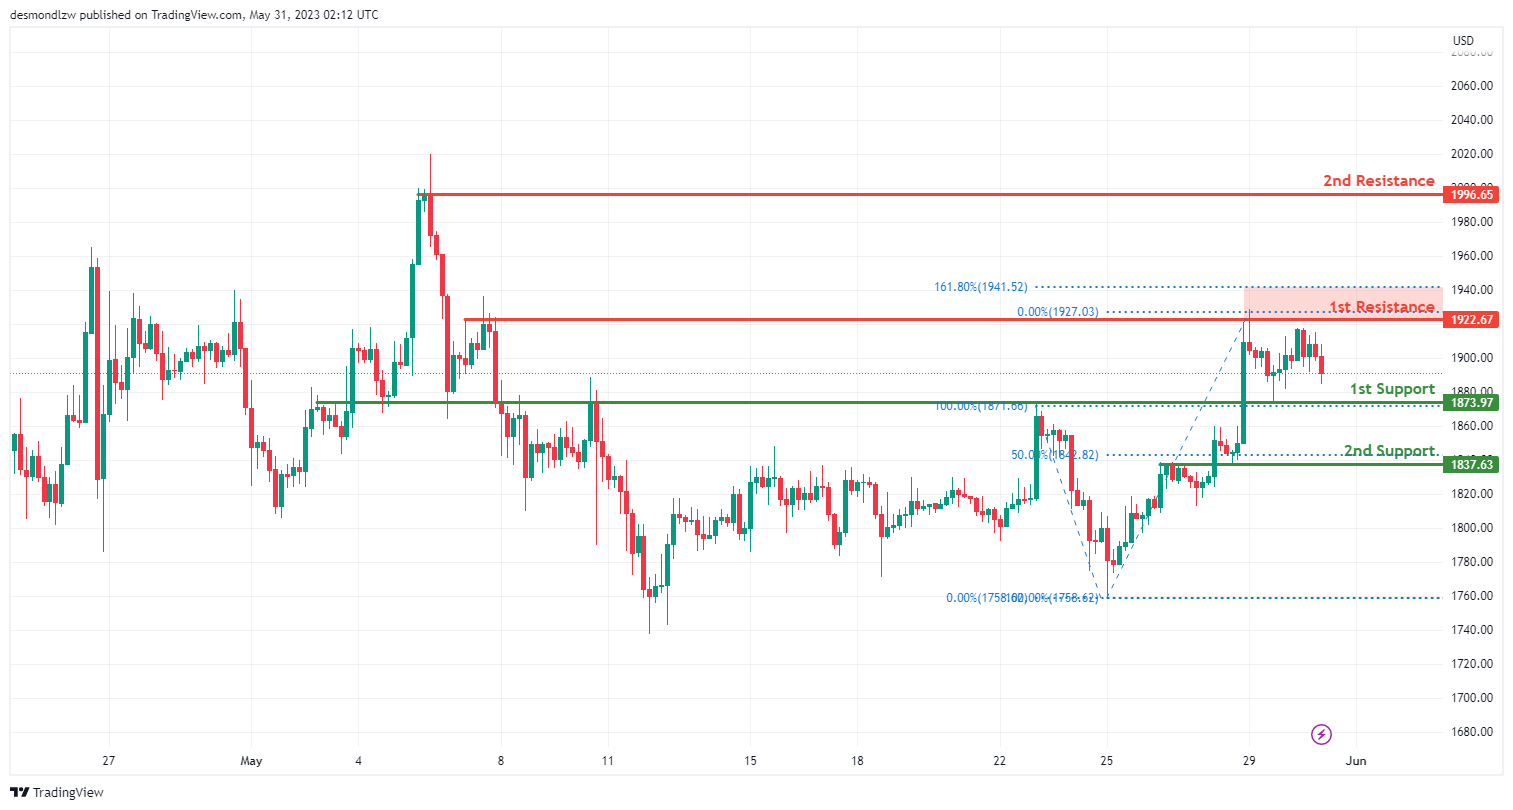
The ETH/USD chart is currently showing bearish momentum, indicating a potential continuation of the downward trend.
The first support level is at 1873.97, identified as an overlap support. This level serves as a significant area where buyers have previously entered the market, potentially slowing or reversing the bearish trend.
The second support level is at 1837.63, also identified as an overlap support. This level carries additional significance as it aligns with the 50% Fibonacci retracement, further strengthening its role as a pivotal support area.
On the resistance side, the first resistance level is at 1922.67, recognized as a multi-swing high resistance. This level may act as a temporary hurdle to any upward price movements, potentially causing a pause or retracement in the bearish trend.
The second resistance level is at 1996.65, known as a swing high resistance. This level may present additional resistance to upward price movements if the bearish trend reverses.
The overall trend suggests a potential continuation of the bearish trend towards the identified support levels.
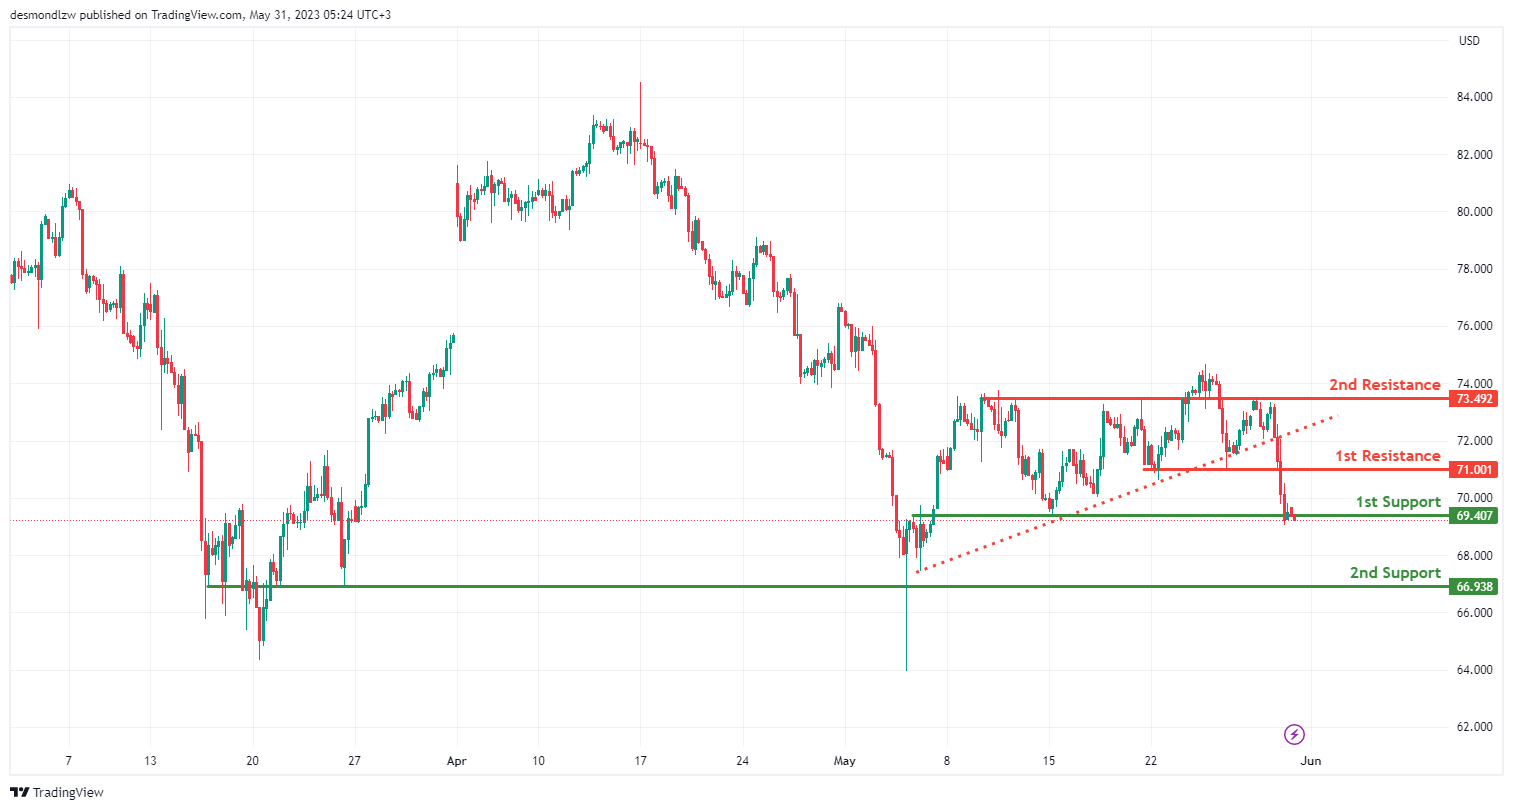
WTI/USD:
The WTI chart is currently showing bearish momentum, indicated by the recent break below an ascending support line that could trigger a potential bearish move.
The first support level is at 69.40, identified as an overlap support. This level serves as a significant area where buyers have previously entered the market, potentially slowing or reversing the bearish trend.
The second support level is at 66.93, also identified as an overlap support. This level carries additional significance as a price level where buying activity has previously occurred, further reinforcing its role as a potential support area.
On the resistance side, the first resistance level is at 71.00, recognized as a pullback resistance. This level may act as a temporary hurdle to any upward price movements, potentially causing a pause or retracement in the bearish trend.
The second resistance level is at 73.49, identified as an overlap resistance. This level has previously shown its significance as a price level where selling pressure has emerged.
The overall trend suggests a potential continuation of the bearish trend towards the identified support levels.
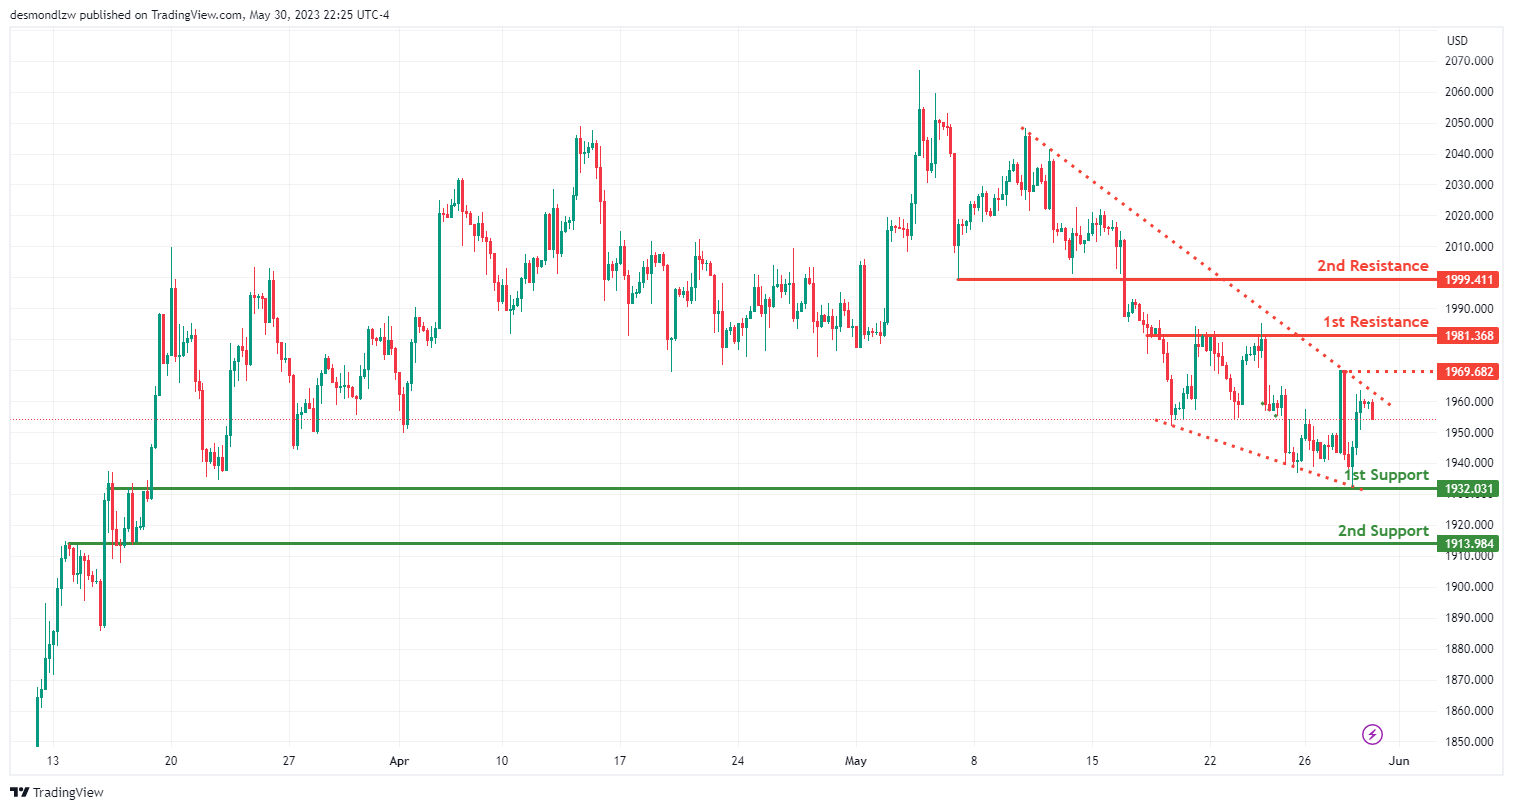
XAU/USD (GOLD):
The XAU/USD chart is currently showing bearish momentum.
The first support level is at 1932.03, identified as an overlap support. This level represents a significant area where buyers have previously entered the market, potentially slowing or reversing the bearish trend.
The second support level is at 1913.98, also identified as an overlap support. This level has additionally demonstrated its significance as a price level where buying activity has previously occurred, reinforcing its role as a potential area of support.
On the resistance side, the first resistance level is at 1981.36, recognized as a multi-swing high resistance. This level may act as a temporary obstacle to any upward price movements, potentially causing a pause or retracement in the bearish trend.
The second resistance level is at 1999.41, identified as an overlap resistance. This level has previously shown its significance as a price level where selling pressure has emerged.
There is also an intermediate resistance level at 1969.68, identified as a swing high resistance. This level could act as an intermediate barrier to any price increase.
The accuracy, completeness and timeliness of the information contained on this site cannot be guaranteed. IC Markets does not warranty, guarantee or make any representations, or assume any liability regarding financial results based on the use of the information in the site.
News, views, opinions, recommendations and other information obtained from sources outside of www.icmarkets.com, used in this site are believed to be reliable, but we cannot guarantee their accuracy or completeness. All such information is subject to change at any time without notice. IC Markets assumes no responsibility for the content of any linked site.
The fact that such links may exist does not indicate approval or endorsement of any material contained on any linked site. IC Markets is not liable for any harm caused by the transmission, through accessing the services or information on this site, of a computer virus, or other computer code or programming device that might be used to access, delete, damage, disable, disrupt or otherwise impede in any manner, the operation of the site or of any user’s software, hardware, data or property.


