Waiting for lower timeframe confirmation is our main tool to confirm strength within higher timeframe zones, and has really been the key to our trading success. It takes a little time to understand the subtle nuances, however, as each trade is never the same, but once you master the rhythm so to speak, you will be saved from countless unnecessary losing trades. The following is a list of what we look for:
- A break/retest of supply or demand dependent on which way you’re trading.
- A trendline break/retest.
- Buying/selling tails/wicks – essentially we look for a cluster of very obvious spikes off of lower timeframe support and resistance levels within the higher timeframe zone.
- Candlestick patterns. We tend to stick with pin bars and engulfing bars as these have proven to be the most effective.
We typically search for lower-timeframe confirmation between the M15 and H1 timeframes, since most of our higher-timeframe areas begin with the H4. Stops are usually placed 1-3 pips beyond confirming structures.
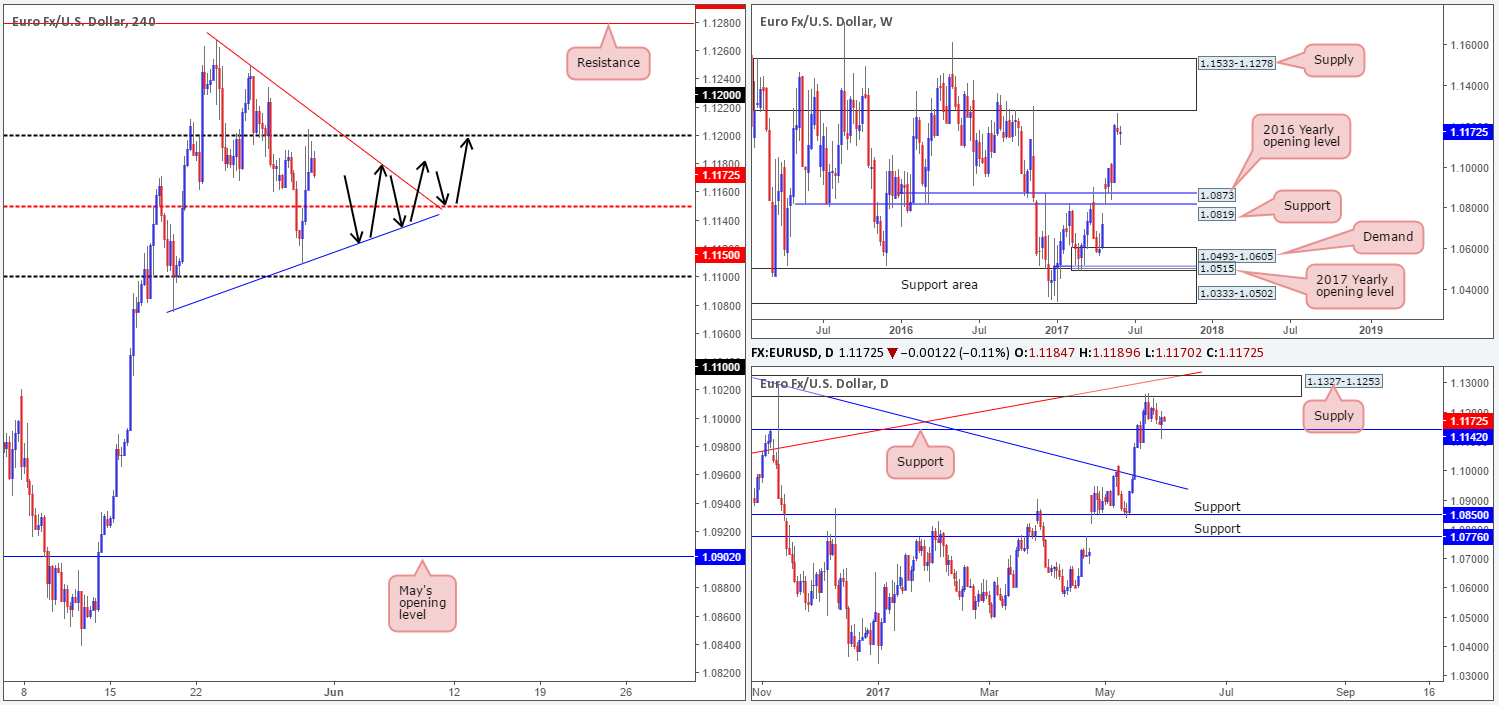
EUR/USD:
Leaving the 1.11 handle unchallenged, the shared currency shifted northbound yesterday. The H4 mid-level resistance at 1.1150 was easily cleared, allowing price to shake hands with the 1.12 barrier going into the early hours of the US segment, which for now is holding as resistance. What’s also notable from a technical perspective is the potential H4 bullish pennant (1.1075/1.1268) that’s forming on top of a daily support at 1.1142. What’s concerning though is that this H4 bullish formation is also actually taking shape beneath a formidable weekly supply area coming in at 1.1533-1.1278!
Our suggestions: Basically, we’re looking for price to continue compressing within the current H4 pennant and then break out to the upside. Should this occur, as per the black arrows, we’d be looking to trade long from from 1.1150, and target 1.12 as an initial take-profit zone. We plan on holding the remainder of the position for a potential run up to 1.1253 (underside of daily supply) and then the underside of weekly supply at 1.1278.
Data points to consider: German Retail sales at 7am, EUR CPI figures at 10am. FOMC member Kaplan speaks at 1pm, US pending home sales at 3pm GMT+1.
Levels to watch/live orders:
- Buys: Watching for price to compress within the current H4 pennant and break out north for a possible retest of 1.1150.
- Sells: Flat (stop loss: N/A).
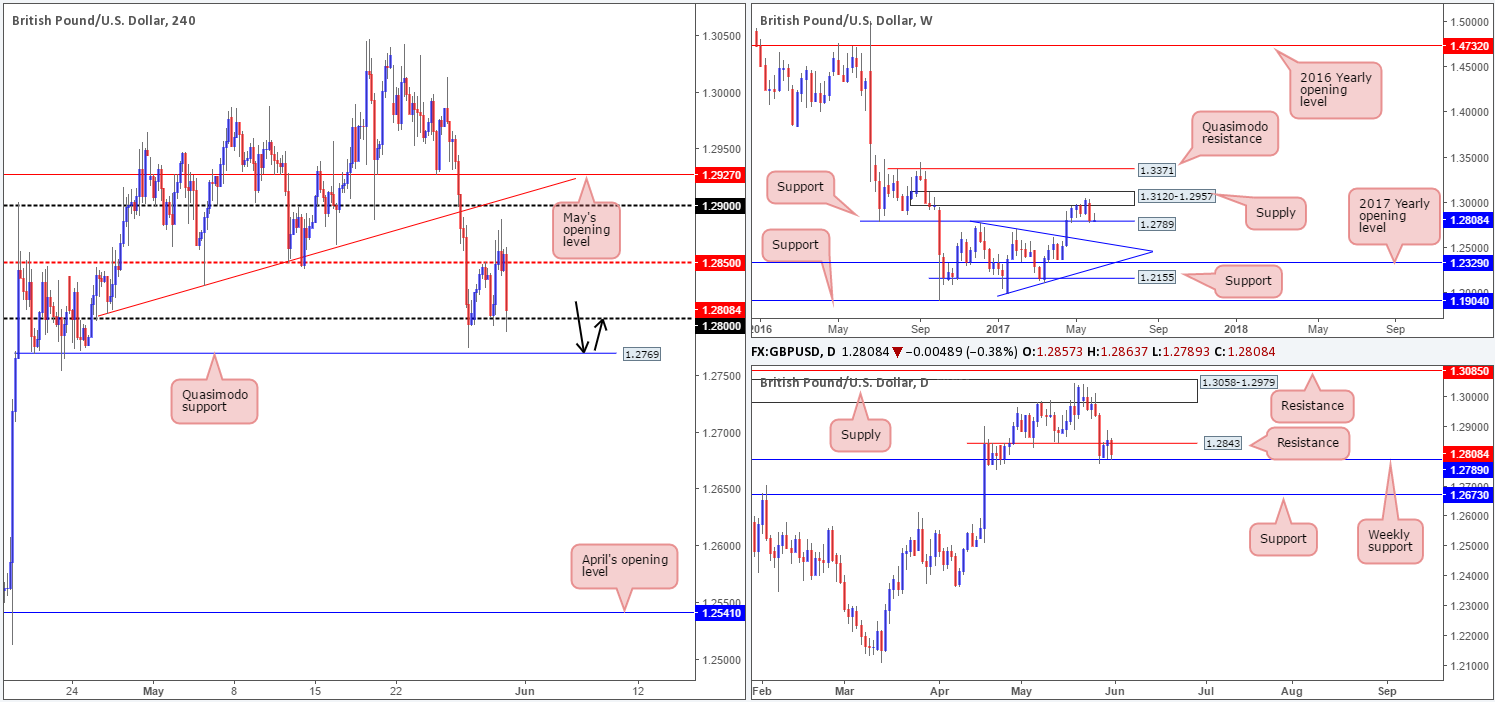
GBP/USD:
After failing to sustain gains beyond the H4 mid-level resistance at 1.2850 yesterday, the pair, in recent hours, brought the unit back down to the 1.28 handle. With this psychological barrier likely worn out, we still have our eye on the H4 Quasimodo support level seen plotted below at 1.2769.
The stops taken from 1.28 would likely provide enough liquidity for the big boys to begin buying this market at 1.2769. What’s more, let’s remember that we are also trading from a weekly support at 1.2789! Therefore, there is a good chance price will bounce from 1.2769 and at least reach 1.28.
Our suggestions: Based on the above points, our desk believes the aforementioned H4 Quasimodo support level is stable enough to consider a buy trade from, with a stop-loss order placed below the pattern’s apex at 1.2748. However, be sure to reduce risk to breakeven once price tests 1.28 as we do expect the bears to put up a fight here.
Data points to consider: FOMC member Kaplan speaks at 1pm, US pending home sales at 3pm GMT+1.
Levels to watch/live orders:
- Buys: 1.2769 region ([possible market order] stop loss: 1.2748).
- Sells: Flat (stop loss: N/A).
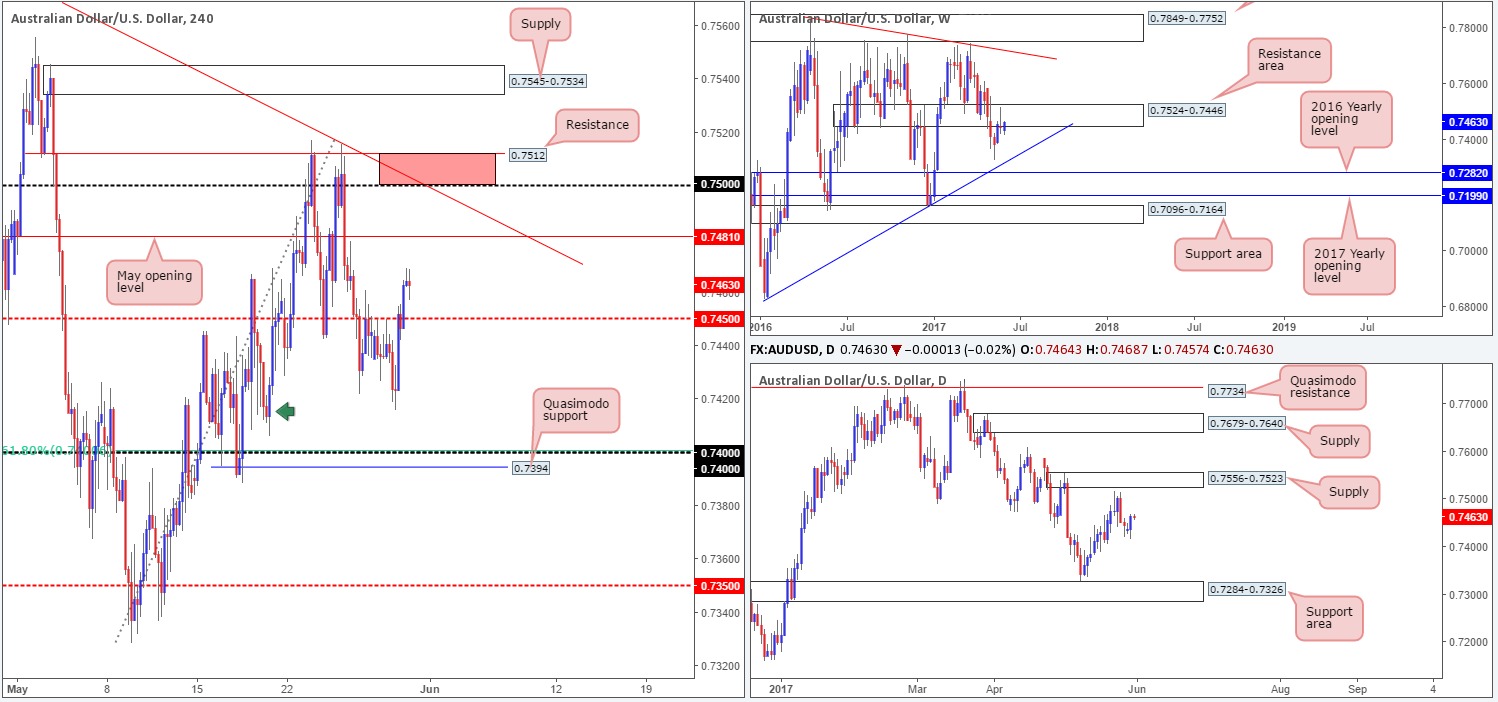
AUD/USD:
Trade update: stopped for breakeven at 0.7440).
The Aussie closed in positive territory yesterday, as the US dollar drove lower. This consequently formed a nice-looking daily engulfing candle that smothered both Friday and Monday’s action. Over on the H4 timeframe, we saw the demand marked with a green arrow around 0.7420 hold price and send the pair back above the H4 mid-level resistance coming in at 0.7450. To the upside, we now see May’s opening level lurking nearby at 0.7481, followed closely by the 0.75 handle.
Despite daily price printing a bullish engulfing candle, which to some is considered a buy signal, it might be worth taking note that weekly price remains trading from a resistance area planted at 0.7524-0.7446. So, with that in mind, where do we go from here?
Our suggestions: Personally, we are going to sidestep any long setups we come across today. Buying when we know weekly price is trading from supply is just too risky for our liking. Also, as much as we love monthly opening levels, we will not be trading short from May’s level. Instead, we have our eye on the 0.7512/0.75 area, which comprises of a H4 resistance at 0.7512, a H4 trendline resistance etched from the high 0.7610 and the round number 0.75 (shaded in red). While this sell zone is planted nicely within the limits of the current weekly supply, there’s still a chance that daily price could force the H4 candles to fake north to touch base with the underside of daily supply at 0.7523. Therefore, waiting for a reasonably sized H4 bearish candle to form, preferably a full-bodied candle, before pulling the trigger is advised.
Data points to consider: Chinese manufacturing data at 2am. FOMC member Kaplan speaks at 1pm, US pending home sales at 3pm GMT+1.
Levels to watch/live orders:
- Buys: Flat (stop loss: N/A).
- Sells: 0.7512/0.75 ([waiting for a reasonably sized H4 bear candle to form – preferably a full-bodied candle – is advised] stop loss: ideally beyond the candle’s wick).
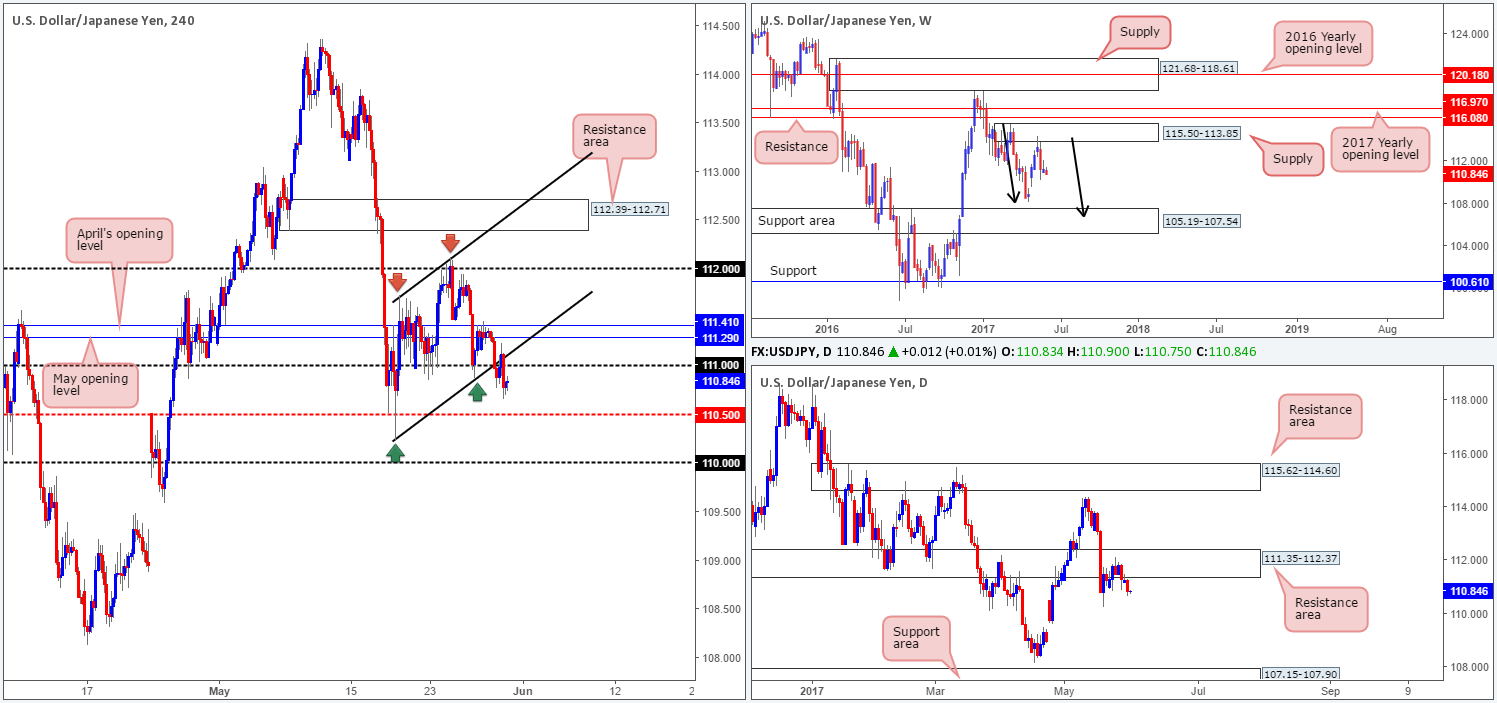
USD/JPY:
Alongside US equities, the USD/JPY punched lower yesterday. The move, as you can see, punctured the H4 channel support taken from the low 110.23 (ties in nicely with the 111 handle), and clocked a low of 110.66. With this in view, our desk is watching for H4 price to retest the 111 boundary as resistance for a possible short. Why here, and where would we target?
Why we’re looking for shorts is simply because weekly bears remain in a relatively strong position after pushing aggressively lower from supply registered at 115.50-113.85. We know there’s a lot of ground to cover here, but this move could possibly result in further downside taking shape in the form of a weekly AB=CD correction (see black arrows) that terminates within a weekly support area marked at 105.19-107.54 (stretches all the way back to early 2014). Furthermore, daily price continues to defend the resistance area penciled in at 111.35-112.37. The next area on the hit list from here falls in at 107.15-107.90: a support zone that’s glued to the top edge of the said weekly support area.
In regards to possible take-profit targets, the initial level of interest stands at 110.50. But, as we already know from the higher-timeframe structures, H4 price could very well drive much lower than this!
Our suggestions: Following a retest of 111, we’d also like to see bearish intent in the form a lower-timeframe confirming sell signal (see the top of this report).
Data points to consider: FOMC member Kaplan speaks at 1pm, US pending home sales at 3pm GMT+1.
Levels to watch/live orders:
- Buys: Flat (stop loss: N/A).
- Sells: 111 region ([waiting for a lower-timeframe signal to form following the retest is advised] stop loss: dependent on where one confirms this level).
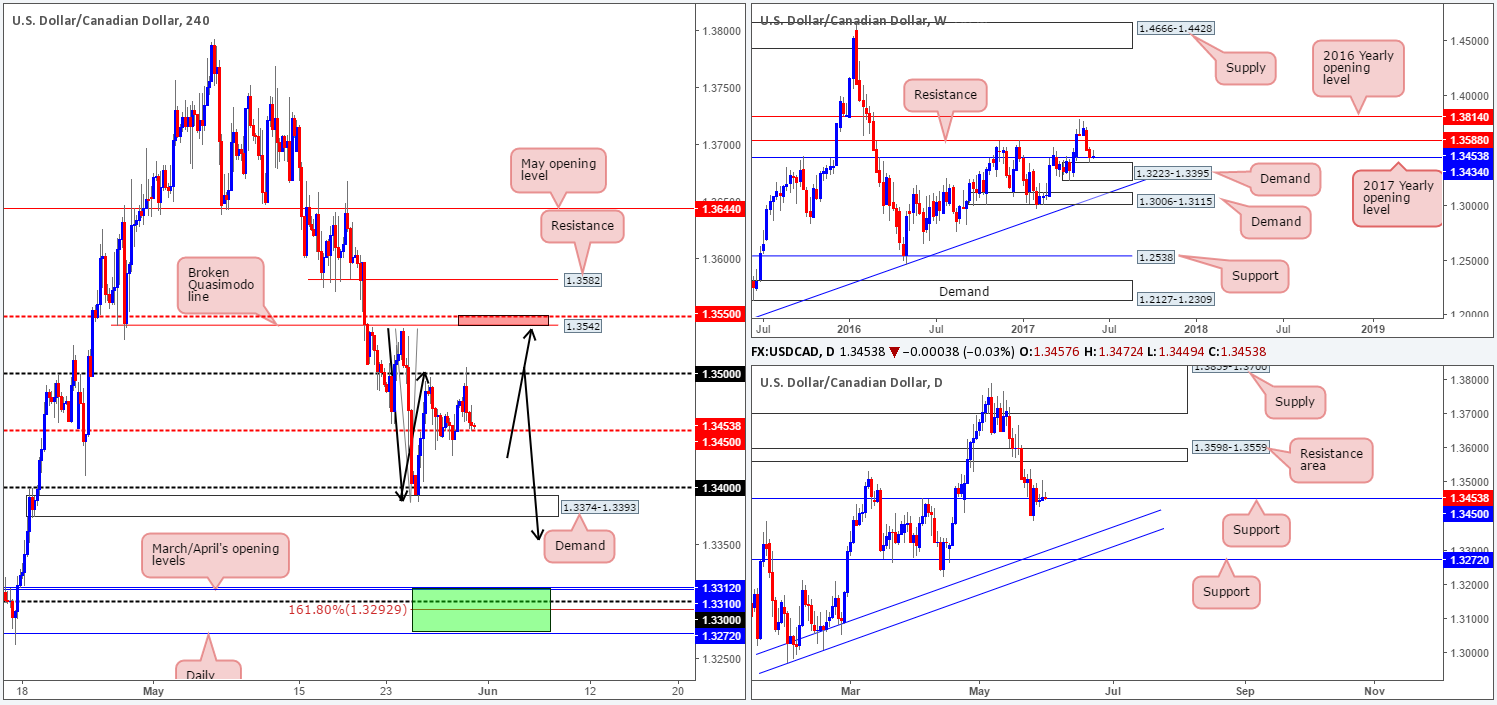
USD/CAD:
Kicking this report off with a look at the weekly chart, we can see that price remains trading around the 2017 yearly opening level at 1.3434. Directly below sits a demand base coming in at 1.3223-1.3395, which was tested during last week’s session. Down on the daily chart, the unit continues to linger around support seen at 1.3450. To the upside, we have a resistance area planted at 1.3598-1.3559, and below there’s a support line at 1.3272 which happens to intersect with two trendline supports (1.2968/1.3027).
Bouncing over to the H4 chart, we see the following:
- To the upside, there’s a potential H4 AB=CD bearish pattern (taken from the low 1.3387) taking shape that terminates just ahead of a H4 broken Quasimodo line drawn from 1.3542/H4 mid-level resistance at 1.3550 and a daily resistance area at 1.3598-1.3559. The small (red) area marks a possible zone where price could bounce.
- To the downside, we also see a potential H4 AB=CD 161.8% Fib ext. at 1.3292 taken from the high 1.3540. This number helps form a strong-looking (green) buy zone. 1.3272/1.3312: holds the following structures:
- Daily support at 1.3272.
- 1.33 handle.
- March/April’s opening levels at 1.3310/1.3312.
- Daily trendline support confluence (1.2968/1.3027).
- Also of note is the H4 buy zone is seen lodged within the lower limits of the weekly demand at 1.3223-1.3395!
Our suggestions: As you can see, both zones hold a reasonable amount of confluence and have the potential to reverse price. To be on the safe side, however, we would recommend not entering blindly at these areas. Wait for additional confirmation in the form a reasonably sized H4 rotation candle, preferably a full-bodied candle, before committing to a trade.
Data points to consider: FOMC member Kaplan speaks at 1pm, US pending home sales at 3pm. Canadian growth data at 1.30pm GMT+1.
Levels to watch/live orders:
- Buys: 1.3272/1.3312 ([waiting for a reasonably sized H4 bull candle to form – preferably a full-bodied candle – is advised] stop loss: ideally beyond the candle’s tail).
- Sells: 1.3550/1.3542 ([waiting for a reasonably sized H4 bear candle to form – preferably a full-bodied candle – is advised] stop loss: ideally beyond the candle’s wick).
USD/CHF:
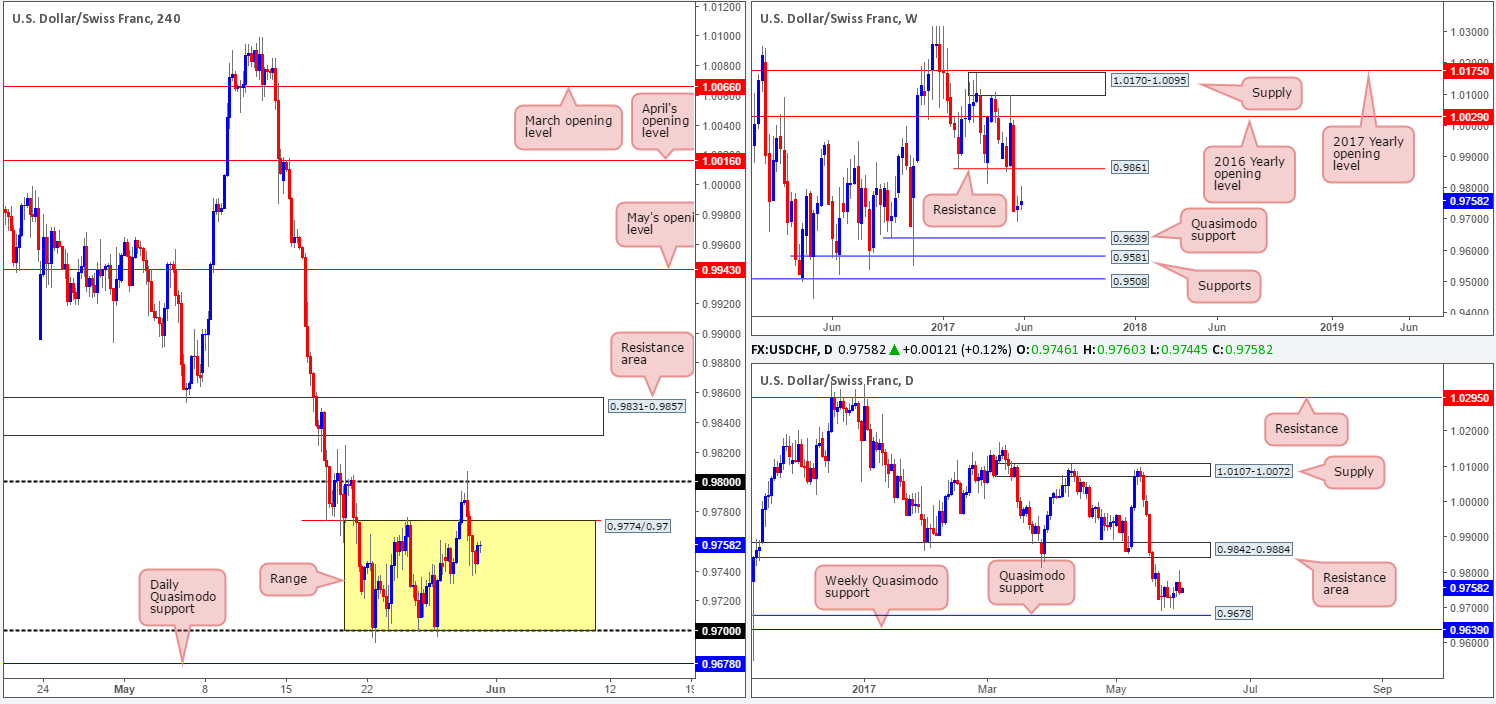
As can be seen from the H4 candles this morning, the 0.98 handle elbowed its way into the spotlight yesterday and held steady as a resistance. With price fading from this number, we saw the unit enter back within the limits of a H4 range fixed between 0.9774/0.97. This consolidation is interesting due to it forming just ahead of a daily Quasimodo support level at 0.9678. What’s also notable is the fact that this daily barrier is positioned just ahead of a weekly Quasimodo support pegged at 0.9639.
Over on the bigger picture, we see very little structure stopping daily price from reaching the said Quasimodo level. With that in mind, we feel that the Swissy will eventually punch below the current H4 range and challenge this daily base line.
Our suggestions: A fakeout through 0.97 that connects with the aforementioned daily Quasimodo support is a valid long, in our opinion. The reason being is there are likely a truckload of sell stops lingering just below 0.97. These stops, when filled, become sell orders, and thus give the big boys liquidity to buy into from the daily Quasimodo! So, with that in mind, should price whipsaw through 0.97, test 0.9678, and close back above 0.97, we will look to enter long, targeting the top edge of the H4 range at 0.9774.
Data points to consider: FOMC member Kaplan speaks at 1pm, US pending home sales at 3pm GMT+1.
Levels to watch/live orders:
- Buys: 0.97 region ([wait for price to fakeout beyond the 0.97 handle – touch 0.9678 – and then close back above 0.97, before looking to commit to a position] stop loss: ideally beyond the candle’s tail).
- Sells: Flat (stop loss: N/A).
DOW 30:
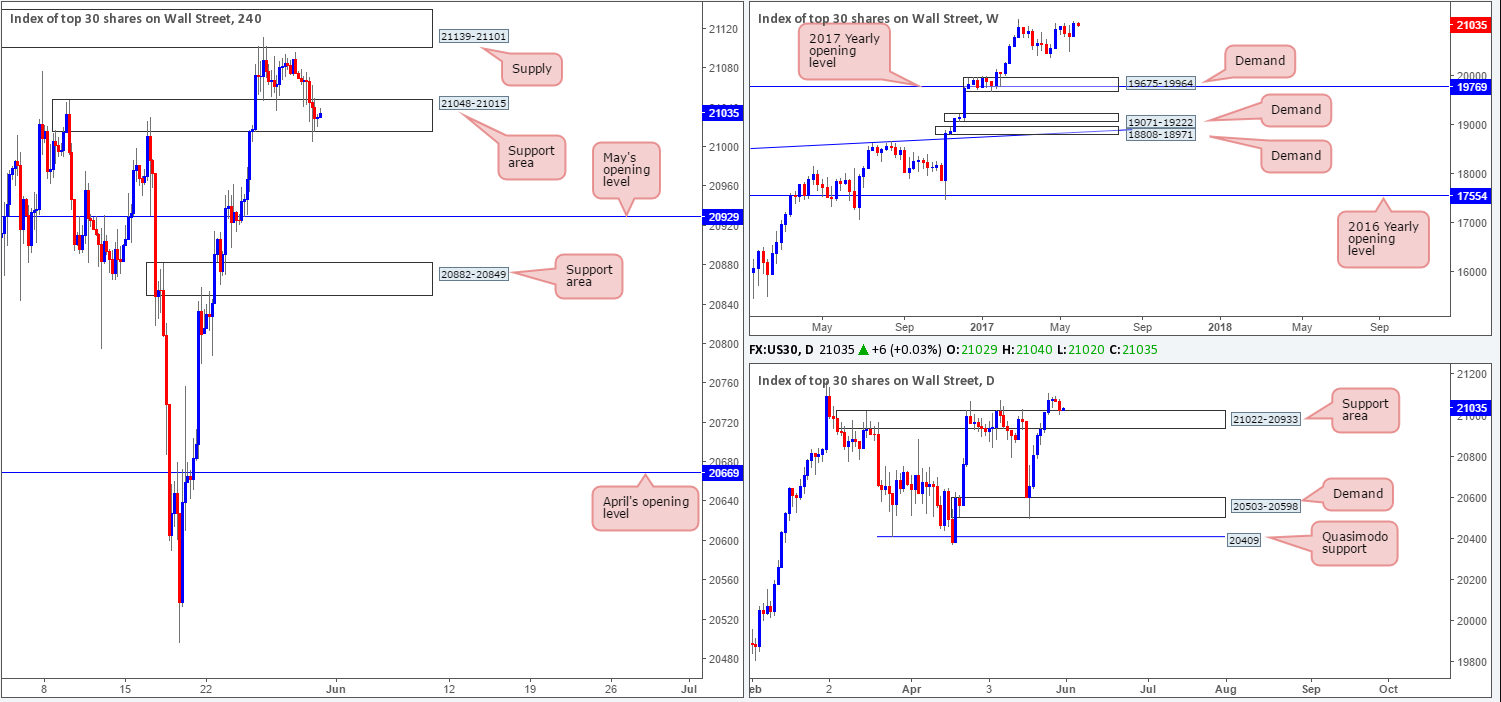
US equities took a hit yesterday and even marginally breached the lower edge of a H4 support area coming in at 21048-21015. This recent down move has also brought the unit down to the top edge of a daily support area drawn from 21022-20933, which should, technically speaking, hold price higher.
Despite yesterday’s bearish move, our team remains biased to the upside since we are trading around record highs at the moment. However, entering long from the current H4 support zone is not something our team would feel comfortable with knowing that there’s a nearby H4 supply lurking just above at 21139-21101.
Our suggestions: Waiting for the H4 supply mentioned above at 21139-21101 to be taken out is likely the safer route, before considering hunting for longs. Therefore, until we see a decisive close above this area, our desk will remain patiently waiting on the sidelines.
Data points to consider: FOMC member Kaplan speaks at 1pm, US pending home sales at 3pm GMT+1.
Levels to watch/live orders:
- Buys: Watching for H4 price to close above H4 supply at 21139-21101 before looking to long this market.
- Sells: Flat (stop loss: N/A).
GOLD:
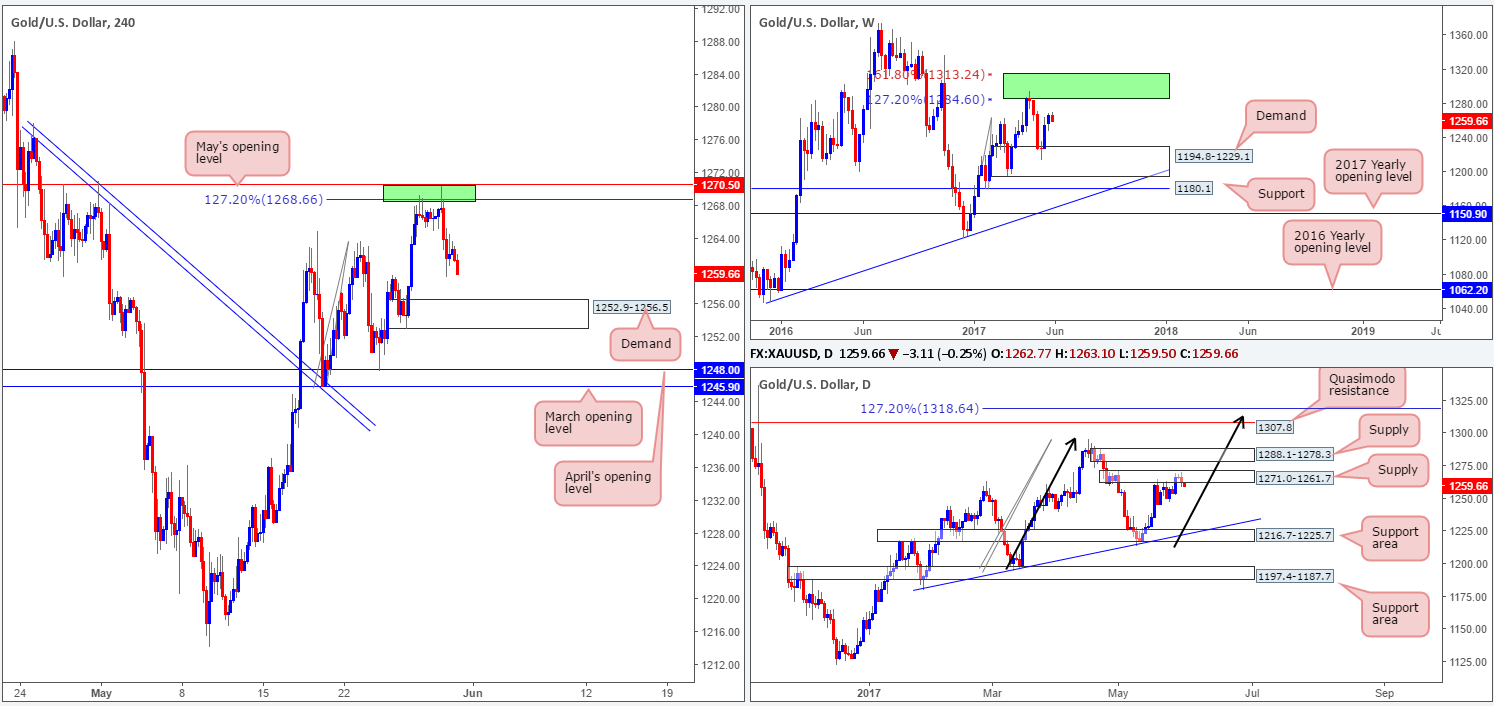
In recent sessions, the price of gold retreated and clocked a fresh low of 1259.2. The move began after H4 price chalked in a bearish selling wick that pierced 1270.5/1268.6 (May’s opening level and a H4 AB=CD 127.2% Fib ext. [taken from the low 1245.9]). As we write, the yellow metal looks poised to extend these losses and shake hands with demand registered at 1252.9-1256.5.
Over on the bigger picture, daily supply at 1271.0-1261.7 remains in a firm position, and could very well be the catalyst that forces H4 price down to the said demand. Up on the weekly chart, however, bullion is seen lurking between demand marked at 1194.8-1229.1 and two weekly Fibonacci extensions 161.8/127.2% at 1313.7/1285.2 taken from the low 1188.1 (green zone).
Our suggestions: Entering long from the current H4 demand is tempting, since weekly price shows little stopping further upside taking shape. However, you would have to contend with the possibility of going up against daily sellers from the aforementioned supply! And, in addition to this, there’s also a chance that H4 price may look to ignore the demand altogether and head down to March/April’s opening levels at 1245.9/1248.0.
We’re not against buying from the H4 demand, but we are wary. With that being the case, we will assess how H4 price behaves once/if gold challenges this zone. Should a H4 bull candle present itself, preferably in the form of a full-bodied candle, we would, dependent on the time of day, consider a long from here, targeting the 1268.0 neighborhood.
Levels to watch/live orders:
- Buys: 1252.9-1256.5 ([waiting for a reasonably sized H4 bull candle to form – preferably a full-bodied candle – is advised] stop loss: ideally beyond the candle’s tail).
- Sells: Flat (stop loss: N/A).