
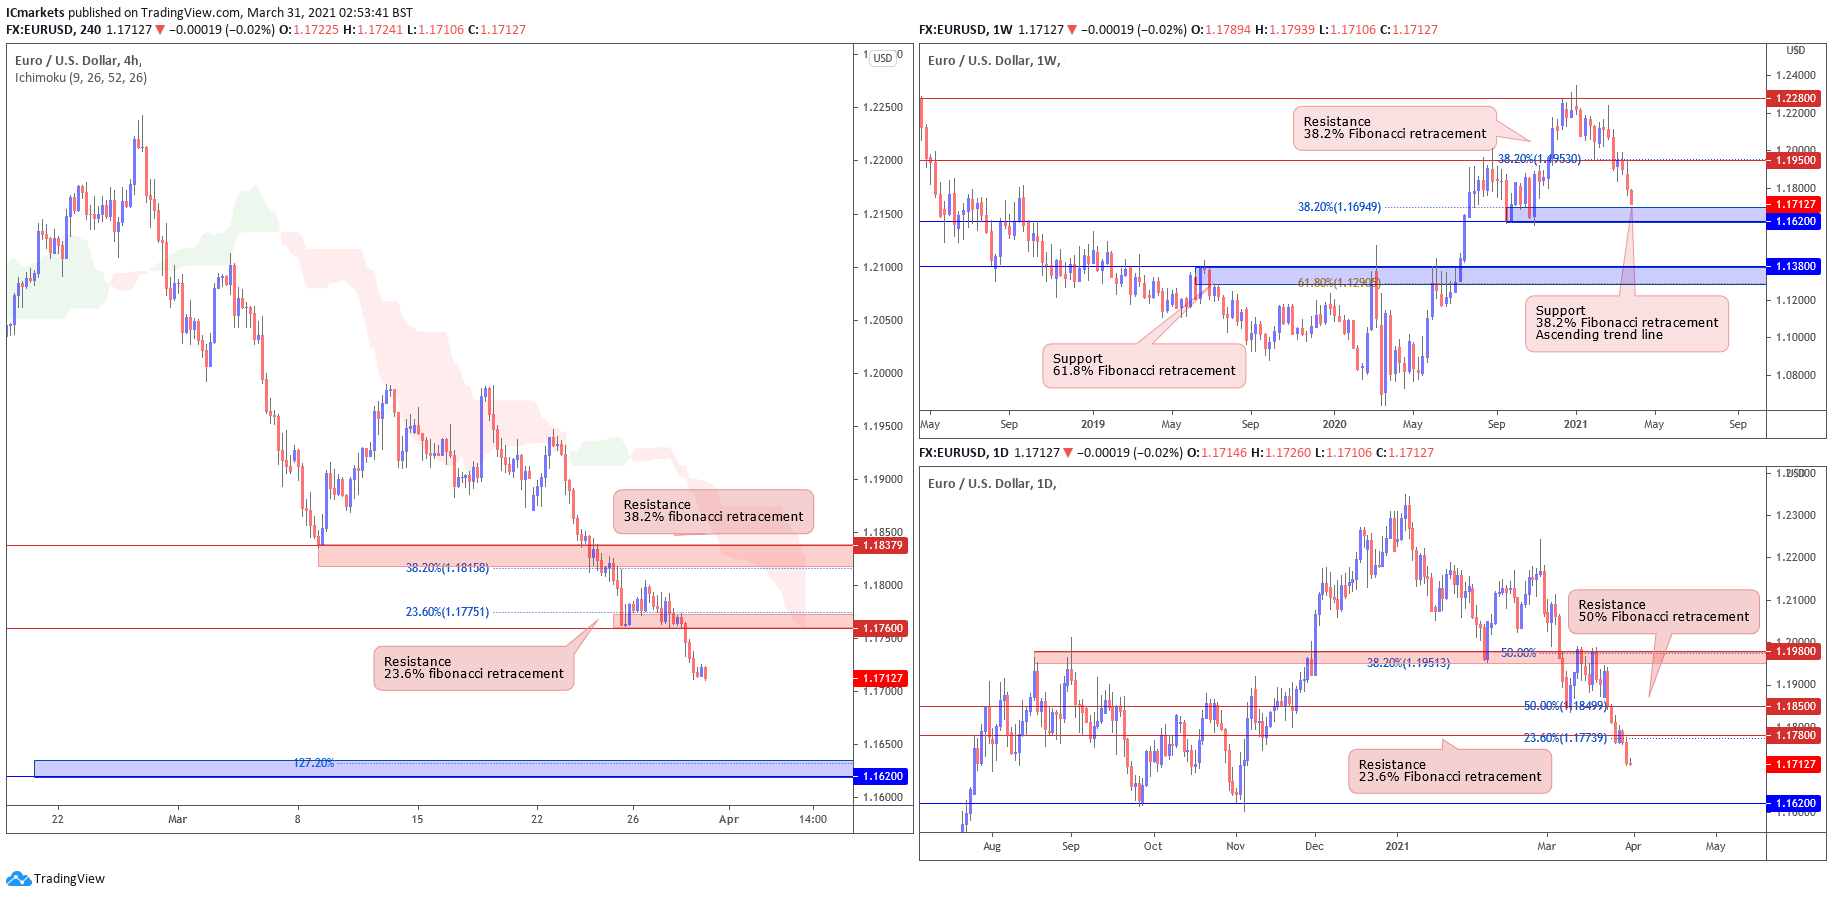
EUR/USD:
Looking at the weekly chart, we can see that prices could see further downside before it reaches our support target at 1.16200, which coincides with 38.2% Fibonacci retracement. The daily time frame echoes the same bearish view as well as prices are facing bearish resistance from our resistance level at 1.17800 in line with our 23.6% fibonacci retracement where we could see a further downside below this level to our next support target at 1.16200, which is in line with our horizontal swing low support.
On the H4 timeframe, prices are facing bearish pressure from our resistance level at 1.17600, in line with our graphical pullback resistance and 23.6% fibonacci retracement where we could see a further drop to our next support level at 1.16200.
Areas of consideration:
- 17600 resistance area found on H4 time frame
- 16200 support area found on H4 time frame
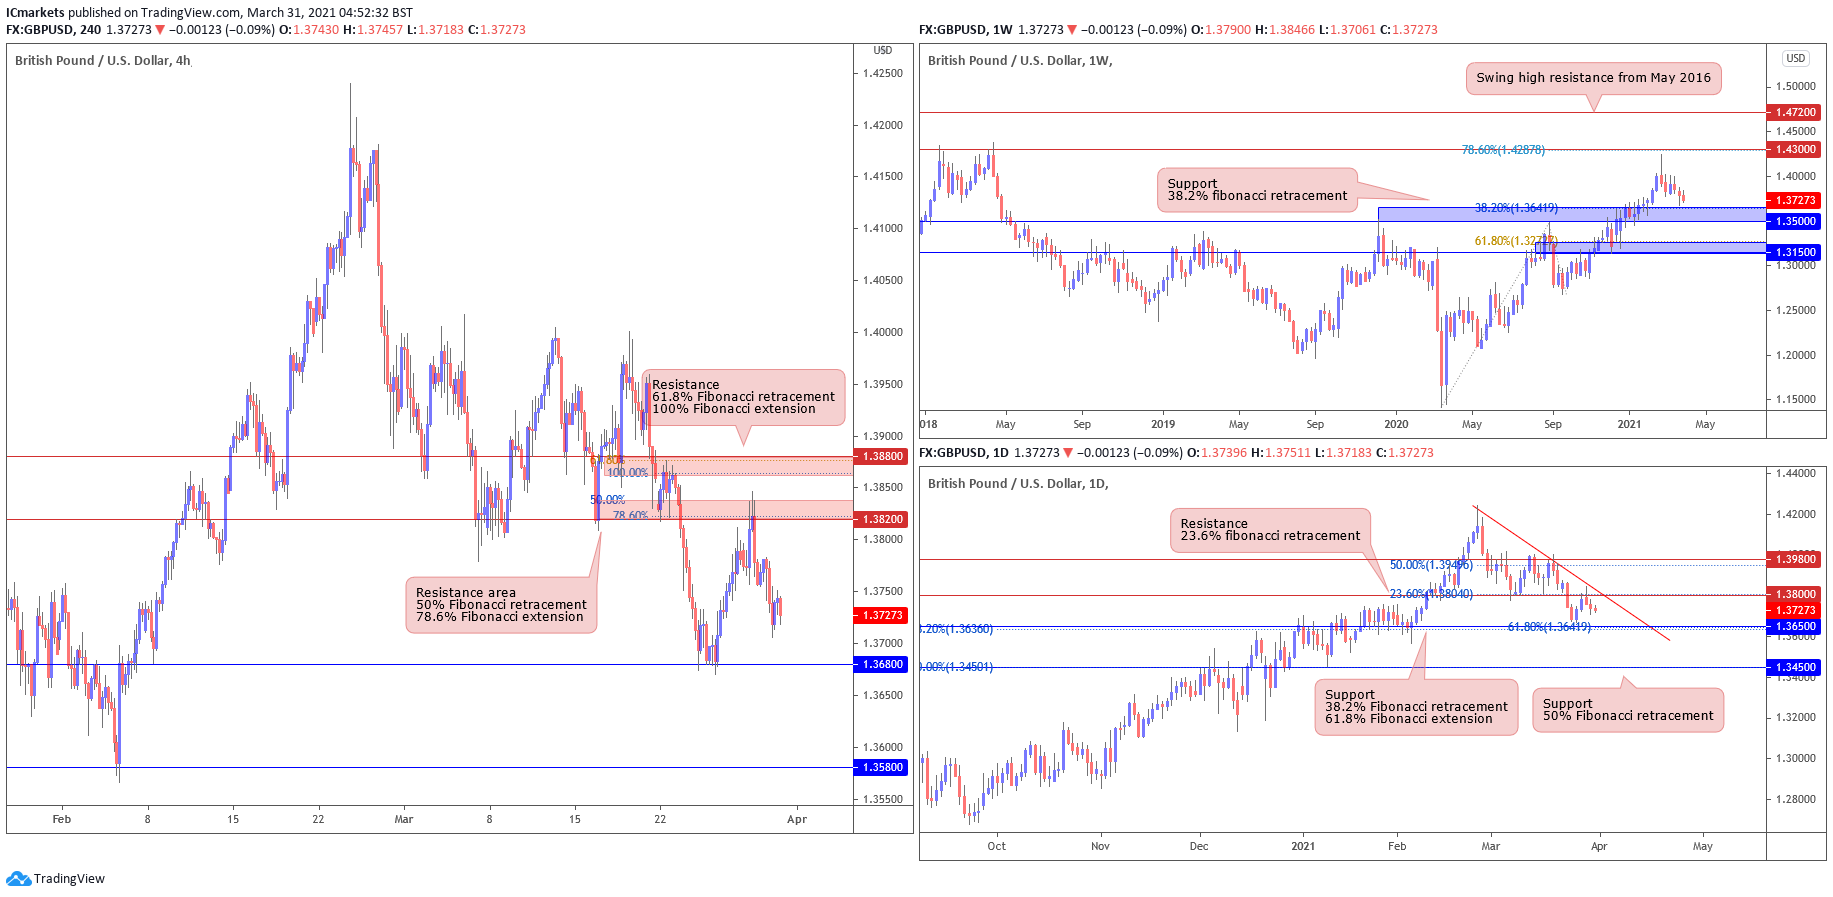
GBP/USD:
Looking at the weekly and daily chart, we can see that prices could see limited downside before it reaches our support area at 1.35000, in line with the graphical support area and 38.2% fibonacci retracement. On the daily time frame, prices are facing bearish pressure from our resistance at 1.38000 as well, in line with our graphical resistance area and 23.6% fibonacci retracement.
On the H4 timeframe, prices are facing bearish pressure from our resistance at 1.3820, in line with our graphical resistance area and 50% fibonacci retracement, 78.6% fibonacci extension where we could see a further downside below this level to our H4 support target at 1.36800, in line with the graphical swing low support area.
Areas of consideration:
- 38200 resistance area found on H4 time frame
- 36800 support area found on H4 timeframe
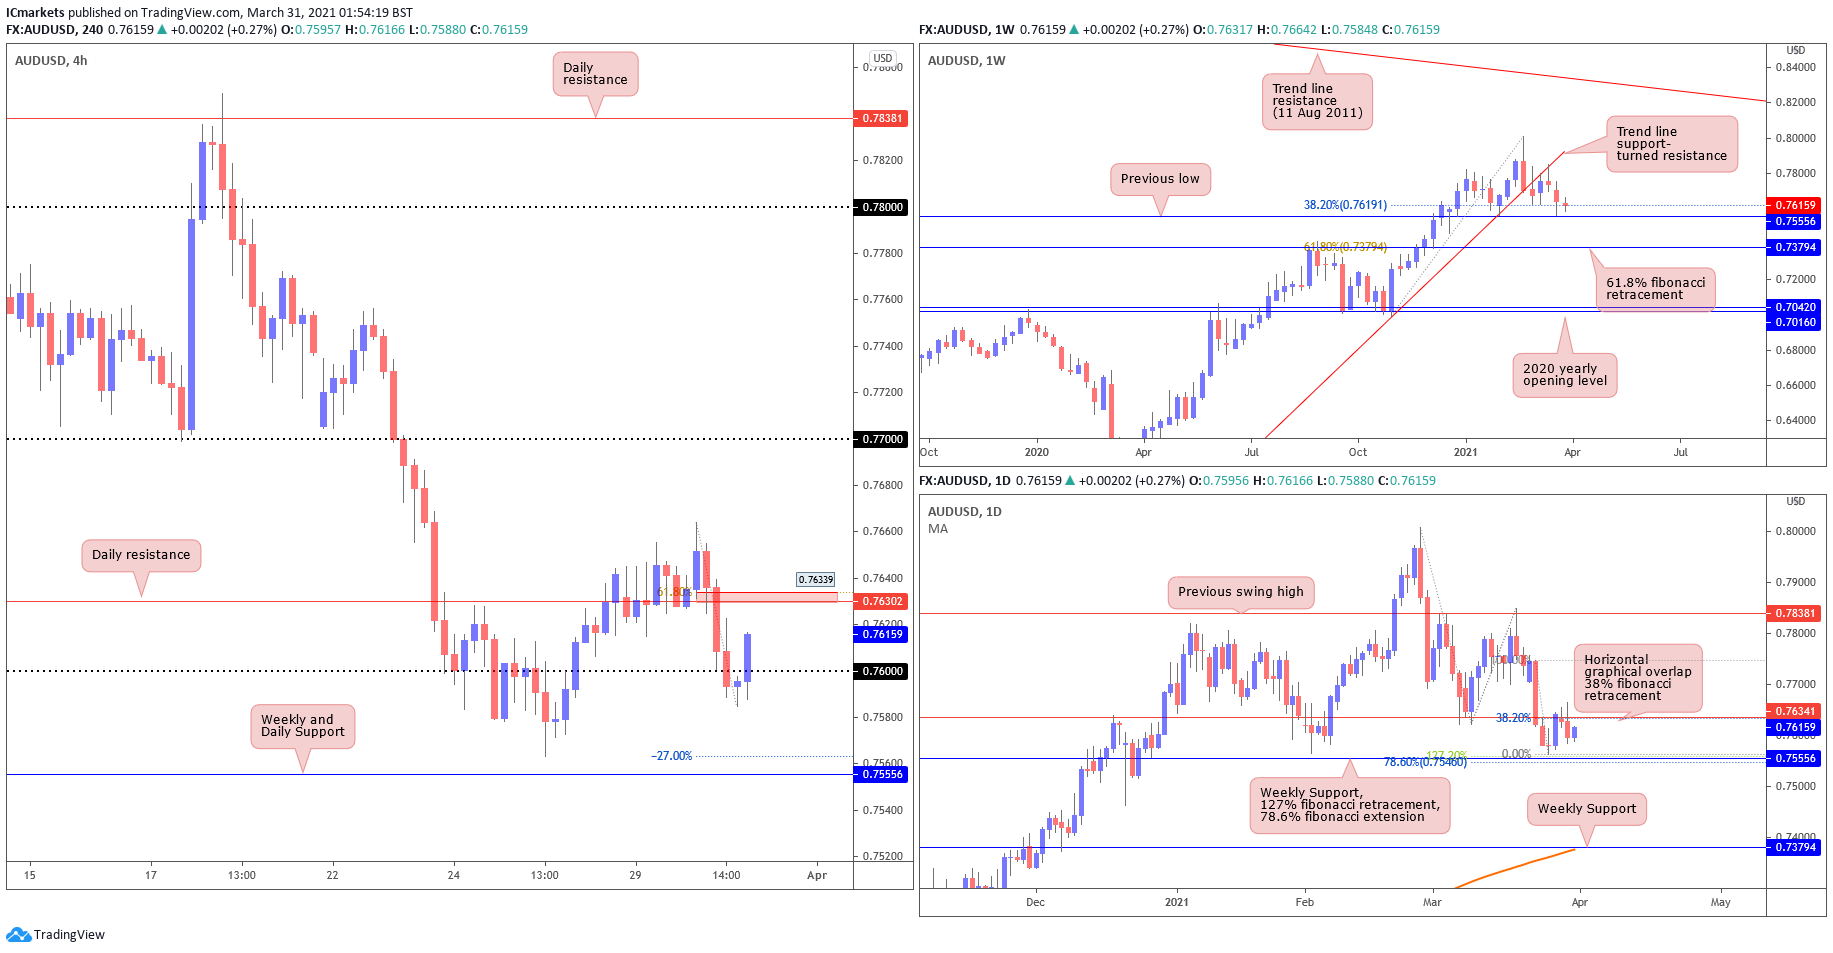
AUD/USD:
From the Weekly timeframe, we can see that the price is trending under the ascending trendline support turned-resistance drawn from 9th March (2020). Currently price has pushed away from the trendline resistance and is holding above the 38.2% fibonacci retracement taken 2nd Nov (2020) swing low, to 22nd Fed (2021) swing high.
On the Daily timeframe, we are seeing a complete head and shoulder pattern where we may expect further drop, price is stil holding beneath the 38.2% fibonacci retracement level. Lastly, on the H4, we may see a pull back towards the Daily resistance and 61.8% fibonacci retracement at 0.76339 before a push down towards the weekly and Daily support level at 0.75556, in line with the -27% fibonacci extension level.
Areas of consideration:
- H4 showing bearish momentum and may find support at 0.75556
- Daily time frame showing more room for downside.
- Weekly time shows price reversed from trendline resistance area.
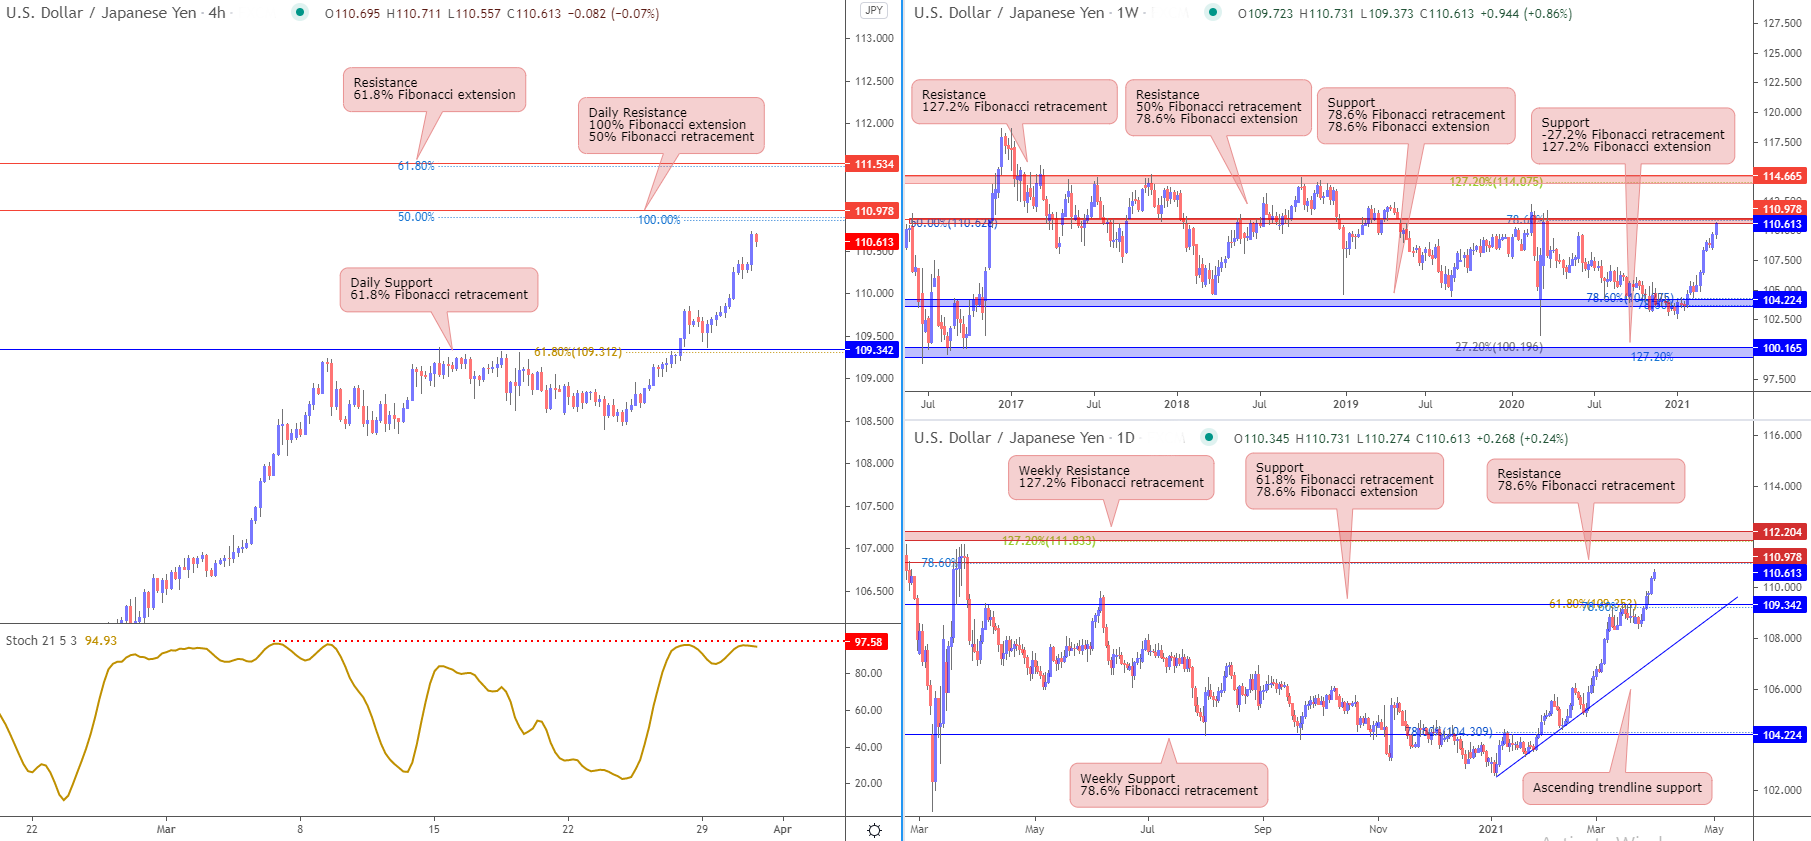
USD/JPY
From the weekly timeframe, prices are facing resistance from horizontal swing high resistance which coincides with 50% Fibonacci retracement and 78.6% Fibonacci extension, taking support from 104.224 level which is in line with 78.6% FIbonacci retracement and 78.6% FIbonacci extension. On the daily time frame, prices are facing resistance from both the horizontal swing high resistance which coincides with 78.6% FIbonacci retracement as well as the 112.204 level which is also the weekly resistance.
On the H4, prices are facing resistance from the daily resistance level of 110.978 which coincides with 100% Fibonacci extension and 50% FIbonacci retracement. Prices might push lower towards 109.342 which is our daily support level, in line with 61.8% FIbonacci retracement. Stochastics is also showing resistance towards 97.58 level, anticipating a push down in prices.
Areas of consideration:
- On the H4, prices might face resistance from 110.978 which is a daily resistance
- 342 is a possible support level
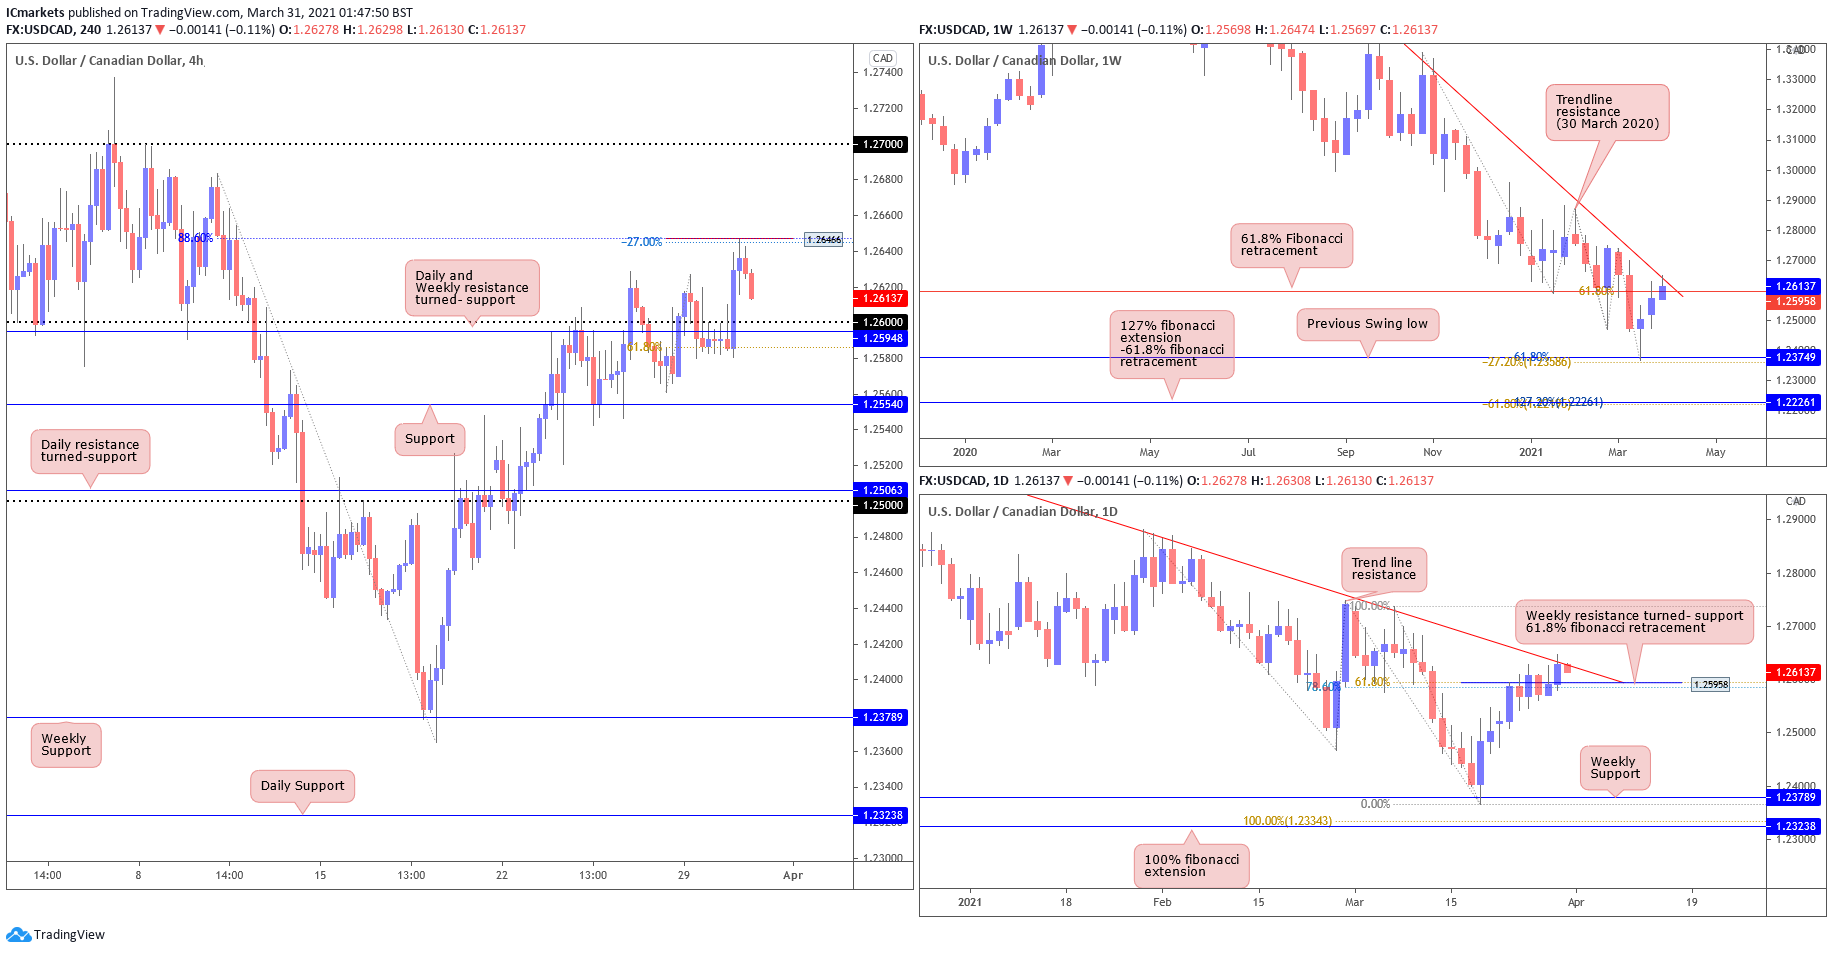
USD/CAD:
Looking at the weekly chart, price has approached the level of 1.25958 in line with 61.8% fibonacci retracement in line with Trendline resistance from 30 March (2020). From here, we may see a reversal from there towards the Previous swing low level at 1.23749.
In the daily time frame, we see that price has closed above the level of resistance and may return to 1.25958 for a retest. Lastly, on H4, as expected we saw that price failed to close beneath the 61.8% fibonacci retracement level where it shot up immediately towards the -27% fibonacci retracement target at 1.26466. And currently, price may drop towards 1.26 major level in line with daily and weekly resistance turn- support where we will consider the next move.
Areas of consideration:
- H4 may drop towards 1.26 major level for retest of previous Daily and Weekly resistance turned-support.
- Daily and weekly time frames are showing long term bearish momentum.
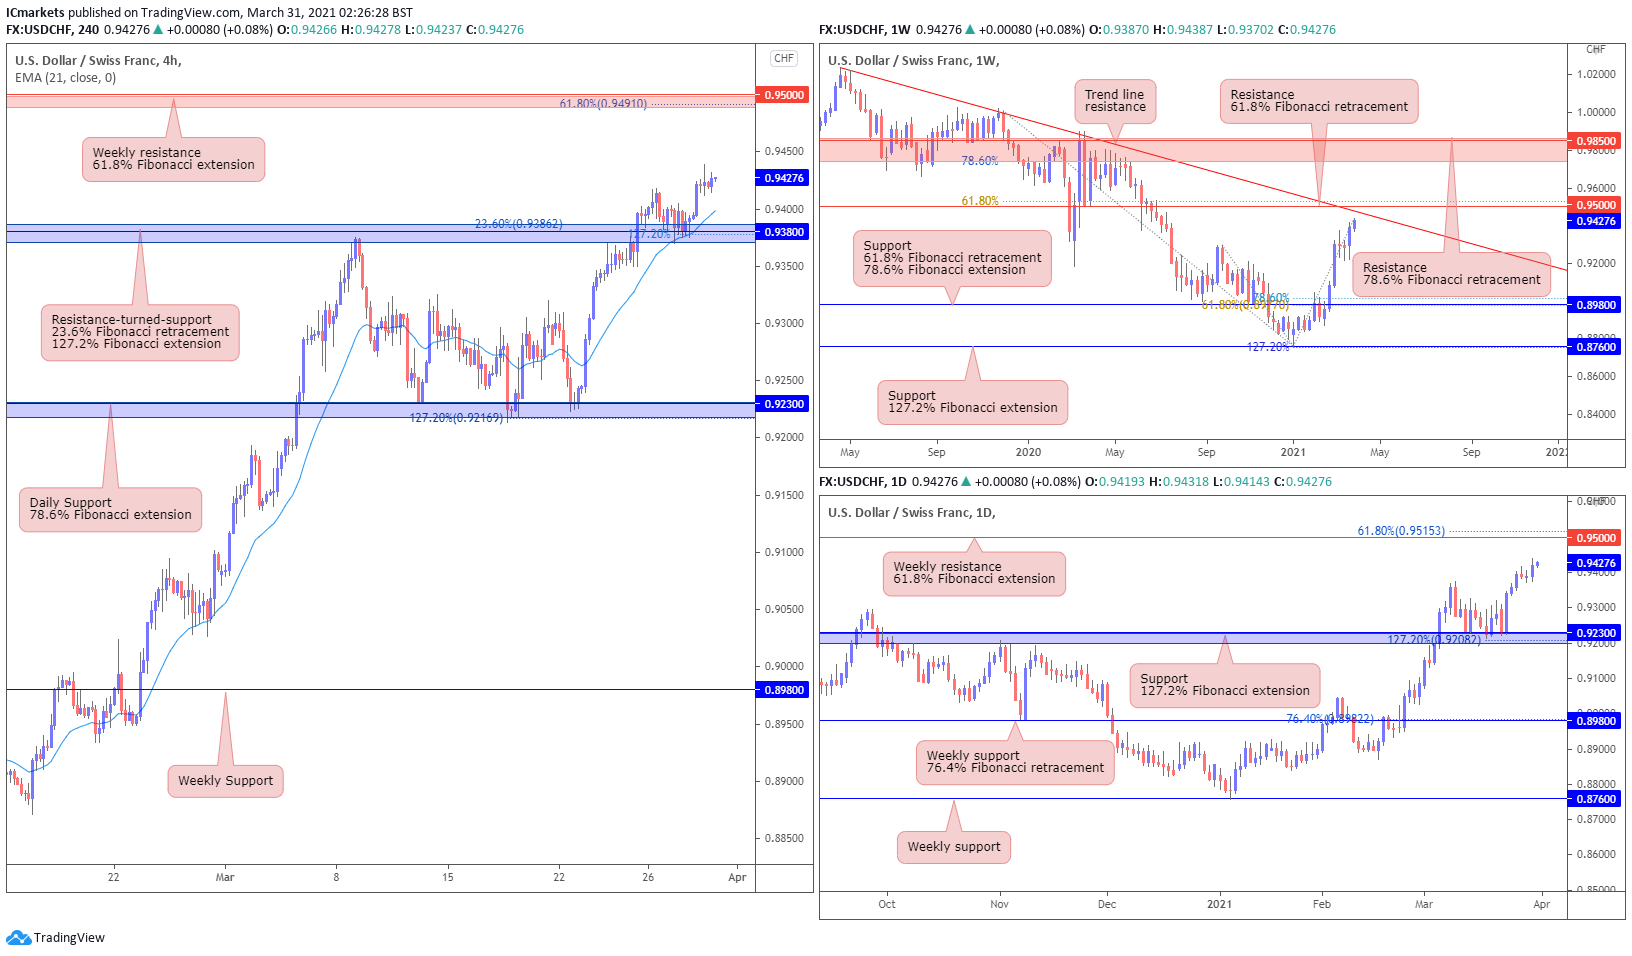
USD/CHF:
USD/CHF continues to approach the weekly 0.95000 resistance level, in line with our 61.8% Fibonacci retracement and descending trendline resistance. The daily chart also shows a further rise above the daily 0.92300 support level as price approaches the key 0.95000 resistance level. We could potentially see price rise further to test the key weekly 0.95000 resistance level.
On the H4 chart, we see that price has bounced from the 0.93800 resistance-turned-support area, in line with our 23.6% Fibonacci retracement and 127.2% Fibonacci extension. We note that price is now holding above the moving average support, in line with our short-term bullish bias. In this scenario, we could potentially see a further rise towards the key weekly 0.95000 resistance level. Otherwise, should price break below 0.93800, we could see a stronger pullback towards the daily 0.92300 support level instead.
Areas of consideration:
- Price bounced from the 0.93800 resistance-turned-support.
- Price could potentially push higher to test the key weekly 0.95000 resistance level.
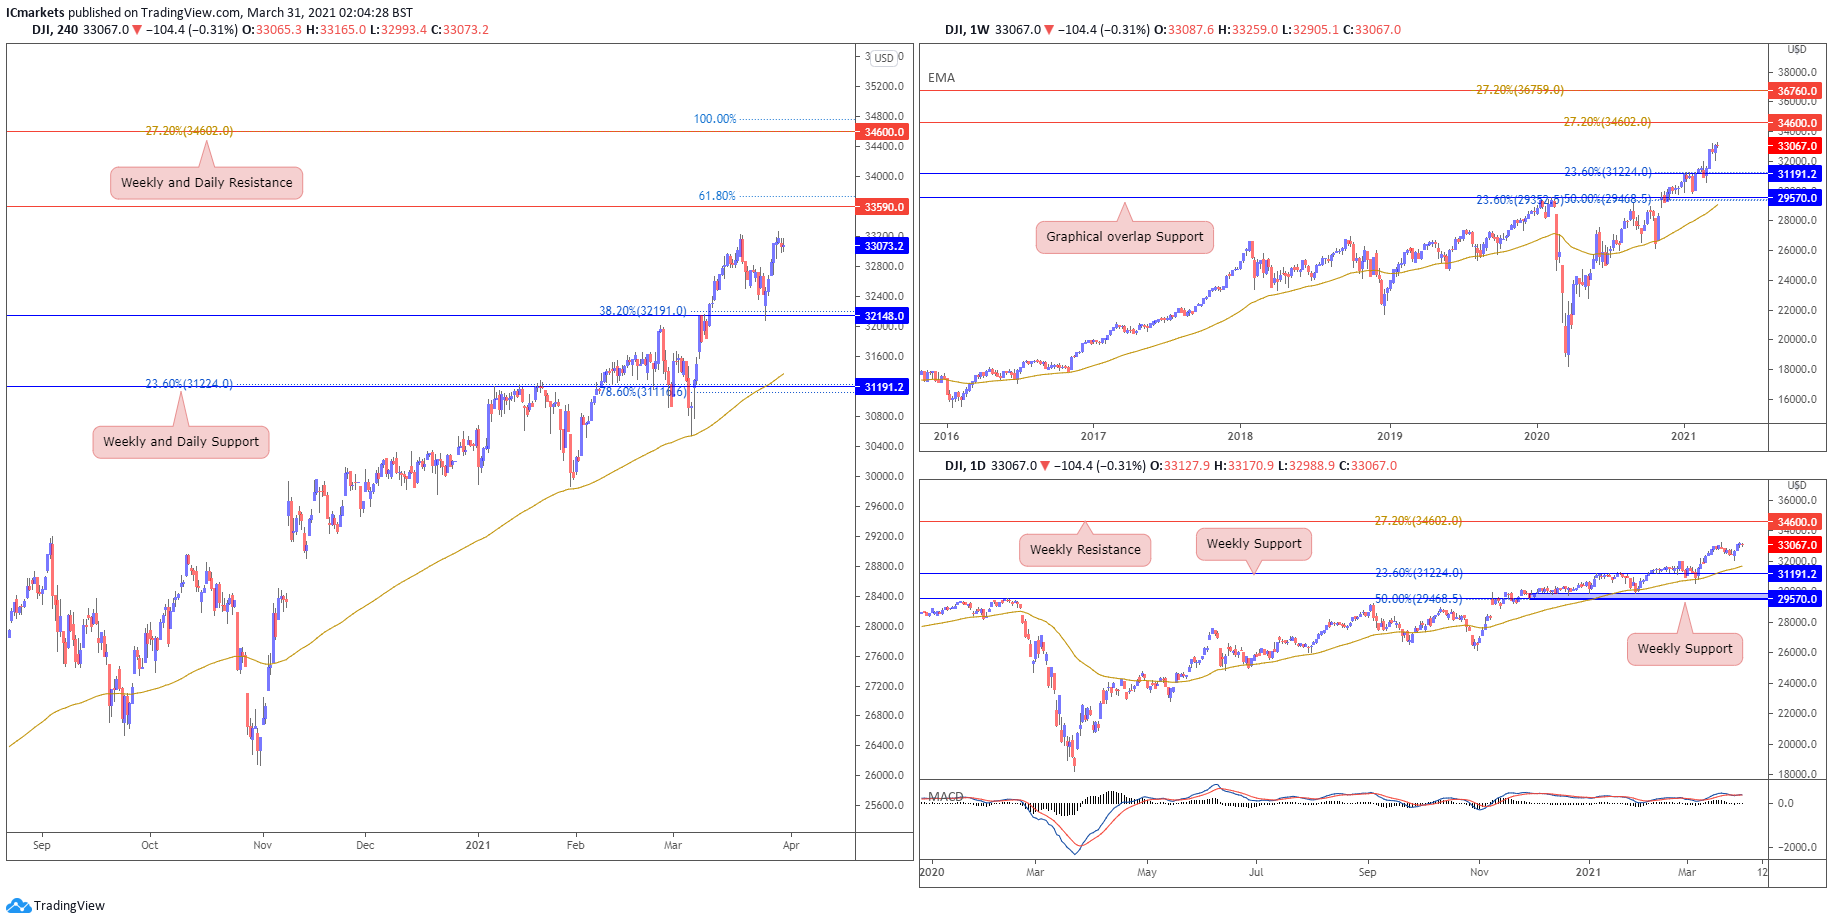
Dow Jones Industrial Average:
On the weekly chart, price continues to hold between 31190 support and 34600 resistance. Traders should continue watching these two long term levels. On the Daily, we see price drifting higher, with technical indicators continue to show room for further bullish upside. Buyers could possibly look to add to their longs on any price pullbacks with possible target at 34600 weekly resistance. Otherwise, failure to hold above 31190 could see price pull back towards weekly support at 29570.
On the H4, price tested and holding around the same level as previous swing high. With long term and short term indicators still showing possible bullish momentum, a limited rise towards 33590 resistance is possible. Sellers can consider adding to their shorts at 33590 to play a short term pullback towards 32148 support. Otherwise, a break above 33590 will see price push higher towards weekly and daily resistance at 34600.
Areas of consideration:
- H4 33590 resistance to watch out for
- Long term and short term indicators show room for further bullish upside
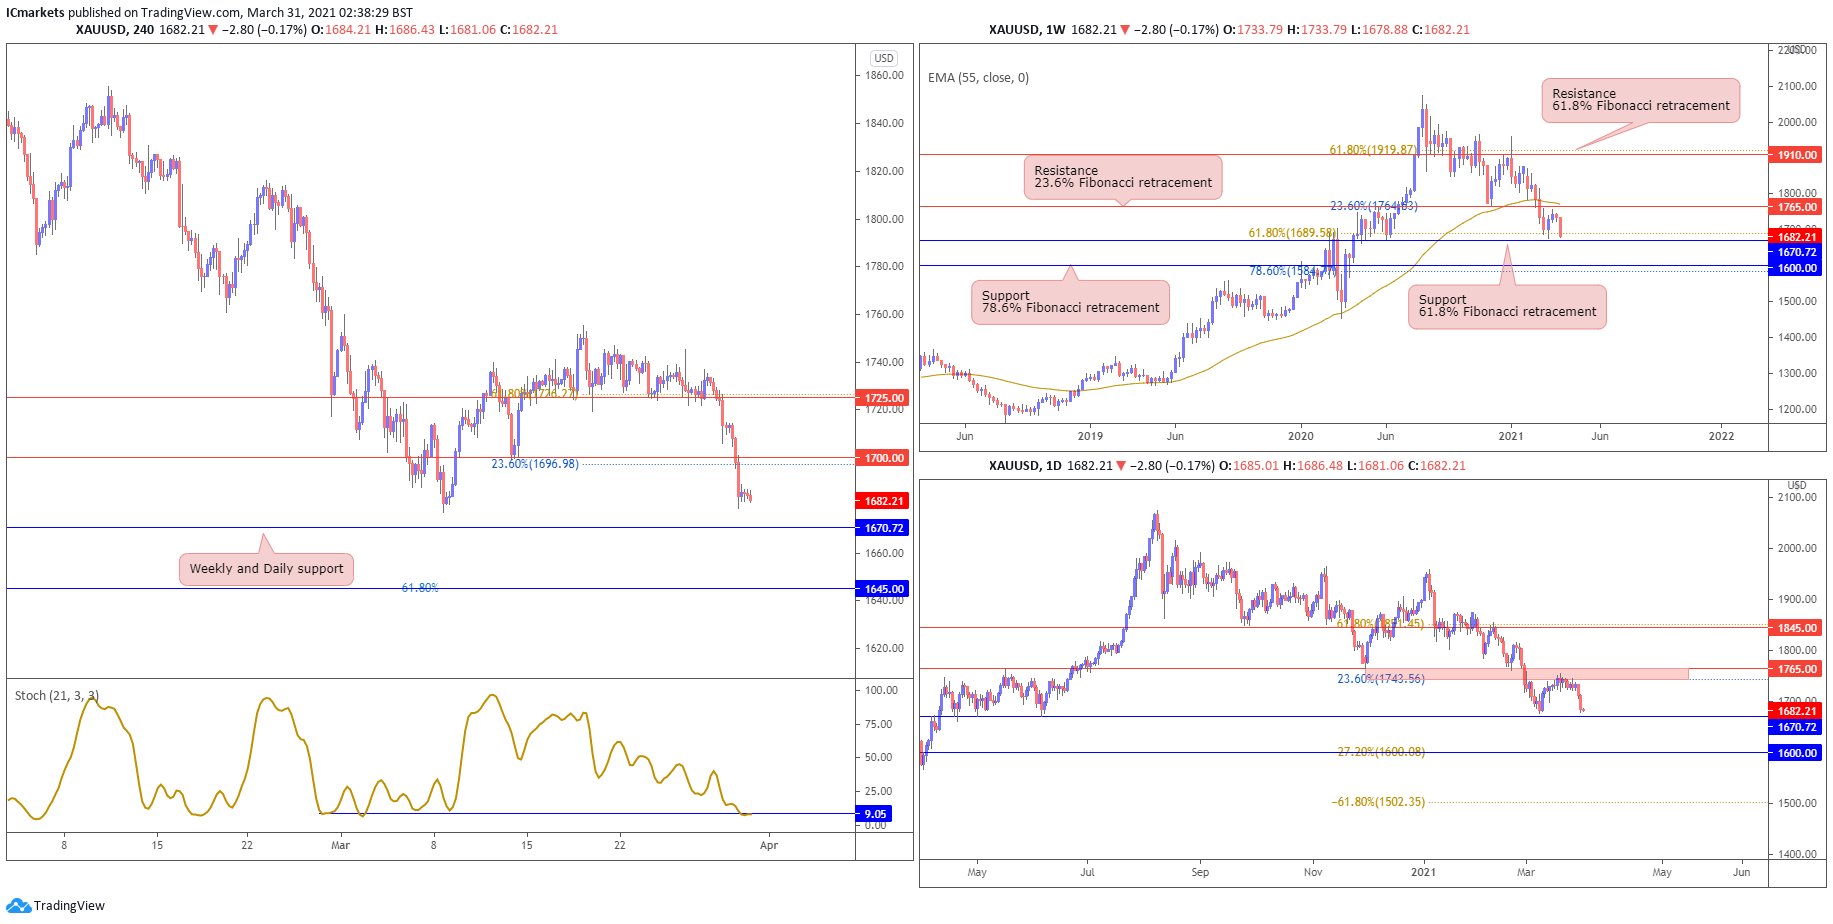
XAU/USD (GOLD):
On the weekly timeframe, gold is currently holding between 1765 resistance and 1670 support. Long term traders should continue to watch these two levels as a break of either will see price swing in that direction. However, we note that the price is still holding below the long term moving average and a break to the downside seems more likely. On the daily chart, we see price drifting lower coming close to 1670 weekly support. Buyers could possibly add to their longs again as this key support level is being tested. Otherwise a break below 1670 support should see price drop further.
On the H4 timeframe, price is coming close to weekly and daily support at 1670. Stochastic is testing support as well where price reacted in the past. We see a low probability intraday bounce opportunity where buyers could play a short term bounce above 1670 support. Otherwise, failure to hold above 1670 should see price drop towards 1645 support next.
Areas of consideration:
- 1670 key support to look out for
The accuracy, completeness and timeliness of the information contained on this site cannot be guaranteed. IC Markets does not warranty, guarantee or make any representations, or assume any liability regarding financial results based on the use of the information in the site.
News, views, opinions, recommendations and other information obtained from sources outside of www.icmarkets.com.au, used in this site are believed to be reliable, but we cannot guarantee their accuracy or completeness. All such information is subject to change at any time without notice. IC Markets assumes no responsibility for the content of any linked site.
The fact that such links may exist does not indicate approval or endorsement of any material contained on any linked site. IC Markets is not liable for any harm caused by the transmission, through accessing the services or information on this site, of a computer virus, or other computer code or programming device that might be used to access, delete, damage, disable, disrupt or otherwise impede in any manner, the operation of the site or of any user’s software, hardware, data or property.


