
Key risk events today:
Spanish Flash GDP q/q; Euro CPI Flash Estimate y/y and Core CPI Flash Estimate y/y; US ADP Non-Farm Employment Change; CAD GDP m/m and RMPI m/m; US Employment Cost Index q/q; Chicago PMI; FOMC Statement, Federal Funds Rate and Press Conference.
EUR/USD:
Europe’s single currency mildly extended its weekly gains Tuesday, as the US dollar concluded the session unchanged, unenthused by slightly weaker-than-expected Core PCE data/firmer-than-expected consumer confidence.
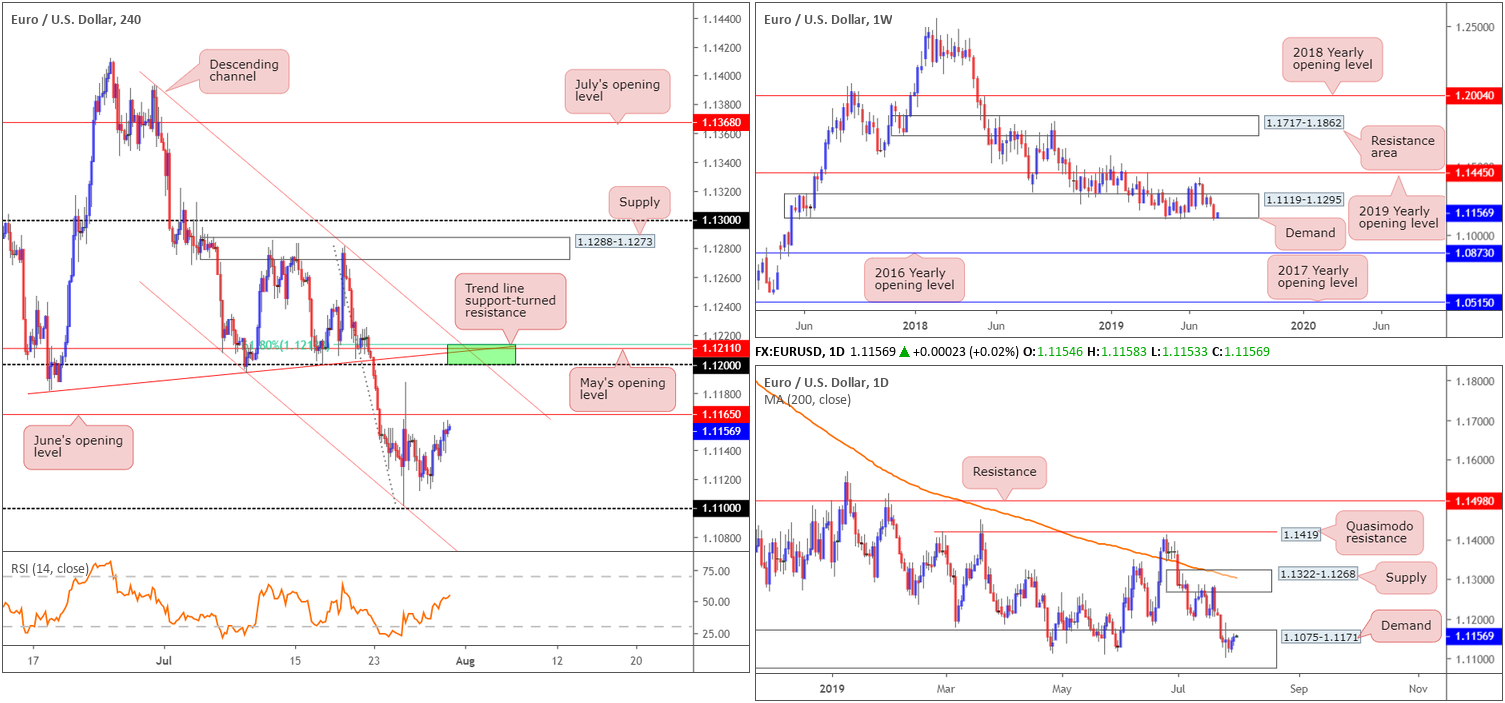
Ahead of the all-important FOMC meeting today, the H4 candles trade within striking distance of June’s opening level (resistance) at 1.1165. Beyond here, the 1.12 handle appears the next logical target, closely shadowed by two trend line resistances (1.1393/1.1181), May’s opening level at 1.1211 and a 61.8% Fibonacci resistance value at 1.1213 (green area). To the downside, we have the 1.11 handle in view as possible support, assuming the unit overthrows local bottoms around the 1.1113 neighbourhood.
From the weekly timeframe, we can see the unit clocked fresh 2019 lows of 1.1101 last week, and marginally surpassed the lower edge of long-standing demand at 1.1119-1.1295 by way of a near-full-bodied bearish candle. Despite this, the market is attempting a modest recovery this week. In the event further selling is observed, though, the 2016 yearly opening level at 1.0873 (support) is next in the firing range.
A closer reading of price action on the daily timeframe reveals the unit is treading water within the walls of demand at 1.1075-1.1171, an area seen hugging the underside of the current weekly demand zone. Further downside this week may entail engulfing the current daily demand zone and making a run for demand at 1.0860-1.0954 (not seen on the screen), whereas a move higher has supply at 1.1322-1.1268 to target.
Areas of consideration:
As traders begin prepping for what the FOMC may bring, the research team notes three possible scenarios:
- The area highlighted above (green) between 1.1213/1.12 offers a stable platform for sellers. Although the area holds limited higher-timeframe confluence, a bounce from here to June’s opening level at 1.1165 is still likely.
- Traders may witness a fakeout through 1.11 (tripping stop-loss orders) to H4 channel support (1.1207). Assuming this plays out and we close back above 1.11, short-term buying opportunities could be on offer (entry and risk levels can be determined on the breakout candle above 1.11).
- Another possibility is a break of the 1.11 handle and the H4 channel support, given weekly buyers are likely fearful around the lower edge of demand at 1.1119-1.1295. For that reason, shorting opportunities beyond the said H4 structures are also an option, preferably as a retest play, targeting 1.10 as the initial target.
GBP/USD:
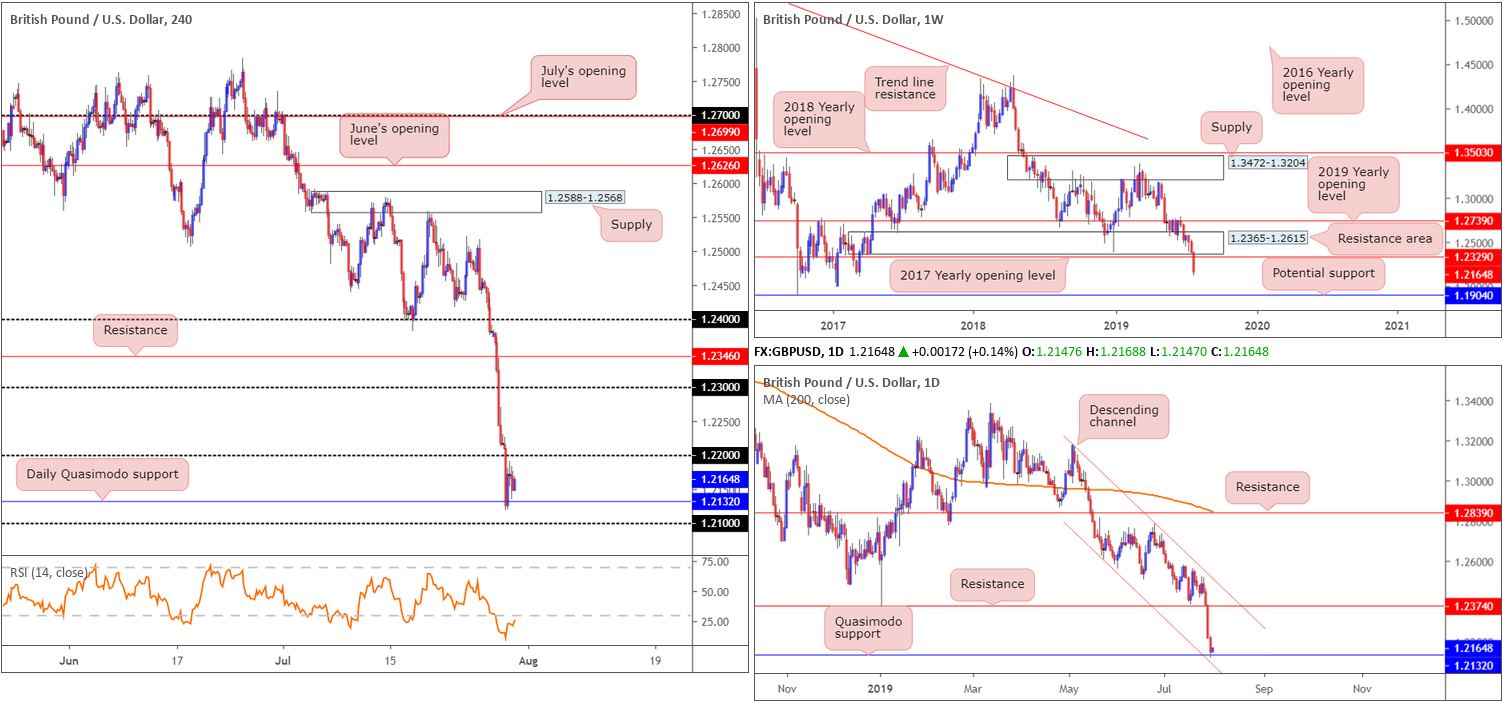
Sterling explored lower ground for a fourth consecutive session Tuesday, amid comments from UK PM Boris Johnson stating he is unwilling to meet with any EU leaders until they agree to remove the backstop. Early trade witnessed the break of 1.22, heavily tripping sell stops which concluded with a run towards daily Quasimodo support at 1.2132.
As is evident from the charts, the aforementioned daily Quasimodo support held firm, bolstered by neighbouring daily channel support etched from the low 1.2605. While according to the daily timeframe we could be in for a correction to resistance at 1.2374, weekly price suggests further losses could be in store. The current weekly candle is establishing ground beneath its 2017 yearly opening level at 1.2329. Limited support is visible on this timeframe, according to our technical studies, leaving space to potentially approach 1.1904, a standout low clocked in early October of 2016.
Areas of consideration:
For traders who read Tuesday’s briefing you may recall the piece had the following to say regarding a possible bounce higher:
Although concerns surrounding Brexit are weighing on the pair right now, the space between the 1.21 handle on the H4 timeframe and the daily Quasimodo support at 1.2132/channel support extended from the low 1.2624 is interesting for a possible bounce higher today. To be on the safe side, traders are urged to wait and see if the H4 candles chalk up a bullish candlestick signal out of 1.21/1.2132 prior to pulling the trigger (entry and risk levels can be determined according to the candlestick’s structure), targeting 1.22 as the initial take-profit zone.
As of yet, a H4 bullish candlestick signal has not developed. However, given 1.22 has also yet to enter the fray, another retest of 1.21/1.2132 may still be on the cards today.
Should the unit continue pressing lower and take out 1.21, as the weekly timeframe suggests, a sell either on the breakout or a retest could also be an idea, targeting daily Quasimodo support at 1.2037 (not visible on the screen), followed by key figure 1.20.
AUD/USD:
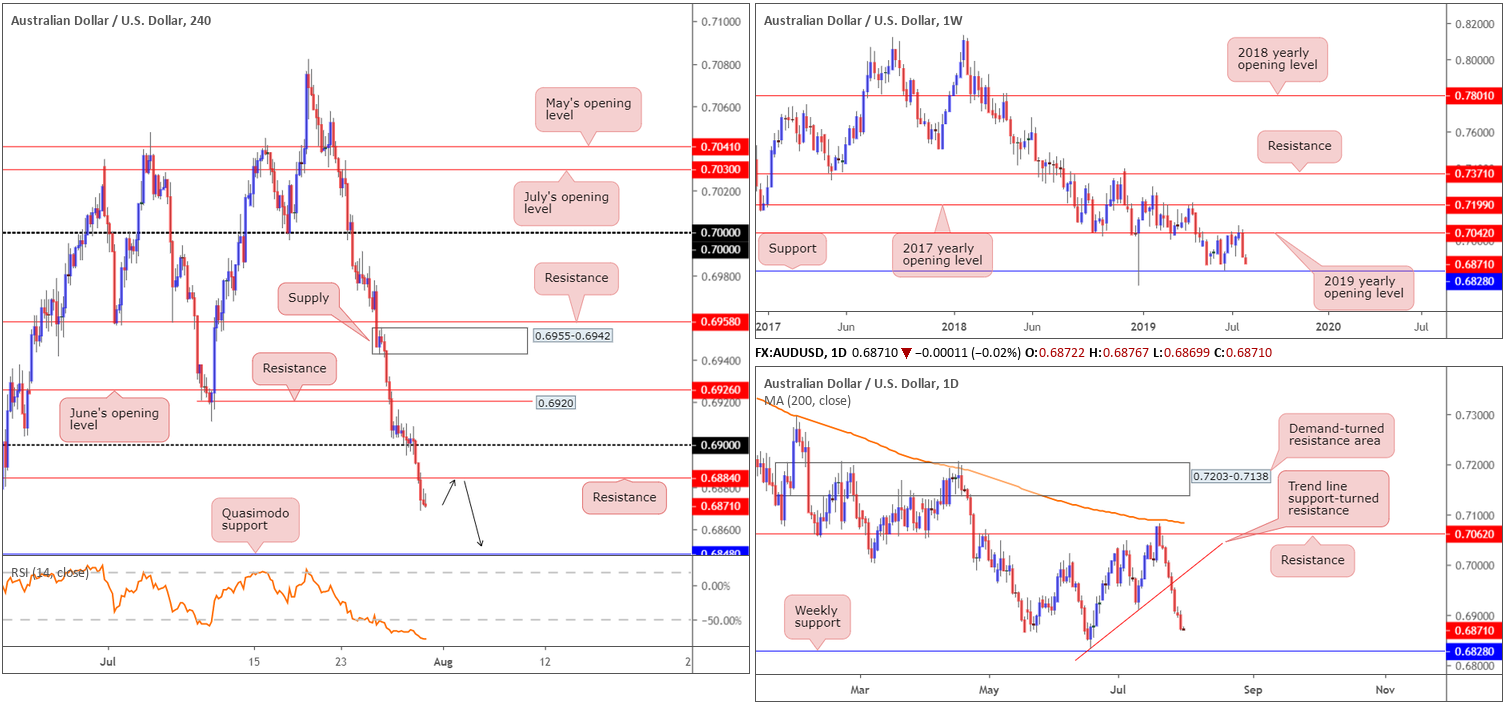
Remaining starved of support, the commodity-linked currency decisively rotated lower against the US dollar Tuesday, recording its eighth consecutive losing session.
Since topping at the 2019 yearly opening level (resistance) drawn from 0.7042 on the weekly timeframe, strong selling has emerged. Serving well as support on several occasions in the past and holding price action lower early July, recent selling from 0.7042 should not be a surprise. The next support target can be seen at 0.6828. In conjunction with weekly structure, daily movement recently crossed beneath trend line support (extended from the low 0.6831) late last week, perhaps clearing the way south towards the noted weekly support level.
In recent sessions on the H4 timeframe, we can also see the candles engulfed 0.69 to the downside and overthrown support (now acting resistance) at 0.6884. Technically speaking, this has potentially set the stage for a run towards Quasimodo support at 0.6848, sited 20 points above weekly support at 0.6828.
Areas of consideration:
Having seen all three timeframes portend further selling, a retest at H4 resistance drawn from 0.6884 (black arrows) could occur today, followed through with a move to 0.6848/0.6828. Conservative traders may opt to wait and see if the H4 candles produce a bearish candlestick signal before pulling the trigger. That way, not only will you have seller intent, you’ll also have structure to base entry and risk levels from.
USD/JPY:
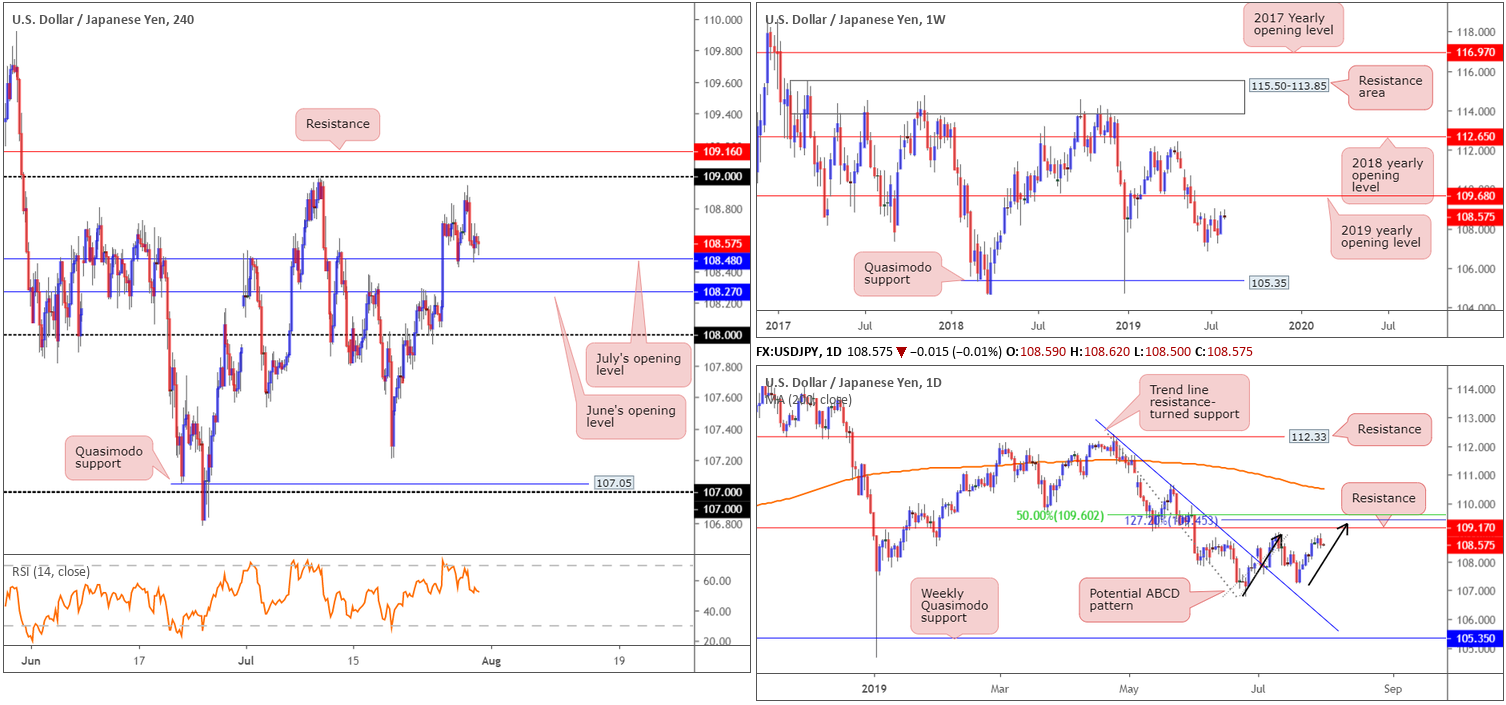
Leaving the 109 handle unchallenged, the USD/JPY dipped lower and reclaimed Monday’s gains Tuesday. Concerns regarding US-China trade talks weighed on market sentiment, consequently ramping up the demand for safe-haven assets. US President Trump scolded China via Twitter for what he said was a failure to follow through on promises to boost agriculture trade, causing trade optimism to fade.
As can be seen on the H4 timeframe, support emerged from July’s opening level at 108.48 once again, though has so far been unable to produce anything meaningful to the upside. Beyond 108.48, June’s opening level resides close by at 108.27, followed by the 108 handle.
On a wider perspective, weekly price has the 2019 yearly opening level at 109.68 offering viable resistance this week – that is assuming we break through the 108.99 July 8 high. To the downside, the 106.78 June 24 low offers possible support, though beyond here the unit exhibits space to run as far south as Quasimodo support at 105.35. Daily price, on the other hand, houses resistance at 109.17, which comes together with a nearby 127.2% ABCD (black arrows) bearish formation at 109.45 and a 50.0% retracement value at 109.60. This, alongside the 2019 yearly opening level at 109.68 on the weekly timeframe, forms a reasonably tight area of resistance to focus on (109.17/109.68).
Areas of consideration:
Higher-timeframe structure on the USD/JPY displays room to rally to at least daily resistance at 109.17, which, as we already know, forms the lower edge of a resistance zone at 109.68/109.17.
On account of this, long opportunities exist above 108.48 on the H4, targeting 109/109.16. The retest of 108.48 could therefore be considered a buying opportunity.
Upon connecting with 109.16, a H4 resistance level, traders are urged to close any long positions and consider selling. The H4 resistance, coupled with the daily resistance zone at 109.68/109.17, provides a strong ceiling in which to short.
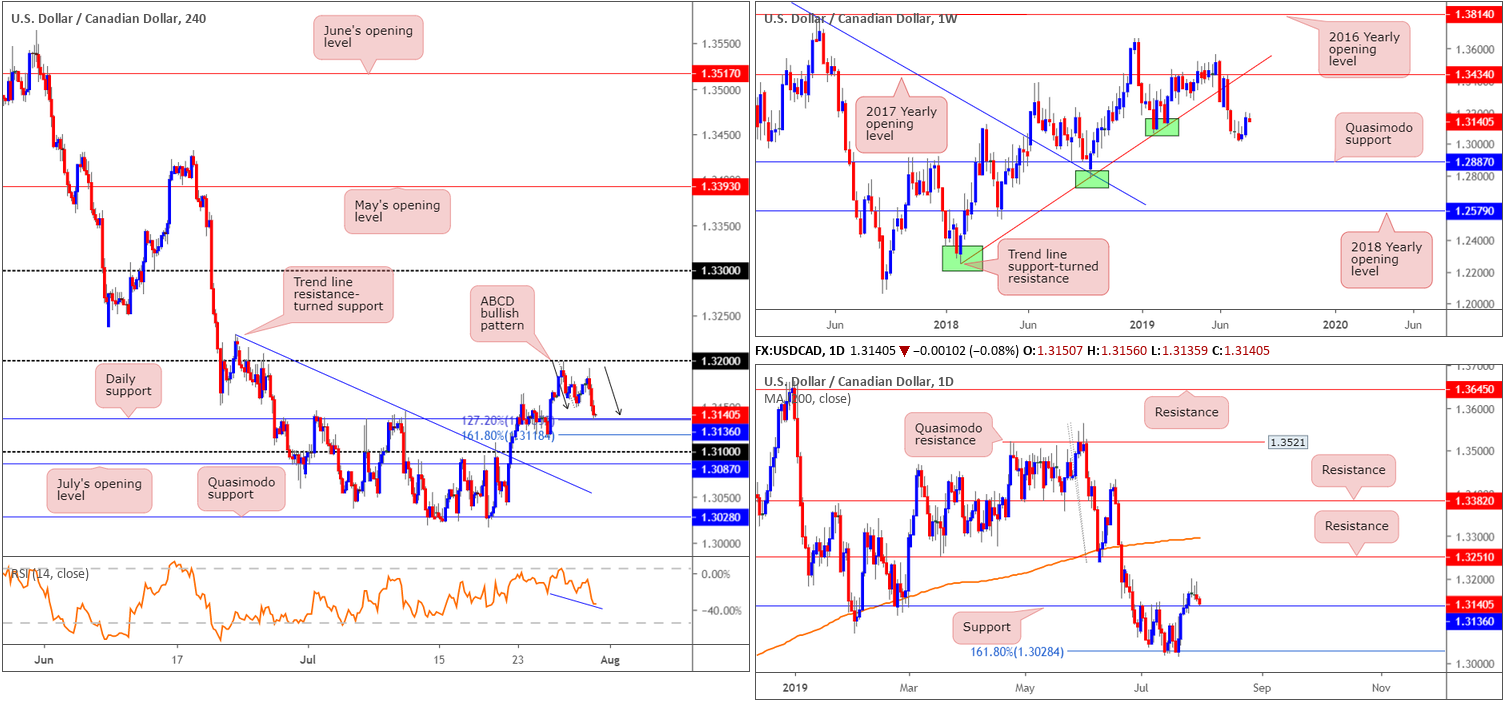
USD/CAD:
Advancing oil prices and a somewhat stale dollar led to a dip lower in USDCAD prices Tuesday, down 0.10%. What’s notable from a technical perspective is recent selling brought the unit to daily support at 1.3136, which, as you can see on the H4 timeframe, also houses an ABCD approach (black arrows) confirmed by positive divergence out of the RSI indicator. By and of itself, this is a worthy long opportunity, with a possible upside target lurking around the 1.32 handle.
Areas of consideration:
Keeping it simple this morning, a long from daily support at 1.3136 is on offer, with protective stop-loss orders tucked beneath the 161.8% H4 Fibonacci ext. point at 1.3118. This, assuming traders target 1.32, offers more than a 1:2 risk/reward ratio.
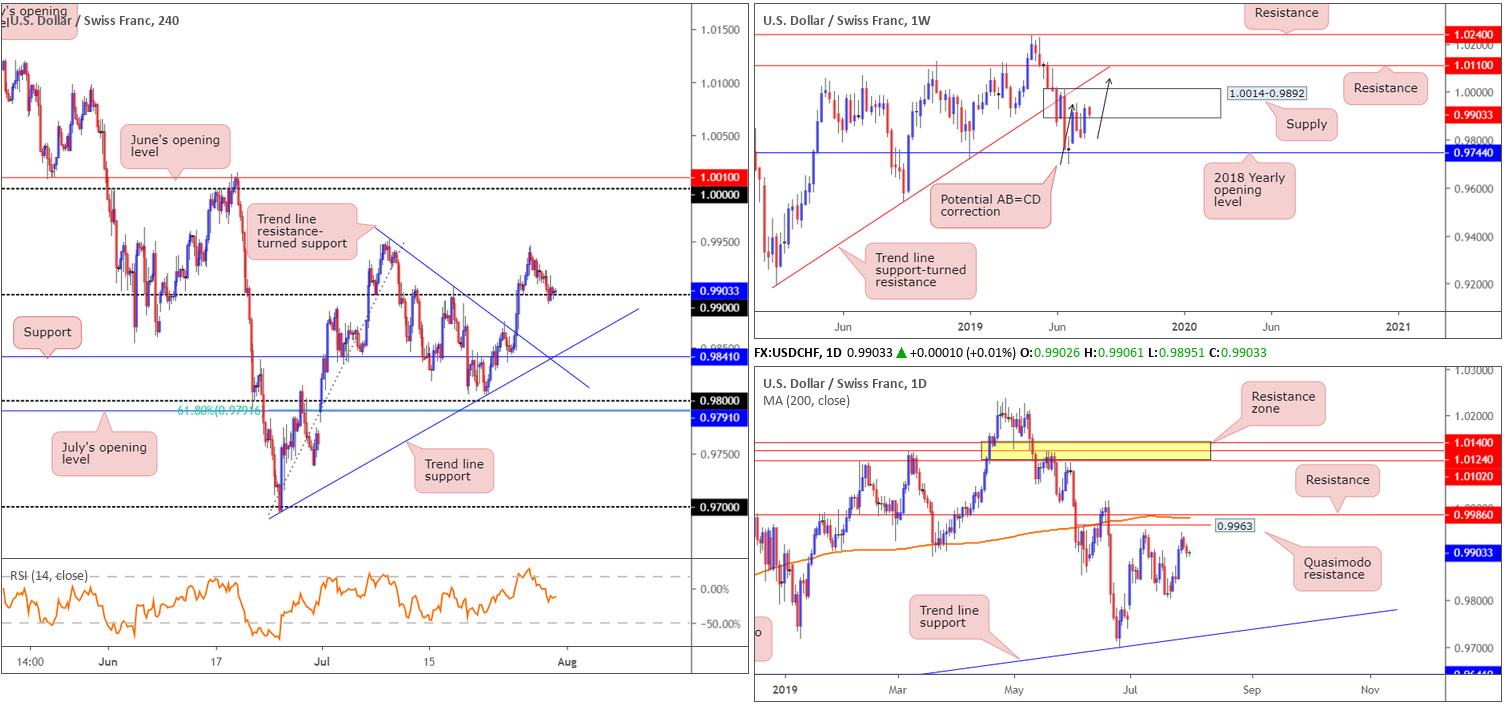
USD/CHF:
Reviving safe-haven demand benefitted the Swiss franc Tuesday, with the US dollar holding steady, unenthused by slightly weaker-than-expected Core PCE data/firmer-than-expected consumer confidence.
The H4 candles settled just north of 0.99 as focus shifts to the highly anticipated FOMC July policy meeting today. Beyond this psychological mark, traders’ crosshairs are likely fixed on the point two trend lines converge (0.9693/0.9951) at support coming in from 0.9841.
In terms of the higher timeframes, Monday’s weekly report had the following to say:
Despite weekly action engaging with the lower limits of supply at 1.0014-0.9892, the unit so far meets the characteristics of a potential AB=CD correction (black arrows) terminating above the area, which happens to align with trend line support-turned resistance taken from the low 0.9187. This is certainly a pattern worth watching as a break above the aforementioned supply will trigger buy stops and thus provide liquidity to sell into from the AB=CD completion at trend line resistance.
Before weekly price completes its AB=CD pattern, we cannot rule out the possibility of resistance entering the mix on the daily timeframe. Just north of current price, the research team notes a Quasimodo resistance at 0.9963, closely followed by resistance at 0.9986 and the 200-day SMA (orange). An engulf of these barriers will likely be enough to prompt buying towards the weekly trend line resistance and associated AB=CD completion, as highlighted above.
Areas of consideration:
Entering long from 0.99 on the H4 timeframe is tricky according to the weekly timeframe which is currently engaging with supply at 1.0014-0.9892. On the other hand, daily price does show room to advance until we connect with daily Quasimodo resistance at 0.9963. Whether or not 0.99 is worthy of a buy is trader dependant, but going up against weekly supply rarely ends favourably.
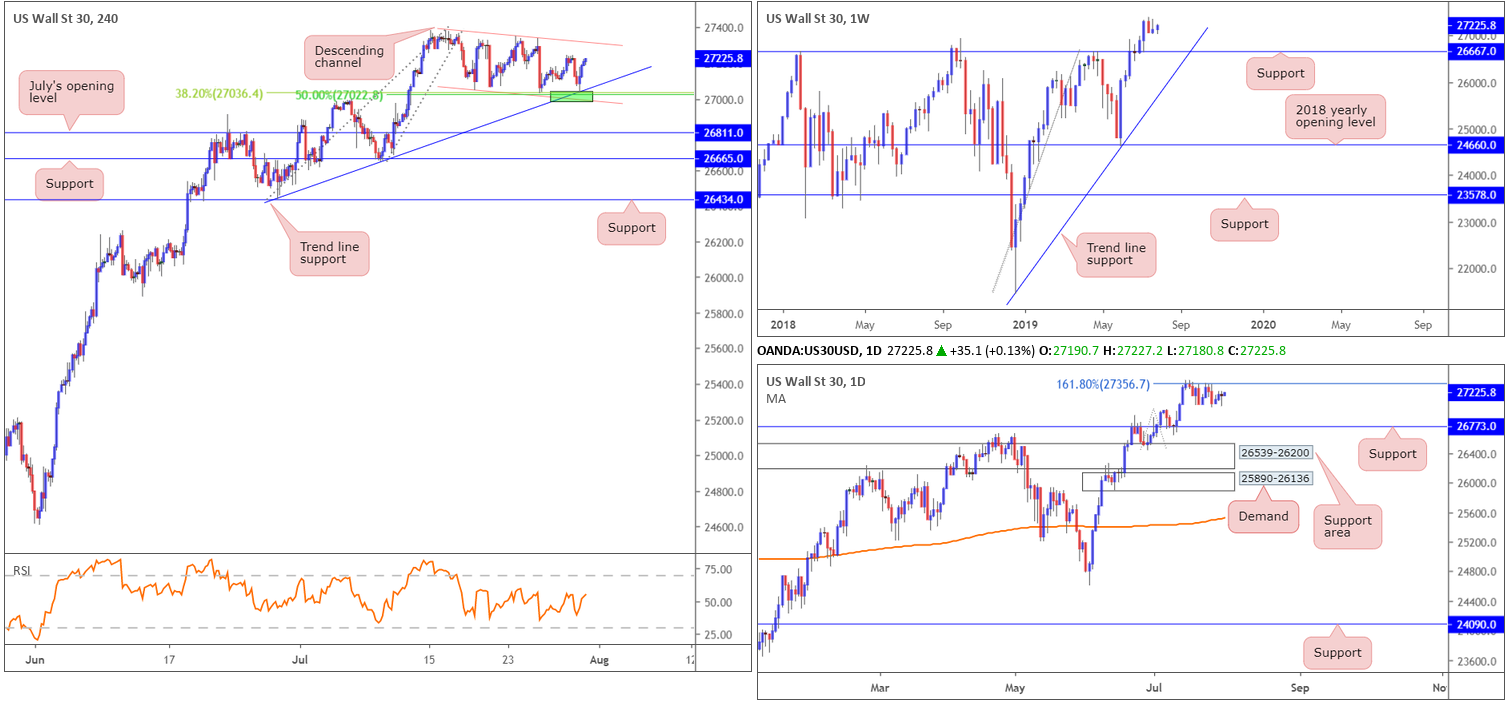
Dow Jones Industrial Average:
US equities declined Tuesday after President Donald Trump criticised China’s handling of key trade talks between the two countries. Trump scolded China via Twitter for what he said was a failure to follow through on promises to boost agriculture trade. The Dow Jones Industrial Average erased 23.33 points, or 0.09%; the S&P 500 lost 7.79 points, or 0.26% and the Nasdaq declined 36.61 points, or 0.46%.
Despite losses across the board, the technical setting on the Dow’s H4 chart was near-perfect for a long. As highlighted in Monday’s weekly report, the H4 candles show a potential buy zone around the 27022 neighbourhood (green – composed of a trend line support taken from the low 26436, a channel support taken from the low 27049, a 38.2% Fibonacci retracement ratio at 27036 and a 50.0% support value at 27022). This followed with an initial upside target set at H4 channel resistance extended from the high 27388, which, as you can see, has yet to hit. Well done to any of our readers who managed to jump aboard this move yesterday. Risk can now be reduced to breakeven and a portion of the position taken off the table.
In terms of where we are on the higher timeframes, here’s Monday’s report:
Since retesting 26667 as support three weeks ago on the weekly timeframe, the index has consolidated gains around all-time highs of 27388. Having seen last week’s candle wrap up the week in the shape of a bearish selling wick, a retest at 26667 is certainly a possibility this week. Failure to hold may also lead to a move being seen towards trend line support extended from the low 21452. However, with limited resistance in sight until connecting with 28070 (not visible on the screen), a 127.2% Fibonacci ext. point taken from the low 21425, additional buying could still come about prior to revisiting 26667.
Contrary to weekly price, daily action remains defending the underside of 27356: the 161.8% Fibonacci ext. point. Continued selling from here has a downside target set at 26773, located just north of weekly support at 26667.
Areas of consideration:
Traders long this market have an initial upside target set at the aforementioned H4 channel resistance, followed closely by daily resistance at 27356. In the event we climb above these barriers, a retest as support could be on offer for additional longs.
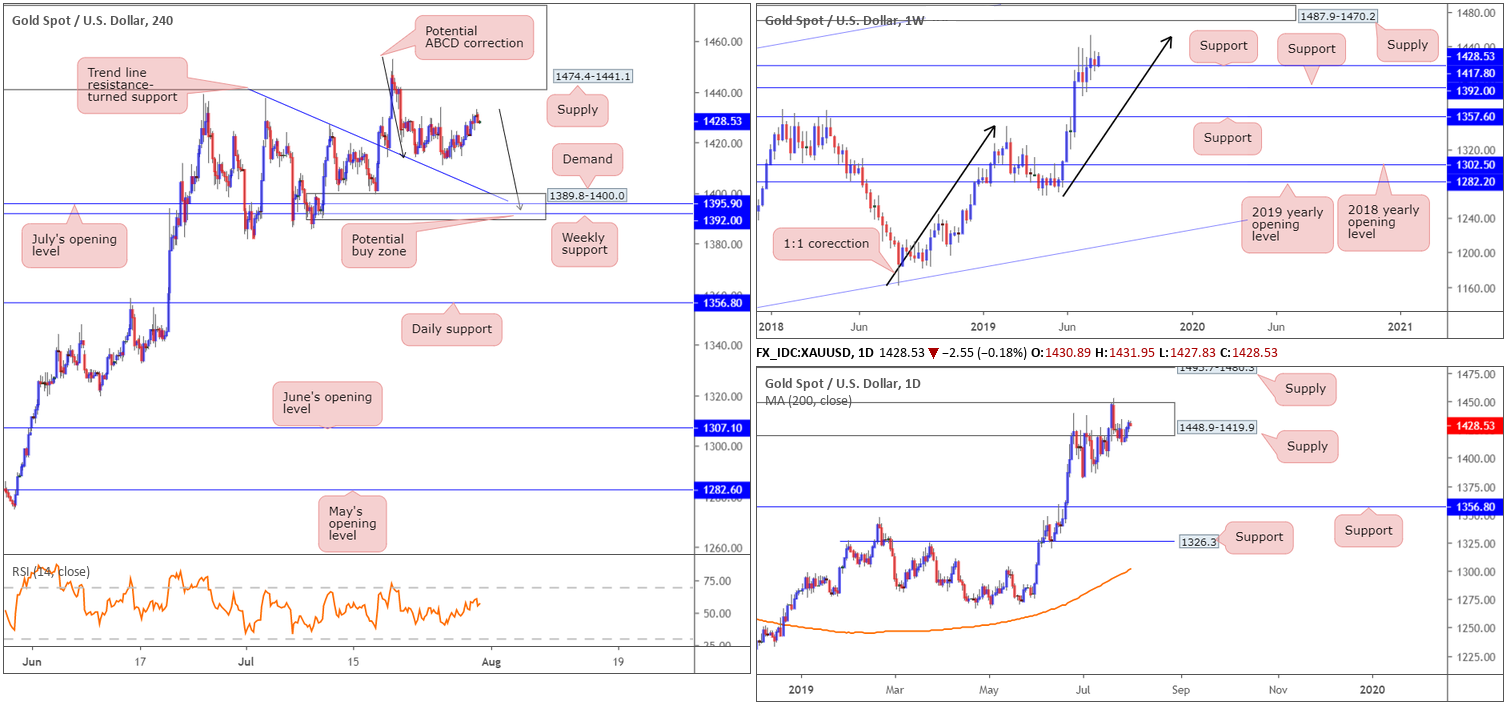
XAU/USD (GOLD):
Kicking off from the weekly timeframe this morning, we can see bullion respecting support at 1417.8, despite recently meeting resistance at a 1:1 correction (black arrows) around 1453.2 shaped from the 1160.3 August 13 low. In the event we do eventually explore ground beneath 1417.8, support at 1392.0 is next on the hit list.
The technical landscape on the daily timeframe observed a break of the top edge of a supply zone at 1448.9-1419.9 in recent trading. While this move was likely enough to trip a portion of the stop-loss orders, it’s unlikely to have cleared the path north to supply at 1495.7-1480.3, given the follow-through selling that has emerged. As for downside targets on this scale, the research team notes to be aware of the 1381.9 July 1 low, followed by support at 1356.8.
H4 traders may wish to acknowledge since crossing swords with a rather large supply zone at 1474.4-1441.1, the price of gold has been gradually declining against the US dollar. In terms of neighbouring support, we have trend line resistance-turned support (extended from the high 1437.7) merging with a striking area of demand coming in at 1389.8-1400.0. Within this zone, July’s opening level at 1395.5 resides as support, as well as weekly support underlined above at 1392.0. What’s also notable is the potential ABCD (black arrows) correction that terminates within the demand’s walls around 1393.6.
Areas of consideration:
Technical outlook unchanged.
Even though the market may observe weekly price advance from support at 1417.8, the research team feels the strength displayed from the weekly 1:1 correction (black arrows) around 1453.2 so far is worthy of attention. For that reason, a break of the current weekly support may still be seen, which will likely lead to a test of weekly support at 1392.0. Note this level is housed within the confines of H4 demand at 1389.8-1400.0, which given its surrounding confluence on the H4 timeframe, is still an ideal location to be scouting for long opportunities.
The accuracy, completeness and timeliness of the information contained on this site cannot be guaranteed. IC Markets does not warranty, guarantee or make any representations, or assume any liability regarding financial results based on the use of the information in the site.
News, views, opinions, recommendations and other information obtained from sources outside of www.icmarkets.com.au, used in this site are believed to be reliable, but we cannot guarantee their accuracy or completeness. All such information is subject to change at any time without notice. IC Markets assumes no responsibility for the content of any linked site.
The fact that such links may exist does not indicate approval or endorsement of any material contained on any linked site. IC Markets is not liable for any harm caused by the transmission, through accessing the services or information on this site, of a computer virus, or other computer code or programming device that might be used to access, delete, damage, disable, disrupt or otherwise impede in any manner, the operation of the site or of any user’s software, hardware, data or property.


