
A note on lower timeframe confirming price action…
Waiting for lower timeframe confirmation is our main tool to confirm strength within higher timeframe zones, and has really been the key to our trading success. It takes a little time to understand the subtle nuances, however, as each trade is never the same, but once you master the rhythm so to speak, you will be saved from countless unnecessary losing trades. The following is a list of what we look for:
- A break/retest of supply or demand dependent on which way you’re trading.
- A trendline break/retest.
- Buying/selling tails/wicks – essentially we look for a cluster of very obvious spikes off of lower timeframe support and resistance levels within the higher timeframe zone.
- Candlestick patterns. We tend to only stick with pin bars and engulfing bars as these have proven to be the most effective.
We search for lower timeframe confirmation between the M15 and H1 timeframes, since most of our higher-timeframe areas begin with the H4. Stops are usually placed 5-10 pips beyond confirming structures.
EUR/USD:
The bearish pulse continues to beat in the EUR/USD market this morning. Despite price finding support from the H4 demand base seen at 1.1153-1.1167, the single currency went on to clock fresh weekly lows and tag a H4 demand area penciled in at 1.1131-1.1143 during the course of yesterday’s sessions. Looking at the higher-timeframe picture, we can see that weekly price is trading from a major resistance area at 1.1533-1.1278, indicating downside is likely to be seen. Be that as it may, on the daily chart the EUR currently occupies a support area at 1.1224-1.1072, which could help support the current H4 demand!
Our suggestions: While a long from this H4 demand is valid given its position on the daily picture (see above), one has to take in account the location of price on the weekly chart! Therefore, to offset this risk, we’d recommend waiting for lower timeframe confirmation (see the top of this report) before pulling the trigger. Should H4 price continue to paint bearish candles, however, a break below and retest of the current H4 demand is also something to keep an eye on since this would likely open the path south down to at least the 1.11 handle.
In addition to the above guys, do keep a close eye on the US ADP Non-farm employment report due out today at 1.15 pm GMT, as this is a strong market-moving indicator where technicals may take a back seat.
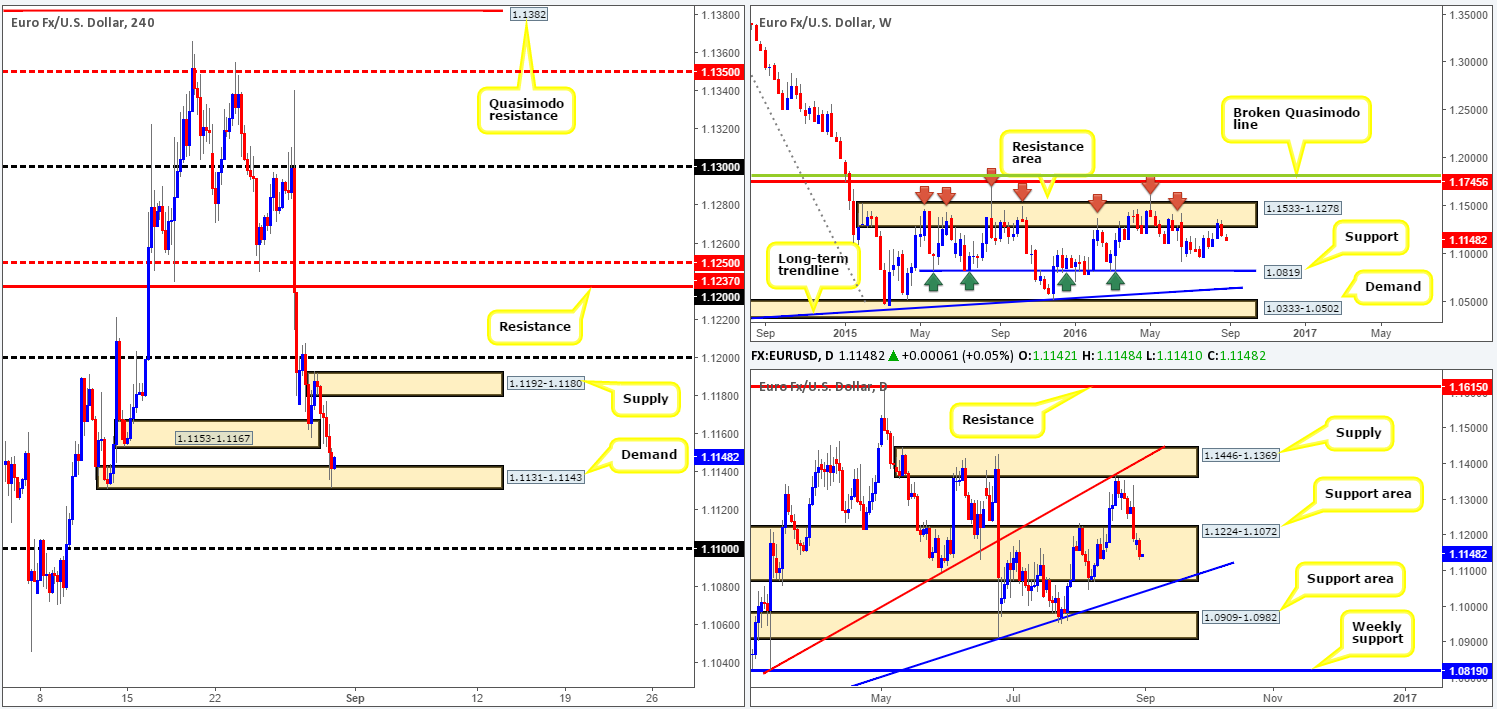
Levels to watch/live orders:
- Buys: 1.1131-1.1143 [Tentative – confirmation required] (Stop loss: dependent on where one confirms this area).
- Sells: Watch for price to close below the H4 demand at 1.1131-1.1143 and then look to trade any retest seen thereafter (lower timeframe confirmation required).
GBP/USD:
In recent trading, we saw that the pound failed to sustain gains beyond the 1.31 handle on two separate occasions. This – coupled with yesterday’s daily candle closing below a support level coming in at 1.3104 (now acting resistance) along with this pair being entrenched within a rather steep bearish trend (seen clearly on the weekly chart), further selling may be seen from the 1.31 band today. The next downside targets on the H4 chart come in at 1.3034: a support level, followed closely by the key figure 1.30.
Our suggestions: A third retest of 1.31 today could provide one a relatively stable area in which to begin hunting for lower timeframe entries to sell this market (see the top of this report). Waiting for an entry on the lower timeframes can, but does not always, help avoid being stopped out on a fakeout, which as we’re sure most are already aware is common viewing around psychological numbers!
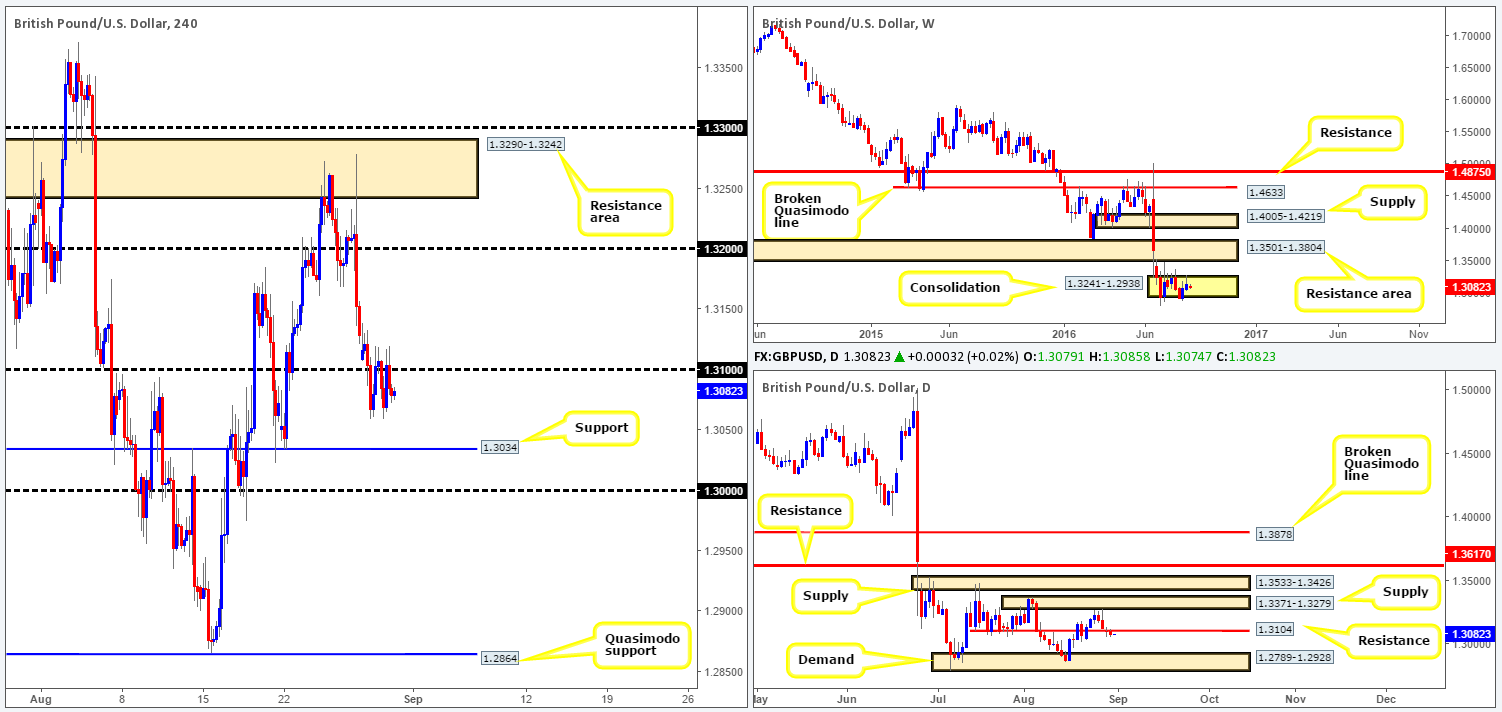
Levels to watch/live orders:
- Buys: Flat (Stop loss: N/A).
- Sells: 1.31 region [Tentative – confirmation required] (Stop loss: dependent on where one confirms this area).
AUD/USD:
Beginning with a quick look at the weekly chart this morning, we can see that following last week’s close beyond support at 0.7604, the commodity-linked currency continues to push south. The next downside target from this angle is a support area coming in at 0.7438-0.7315. Sliding down to the daily chart, nevertheless, price is currently trading around the top edge of a support area drawn from 0.7517-0.7451, which sits just above the aforementioned weekly support area.
Stepping across to the H4 chart, it’s clear to see which side of the market was in control yesterday! Pressured by gold, the pair ended the day touching gloves with the 0.75 handle. Going into this morning’s session, however, the market opened on a relatively strong bid. A H4 bullish close back above the H4 channel support extended from the low 0.7636 could prompt further buying today given the position of price on the daily scale (see above).
Our suggestions: Should the current H4 candle close bullishly, we believe that this is sufficient enough to condone a buy trade in this market (stops placed below trigger candle), targeting the H4 mid-way resistance line 0.7550 as an immediate take-profit target. From here we would strongly advise reducing risk to breakeven since let’s not forget that weekly action could continue to push lower down to the support area seen at 0.7438-0.7315.

Levels to watch/live orders:
- Buys: Watch for a H4 bullish close off of 0.75 for a buy trade (Stop loss: below the trigger candle).
- Sells: Flat (Stop loss: N/A).
USD/JPY:
As can be seen from the H4 chart, the dollar was heavily bid during the course of yesterday’s sessions, consequently pulling prices through the H4 mid-way resistance 102.50 and into the 103 handle by the day’s end.
Despite the strength recently seen in this market, a reversal could be on the horizon as yesterday’s bullish attack also brought prices up to within striking distance of a weekly resistance level coming in at 103.22. Therefore, between 103 and 103.22, a rotation to the downside may be seen. Usually our team would consider entering short at market from this zone given the weekly confluence. However, seeing as how there’s also a daily resistance area lurking just above at 103.50-103.89, a fakeout through the 103/103.22 band may take place!
Our suggestions: Keep an eye on the 103/103.22 region today for a possible sell trade that is supported by a lower timeframe sell signal (see the top of this report), targeting the 102.50 region as your initial target.
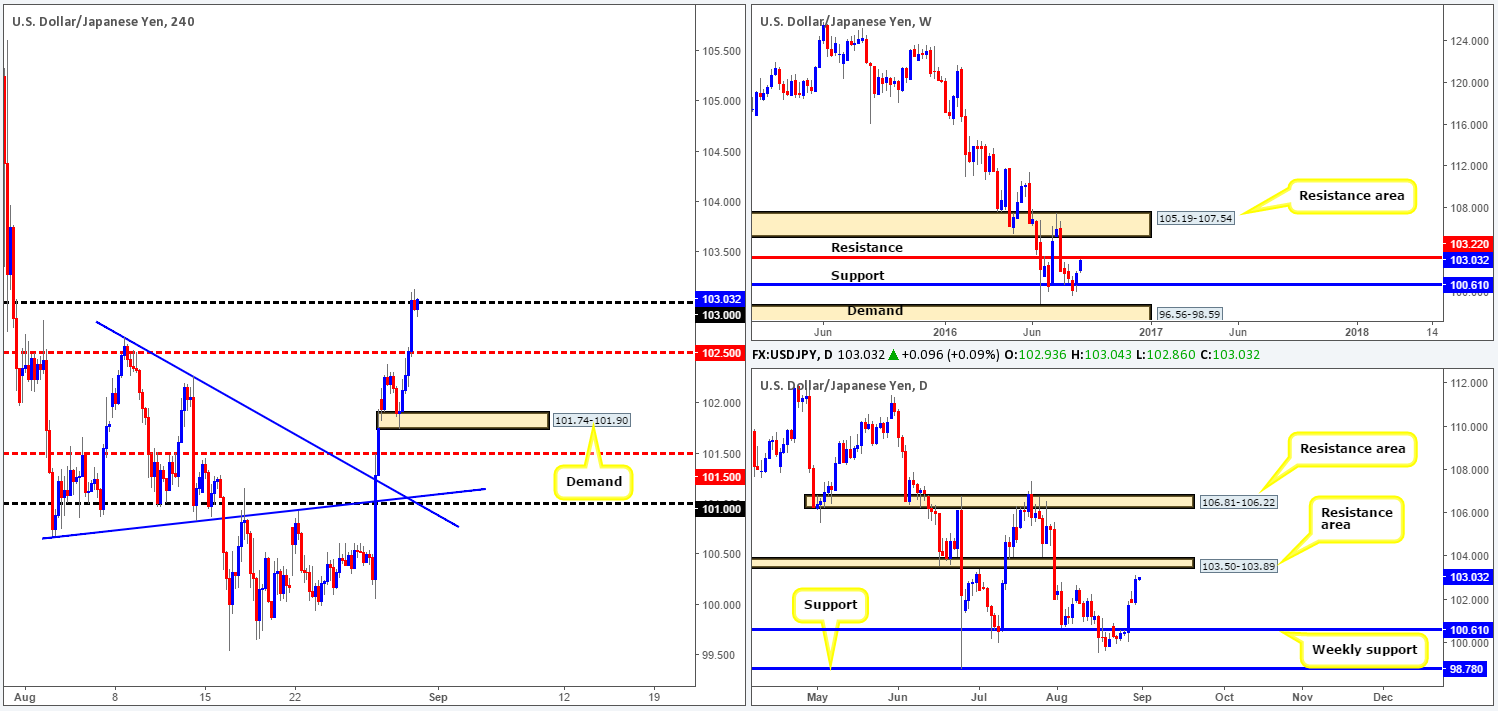
Levels to watch/live orders:
- Buys: Flat (Stop loss: N/A).
- Sells: 103/103.22 region [Tentative – confirmation required] (Stop loss: dependent on where one confirms this area).
USD/CAD:
The USD/CAD pair, as you can see from the daily chart, printed its third consecutive bull candle yesterday, consequently forcing price to shake hands with a trendline resistance extended from the low 1.2460. H4 supply at 1.3079-1.3065 was taken out (now acting demand) with price seen recently closing above the 1.31 handle. In view of weekly price also trading within the confines of a supply zone drawn from 1.3295-1.3017, we feel this market is seriously overbought right now!
Our suggestions: An ideal level to short from, in our opinion, is the H4 Quasimodo resistance barrier penciled in at 1.3147. Not only is this line positioned just above a daily resistance level seen at 1.3135, but it is also located nicely within the above said weekly supply as well! Whether one decides to place a pending sell order at this level (stops above the apex 1.32), or conservatively wait for a lower timeframe sell signal (see the top of this report) is, of course, down to the individual trader.
Should one manage to pin down an entry from this region, immediate take-profit targets can be seen at the 1.31 handle, followed by the H4 demand at 1.3079-1.3065.
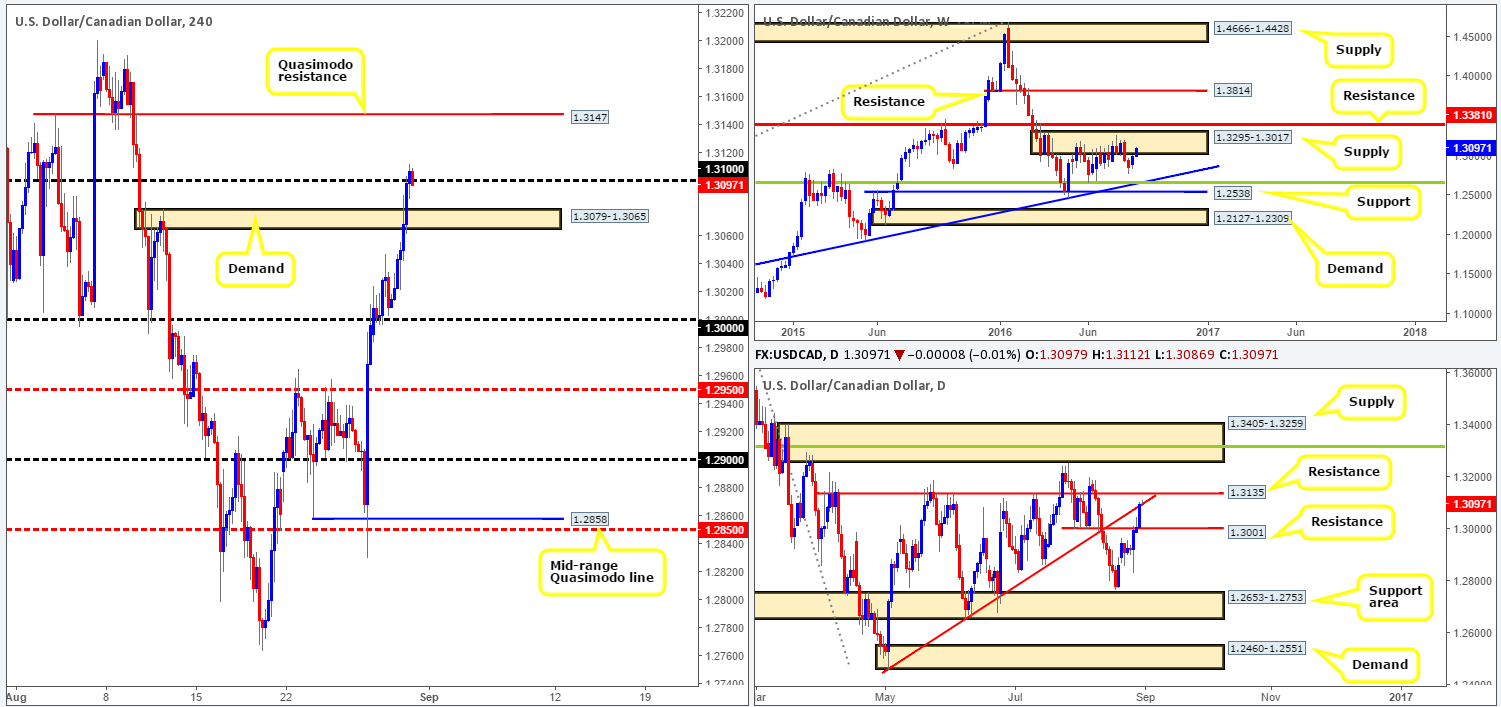
Levels to watch/live orders
- Buys: Flat (Stop loss: N/A).
- Sells: 1.3147 region (Stop loss: above 1.32).
USD/CHF:
Based on recent action, daily price closed above a resistance area carved from 0.9819-0.9784 (now acting support). This will, as far as we can see, likely stimulate further buying in the market this week up towards supply coming in at 0.9956-0.9921, which, as you can probably see, is glued to the underside of a weekly supply zone at 1.0092-0.9928. Now, given the recent bearish rotation seen on the H4 chart from a Quasimodo resistance level at 0.9841, this may force prices to retest the 0.98 handle today.
Our suggestions: In that the higher-timeframe structures indicate further buying may be on the cards this week; we have our eye on the 0.98 handle for possible long trades today. This level is firmly planted within the above said daily support area, thus increasing the chances of a reversal being seen from this number. For those wishing to enter here at market, we would advise placing stops below the daily support area around the 0.9776ish range. For those who prefer the more conservative route, however, waiting for the lower timeframes to prove buying interest resides around the 0.98 figure, would, in our opinion, be the best path to take.
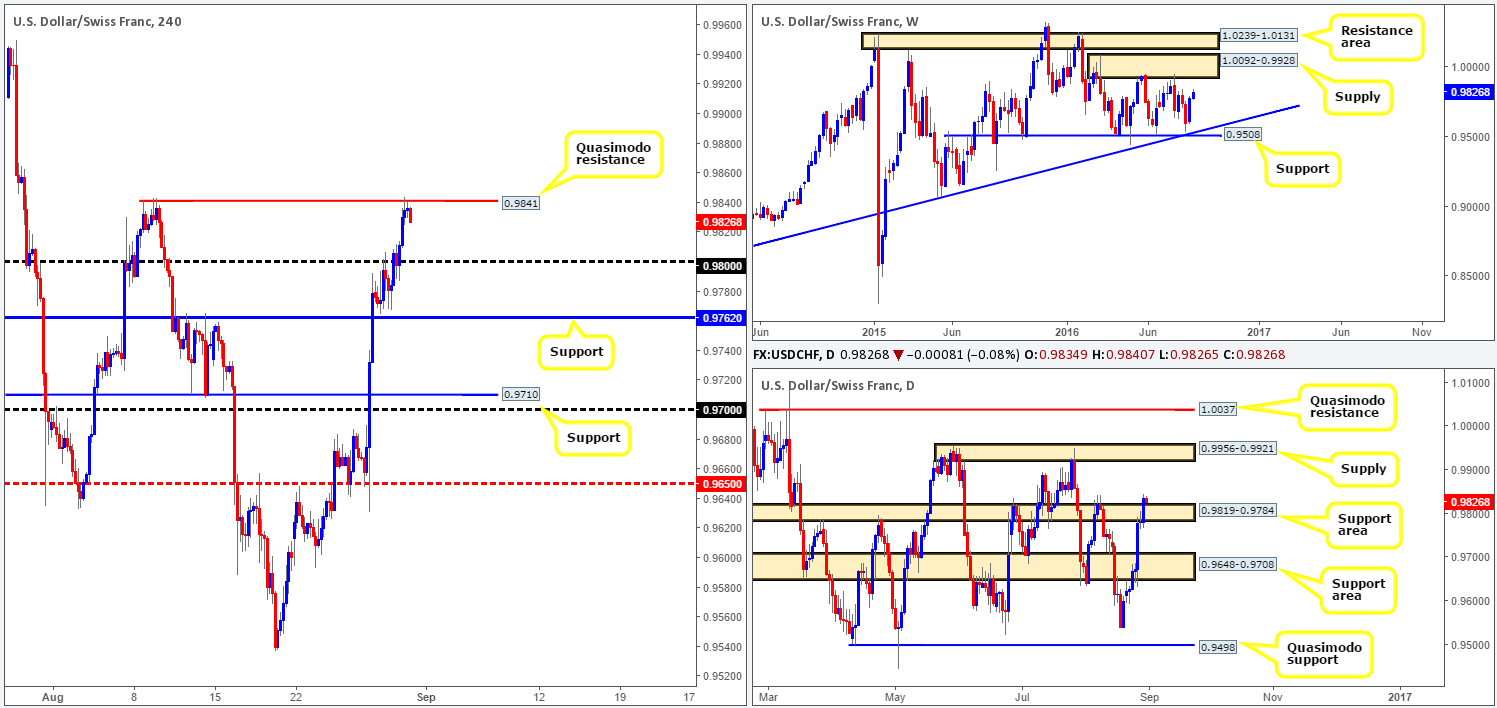
Levels to watch/live orders:
- Buys: 0.98 region (Possible stop-loss placement: 0.9776).
- Sells: Flat (Stop loss: N/A).
DOW 30:
Since weekly candles struck the top edge of the support area seen at 18365-18158, the buyers have yet to print any meaningful response. Ideally, what we’re looking to see from this zone is a push to fresh all-time highs. Looking down to the daily chart, the buyers and sellers are currently trading within a relatively large consolidation zone fixed between 18322/18636 (yellow zone). Due to the position of price on the weekly chart, we favor an upside break here.
Moving across to the H4 chart, we can see that Monday’s advance north topped out around the 18515ish region, which eventually sent prices south on Tuesday to lows of 18407. With these points in mind, the levels we currently have on our radar are as follows:
- The H4 demand at 18321-18349. This area held beautifully on Friday and is located around the lower edge of the above said daily range.
- H4 demand seen at 18259-18283. Sits just below the current daily range, but surrounds a nice-looking broken daily Quasimodo line at 18279.
- Three H4 Quasimodo resistances: 18579/18599/18639. Combined they represent the top edge of the above noted daily range.
Considering that the two H4 demands are also situated within the aforementioned weekly support area, we believe these areas have a far better chance of holding than the above said H4 Quasimodo resistance levels. Therefore, do trade with caution around the H4 Quasimodo lines and remember that you can always resort to waiting for lower timeframe confirmation (see the top of this report) when unsure!
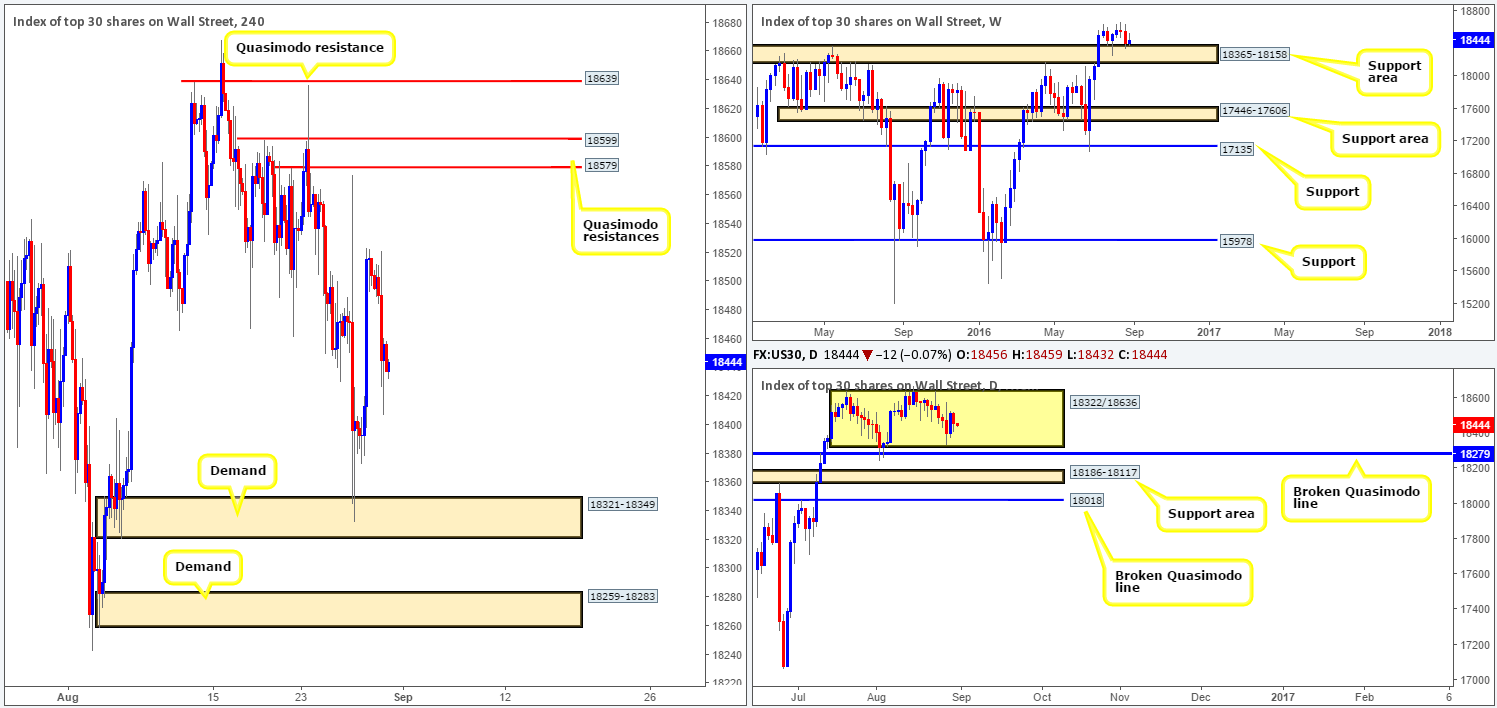
Levels to watch/live orders:
- Buys: 18321-18349 [Tentative – confirmation preferred] (Stop loss: dependent on where one confirms this area). 18259-18283 [Tentative – confirmation preferred] (Stop loss: dependent on where one confirms this area).
- Sells: 18579/18599/18639 [Tentative – confirmation required] (Stop loss: dependent on where one confirms these areas).
GOLD:
Bolstered by an overall stronger dollar the yellow metal plunged lower yesterday, resulting in price taking out a H4 support area at 1315.6-1319.6 and eventually shaking hands with a H4 support level at 1310.3 going into the close. This support, along with the top edge of the weekly support area at 1307.4, was a noted buy zone in our previous report. Well done to any of our readers who managed to lock down a position from here.
With gold now seen trading within touching distance of the recently broken H4 support area (now acting resistance), where does one go from here? Well, with the weekly chart showing the metal trading nearby a support area at 1307.4-1280.0 as well as daily price also seen trading within a demand base at 1305.3-1322.8, the current H4 resistance area may be engulfed sometime this week.
Our suggestions: As far as we can see, we have higher-timeframe technicals suggest buying the metal, and H4 technicals showing little space to move north given the current H4 resistance area and also a nearby H4 supply seen just above it at 1325.3-1322.8. Therefore, until there is a clear space for price to move is seen, opting to stand on the sidelines today may very well be the best path to take.
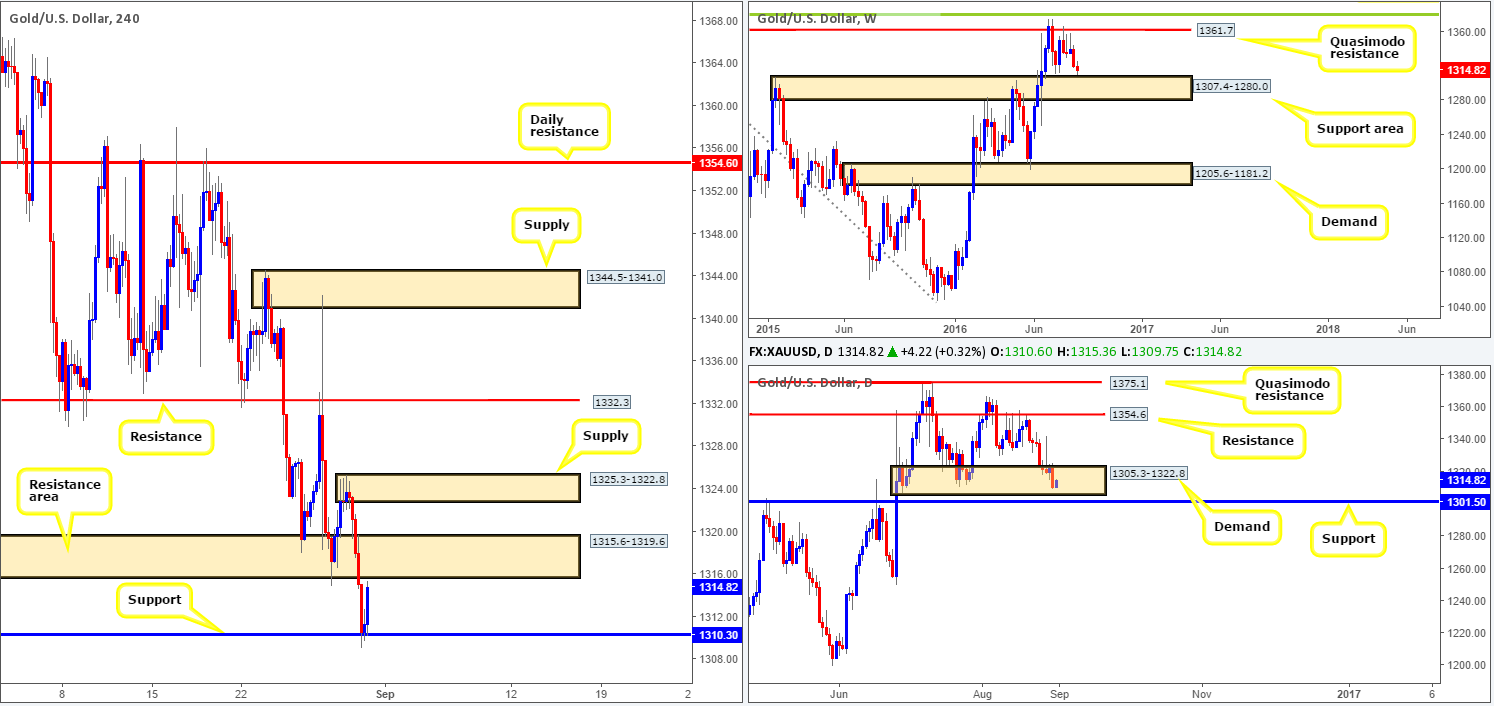
Levels to watch/live orders:
- Buys: Flat (Stop loss: N/A).
- Sells: Flat (Stop loss: N/A).


