Wednesday 30th March: Daily technical outlook and review.
A note on lower timeframe confirming price action…
Waiting for lower timeframe confirmation is our main tool to confirm strength within higher timeframe zones, and has really been the key to our trading success. It takes a little time to understand the subtle nuances, however, as each trade is never the same, but once you master the rhythm so to speak, you will be saved from countless unnecessary losing trades. The following is a list of what we look for:
- A break/retest of supply or demand dependent on which way you’re trading.
- A trendline break/retest.
- Buying/selling tails – essentially we look for a cluster of very obvious spikes off of lower timeframe support and resistance levels within the higher timeframe zone.
- Candlestick patterns. We tend to only stick with pin bars and engulfing bars as these have proven to be the most effective.
For us, lower timeframe confirmation starts on the M15 and finishes up on the H1, since most of our higher timeframe areas begin with the H4. Stops usually placed 5-10 pips beyond your confirming structures.
EUR/USD:
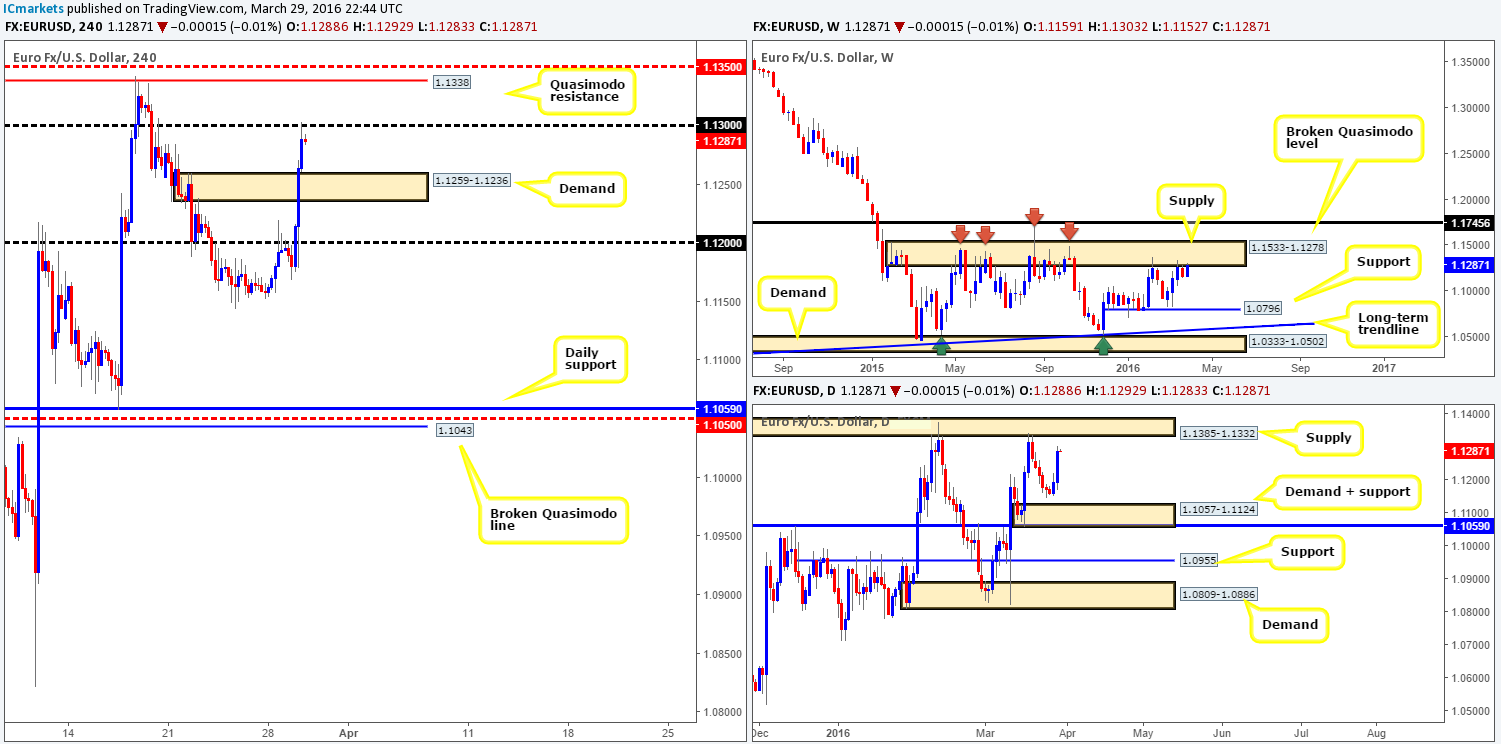
The value of the EUR strengthened in aggressive fashion on Tuesday following Dovish comments from Federal Reserve Chair Janet Yellen. H4 supply at 1.1259-1.1236 (now acting demand) was completely annihilated, which saw price attack offers around psychological resistance 1.1300 by the day’s end.
Despite yesterday’s bullish attack, the technical picture remains bearish. Over on the weekly chart, supply at 1.1533-1.1278 has once again been brought into the picture. This area has held this market lower since May 2015 so it is not a zone to take lightly! Down on the daily chart, price is seen trading within shouting distance of supply coming in at 1.1385-1.1332 (glued within the aforementioned weekly supply).
With the above points in mind, battle lines going into today’s sessions are as follows:
- The 1.1300 figure. This level, considering it sits within the above said weekly supply, may be line to trade from today. Nevertheless, we would highly recommend only entering short from here alongside lower timeframe confirmation due to the daily chart showing room to advance to supply at 1.1385-1.1332.
- The H4 Quasimodo resistance line at 1.1338 together with the H4 mid-level barrier above at 1.1350. Both hurdles sit beautifully within the noted weekly and daily supplies, and taking into account the reaction seen from the H4 Quasimodo barrier on the 17th March, this is certainly an area to keep an eyeball on for sell trades!!!
Levels to watch/live orders:
- Buys: Flat (Stop loss: N/A).
- Sells: 1.1300 [Tentative – confirmation required] (Stop loss: dependent on where one confirms this level). 1.1338/1.1350 [Tentative – confirmation required] (Stop loss: dependent on where one confirms this area).
GBP/USD:
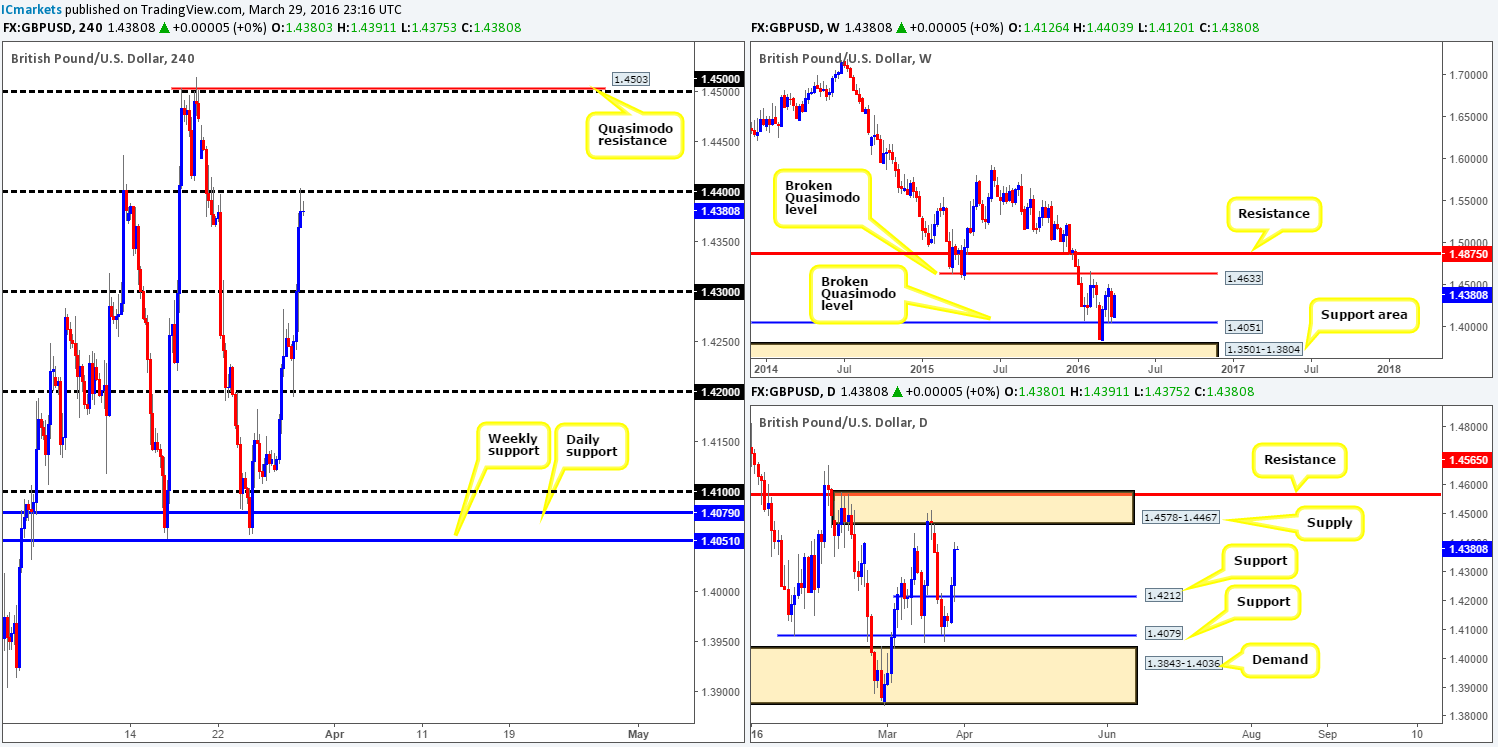
With a weak dollar being seen across the board due to Yellen’s dovish speech yesterday, Cable extended above the 1.4300 mark and ended the day shaking hands with the 1.4400 figure. Although the market has reacted to 1.4400, we remain uncertain regarding its strength. Our reasoning lies within the higher-timeframe structures. Weekly action shows room to continue pushing north at least until the 1.4514 region, whilst lower down on the daily chart, there is scope for a further advance up to supply penciled in at 1.4578-1.4467. Now, this certainly does not mean 1.4400 will not hold today – it could turn out to be a fantastic reversal point! However, with the higher-timeframe technicals suggesting an advance could be on the horizon, we’ll be looking for this number to give way today.
Should our analysis be correct and price takes out 1.4400, the river north should be ripple free up to the 1.4500 region. For us to be given the green light to long following a close higher, nonetheless, we’d need to see price retest this figure as support together with a lower timeframe confirming signal. This should keep one out of any fakeout seen, which as most are already aware is a common occurrence around psychological numbers!
Levels to watch/live orders:
- Buys: Watch for price to consume 1.4400 and look to trade any retest seen thereafter (lower timeframe confirmation required).
- Sells: Flat (Stop loss: N/A).
AUD/USD:
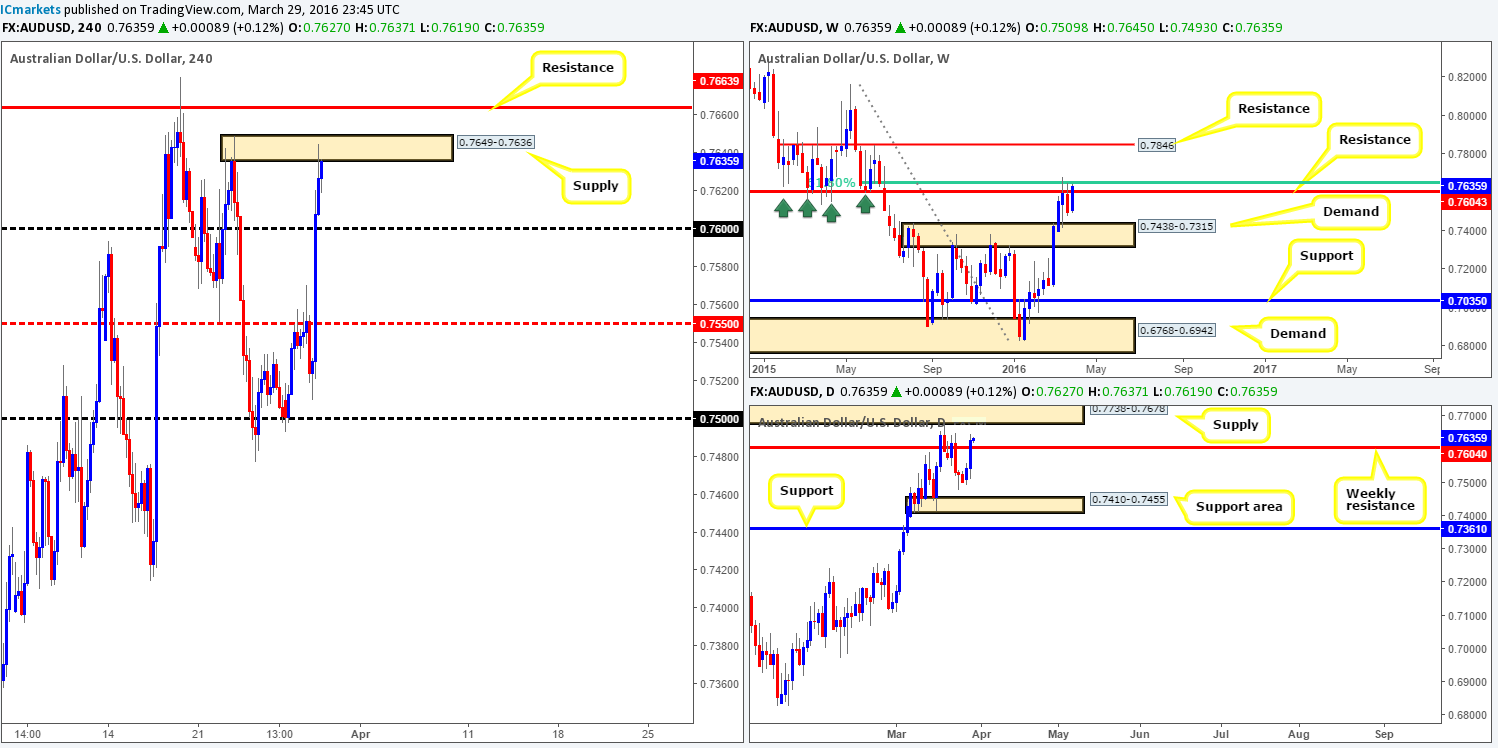
Using a top-down approach this morning, we can see that the weekly resistance line at 0.7604 along with the 61.8% Fibonacci level above at 0.7646 is under attack. In the event that the week convincingly closes above this roadblock, we’ll be eyeing the 0.7846 resistance line going forward. Casting our lines down into the daily chart, a daily close above the weekly resistance line has already taken place. This, at least from where we’re standing, suggests price is likely heading towards supply chalked up at 0.7738-0.7678.
Moving down one more level to the H4, Yellen’s speech at 17.00pm GMT yesterday pushed the commodity currency above both the H4 mid-level hurdle 0.7550 and the 0.7600 figure, which saw price thrust itself into a small H4 supply zone fixed at 0.7649-0.7636.
Given the points made above, buying this market is out of the question for us today. A short trade from the aforementioned H4 supply on the other hand is also a little risky, since we have H4 resistance sitting above at 0.7663, as well as daily supply directly above that at 0.7738-0.7678. If one is considering shorts, this daily supply area is the only neighborhood we’d consider selling from due to it being this zone that held price from breaking above the weekly resistance line back on the 18th March.
Levels to watch/live orders:
- Buys: Flat (Stop loss: N/A).
- Sells: 0.7738-0.7678 [Tentative – confirmation preferred] (Stop loss: dependent on where one confirms this area).
USD/JPY:
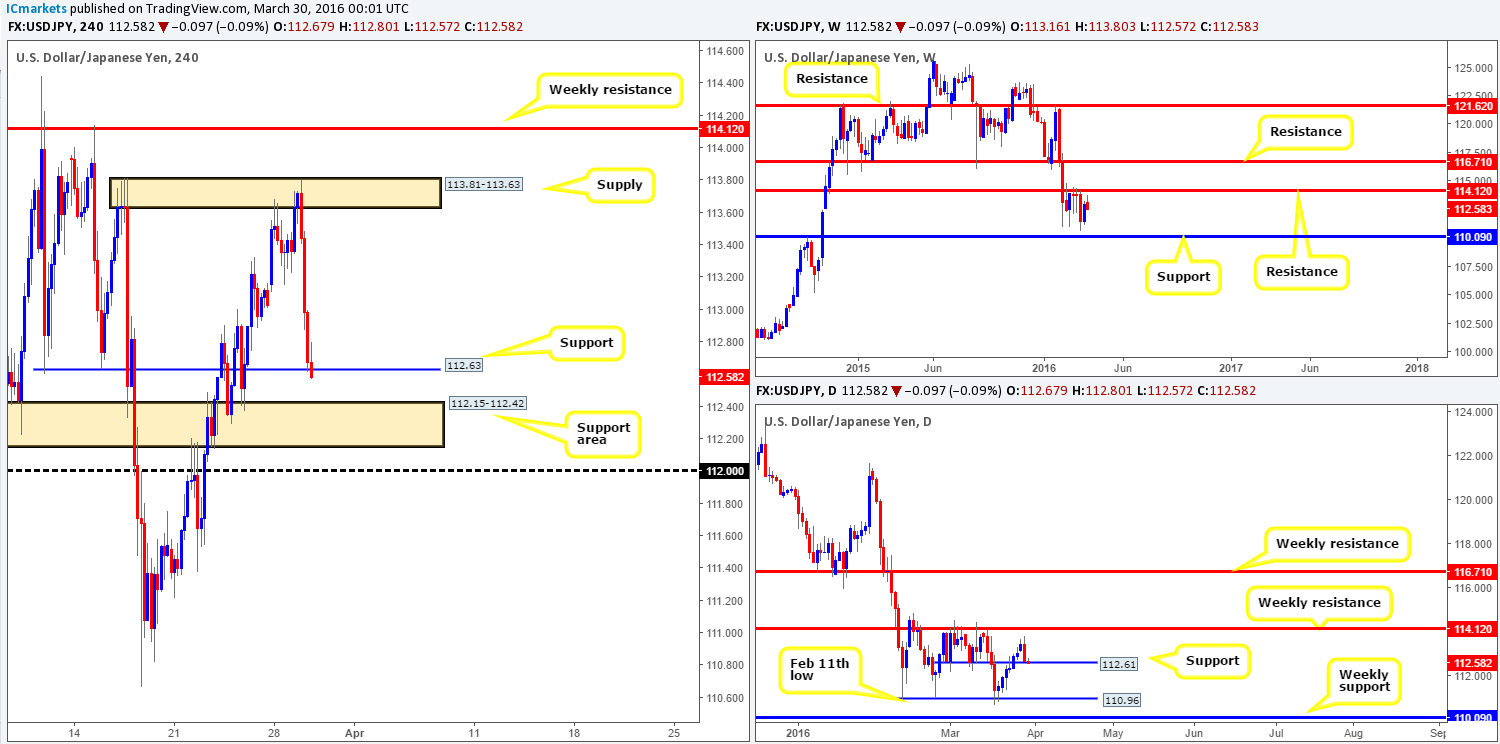
Shortly after Yellen’s turn in the spotlight, the USD/JPY fell sharply winding up closing the day at H4 support chalked in around the 112.61 mark, which is also noted as support on the daily scale. Bids appear weak around this hurdle at the moment, and this could very well lead to a continuation move south towards the H4 support area just below drawn in at 112.15-112.42 sometime today. Trading long from either H4 barrier in this market is quite unnerving, nevertheless, due to price selling-off from just beneath a clear-cut weekly resistance at 114.12.
With the H4 support area below, and a psychological figure just below that at 112.00, selling based on the weekly chart, however, may not be the best path to take until 112.00 is out of the picture. As such, remaining flat until more conducive price action presents itself is the route we’ve chosen to take today.
Levels to watch/live orders:
- Buys: Flat (Stop loss: N/A).
- Sells: Flat (Stop loss: N/A).
USD/CAD:
Influenced by Yellen’s dovish comments yesterday afternoon, the Loonie traded aggressively lower. Consequent to this, H4 demand at 1.3140-1.3167 (now acting supply) and the 1.3100 figure were obliterated, potentially opening the path for further selling down to at least minor H4 support at 1.3031.
Buying from the 1.3031 region today could be something to keep an eye on owing to it sitting only a few pips below daily demand coming in at 1.3038-1.3165. However, we would NOT advise placing pending orders here since weekly action is looking incredibly bearish due to it recently selling-off from the underside of a broken ascending support line (1.0630). To trade this level, we’d recommend waiting for the lower timeframes to confirm buying strength exists before risking capital on this idea.
Should 1.3031 fail to hold and a close lower ensues, this will be our cue to begin looking for price to retest the underside of the broken line as resistance for a confirmed short trade down to 1.2945 – a H4 Quasimodo support. Reason being is at that point both the weekly and daily timeframes will show room to continue lower (weekly shows next target around support at 1.2833, whilst the next target on the daily comes in at 1.2900 – a Quasimodo support).
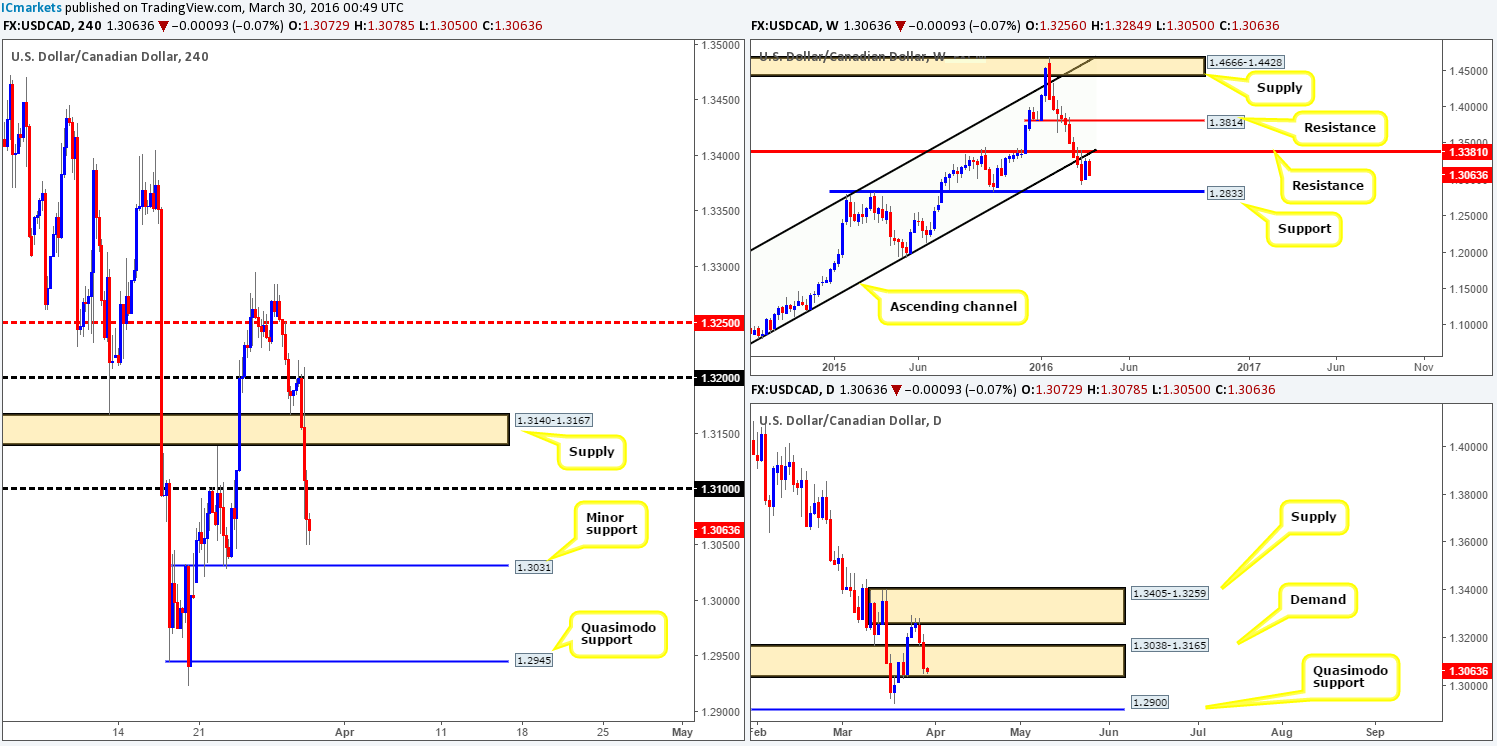
Levels to watch/live orders:
- Buys: 1.3031 [Tentative – confirmation preferred] (Stop loss: dependent on where one confirms this level).
- Sells: Watch for price to consume 1.3031 and look to trade any retest seen thereafter (lower timeframe confirmation required).
USD/CHF:
Coming at you directly from the pits of the weekly timeframe this morning, it’s relatively clear to see that price has very nicely sold off from the underside of a recently broken trendline support extended from the low 0.9071. Should the sellers continue to remain dominant from this angle, we could see this pair cross swords with Quasimodo support given at 0.9526.
Looking at the daily timeframe, however, support at 0.9660 has now been brought into the action which could possibly halt further selling at this point! Assuming that bids are weak here, however, and a close lower follows, all eyes will be on the weekly Quasimodo support discussed above which blends closely with the completion point of a daily AB=CD bull pattern (0.9506).
Sliding down one more chart to the H4 shows price is, thanks to Yellen’s dovish speech yesterday, now trading within touching distance of the mid-level hurdle 0.9650. This barrier, coupled with the daily support just mentioned above at 0.9660 could provide a base in which to buy from today. Despite this, by entering long from here, you’d potentially be buying into weekly flow (see above), so, even with lower timeframe confirmation it is a risky long in our opinion. We’d much prefer to be looking for shorts on a break below and (confirmed) retest of 0.9650. Granted, the next H4 target sits only a few pips below in the form of demand at 0.9579-0.9611, but considering that the higher timeframes would be free at that point down to the weekly Quasimodo barrier, we feel a short from here is worth the risk!
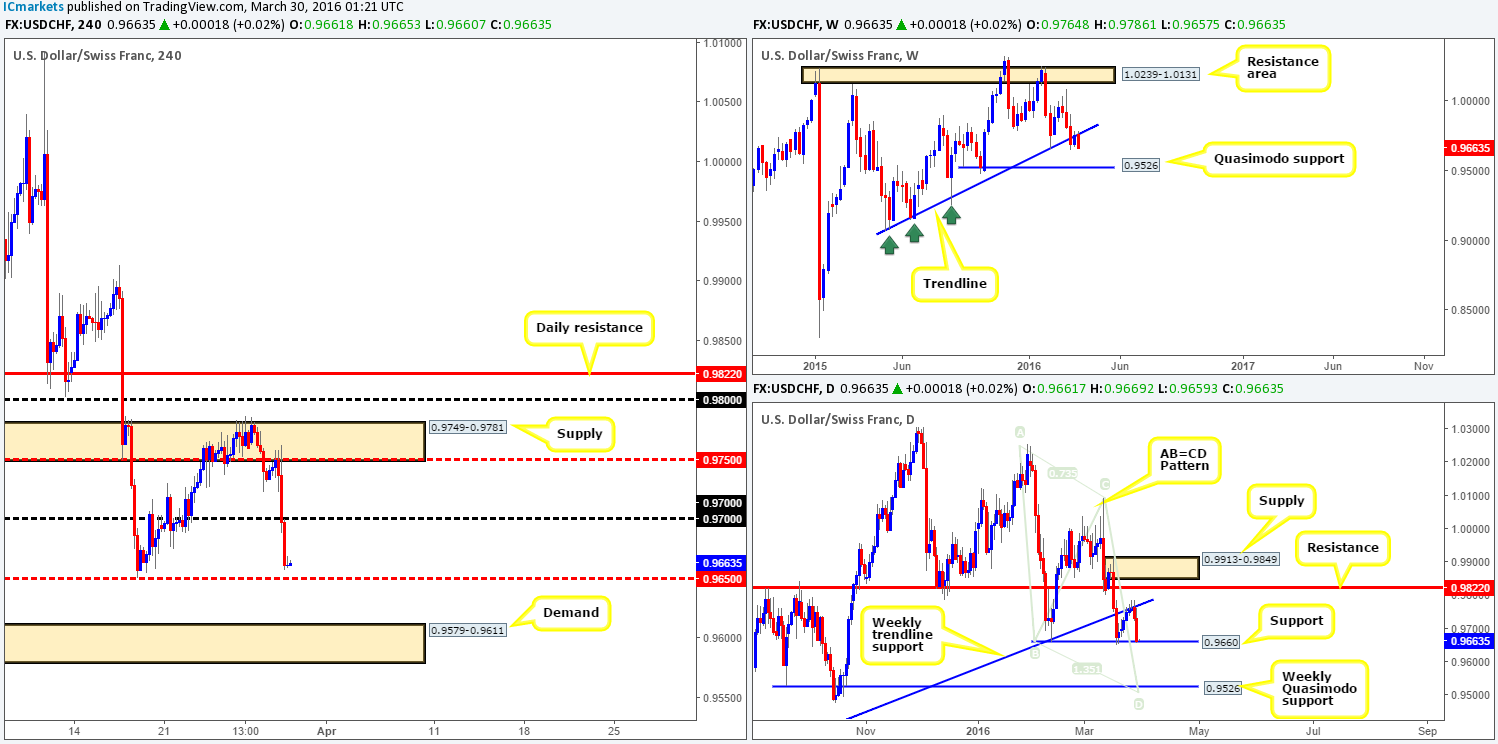
Levels to watch/live orders:
- Buys: Flat (Stop loss: N/A).
- Sells: Watch for price to consume 0.9650 and look to trade any retest seen thereafter (lower timeframe confirmation required).
DOW 30:
Thanks to Yellen’s dovish comments yesterday afternoon, U.S. stocks finished the day positively at 17638. As shown on the H4 chart, price spring boarded itself above both supply at 17617-17582 (now acting demand) and also a Quasimodo resistance at 17644 (now acting support), likely opening the path north for this unit to challenge the H4 resistance area overhead at 17811-17736.
We’re quite sure this recent upsurge has panicked a lot of higher-timeframe sellers who shorted the weekly supply coming in at 17752-17552, even more so now that price is trading above the converging weekly trendline resistance taken from the high 18365.
In view of the points made above, where does one go from here? Well, longs are possible today should price retest the H4 broken Quasimodo line at 17644, targeting the aforementioned H4 resistance area. However, this is risky considering that you’d be buying within weekly supply, so trade with CAUTION! The more logical setup, in our opinion, would be to WAIT for price to connect with the above said H4 resistance area and look for confirming action on the lower timeframes. The reason for requiring confirmation here is simply because the H4 resistance zone edges slightly above the weekly supply and could tempt weekly breakout buyers into the market, thus demolishing our sell zone!

Levels to watch/live orders:
- Buys: 17644 [Tentative – confirmation preferred] (Stop loss: dependent on where one confirms this level).
- Sells: 17811-17736 [Tentative – confirmation preferred] (Stop loss: dependent on where one confirms this area).
XAU/USD: (Gold)
With Gold inversely correlated to the U.S. dollar, the yellow metal saw a significant upsurge in buying yesterday as Yellen’s dovish tone hit the market place. As a result, the small H4 supply zone at 1224.6-1226.8 (now acting demand) was wiped out and the session ended with price stabbing into H4 supply at 1237.2-1243.9, which for now is holding firm. In view of this, would we consider shorts from this zone?
Well, from the daily chart, selling this market looks attractive considering the precious metal is within shouting distance of connecting with supply drawn from 1260.1-1243.4. However, moving up to the weekly chart, price has exploded north from demand coming in at 1205.6-1181.2 with room seen to continue trading higher at least until supply chalked up at 1307.4-1280.0.
In light of the above, it appears we’re at a crossroads here! Either sell in-line with the H4 and daily charts, or buy in-line with the weekly chart. In situations such as this we would usually remain flat and wait for the market to sort its differences out. However, considering there’s space either side of the current H4 supply (to the upside resistance is seen at 1256.2, and to the downside support comes in at demand drawn from 1224.6-1226.8) for price to move, we’ll keep an eye on the lower timeframe price action here for potential shorting opportunities or a close above and confirmed retest of this area as demand.
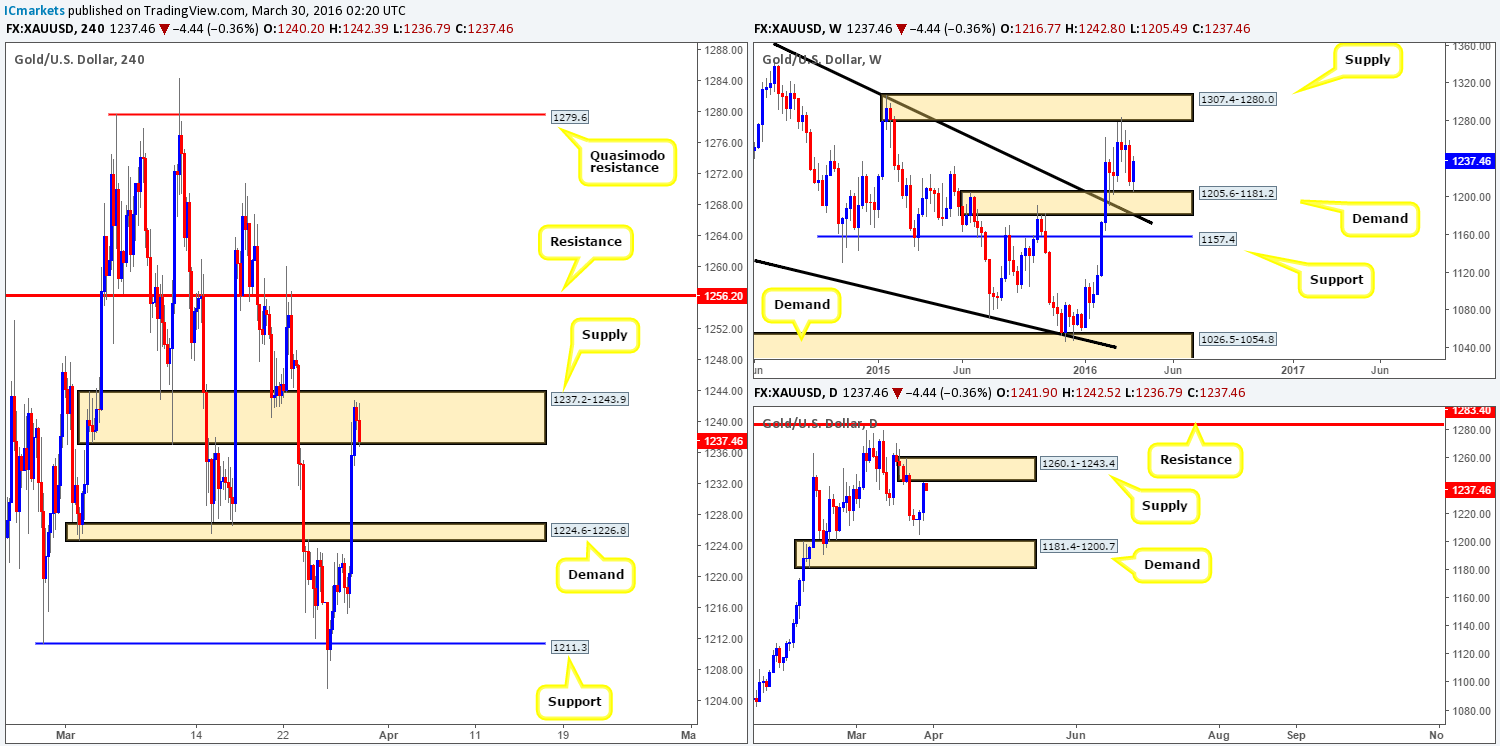
Levels to watch/live orders:
- Buys: Watch for price to consume 1237.2-1243.9 and look to trade any retest seen thereafter (lower timeframe confirmation required).
- Sells: 1237.2-1243.9 [Tentative – confirmation required] (Stop loss: dependent on where one confirms this area).