
EUR/USD:
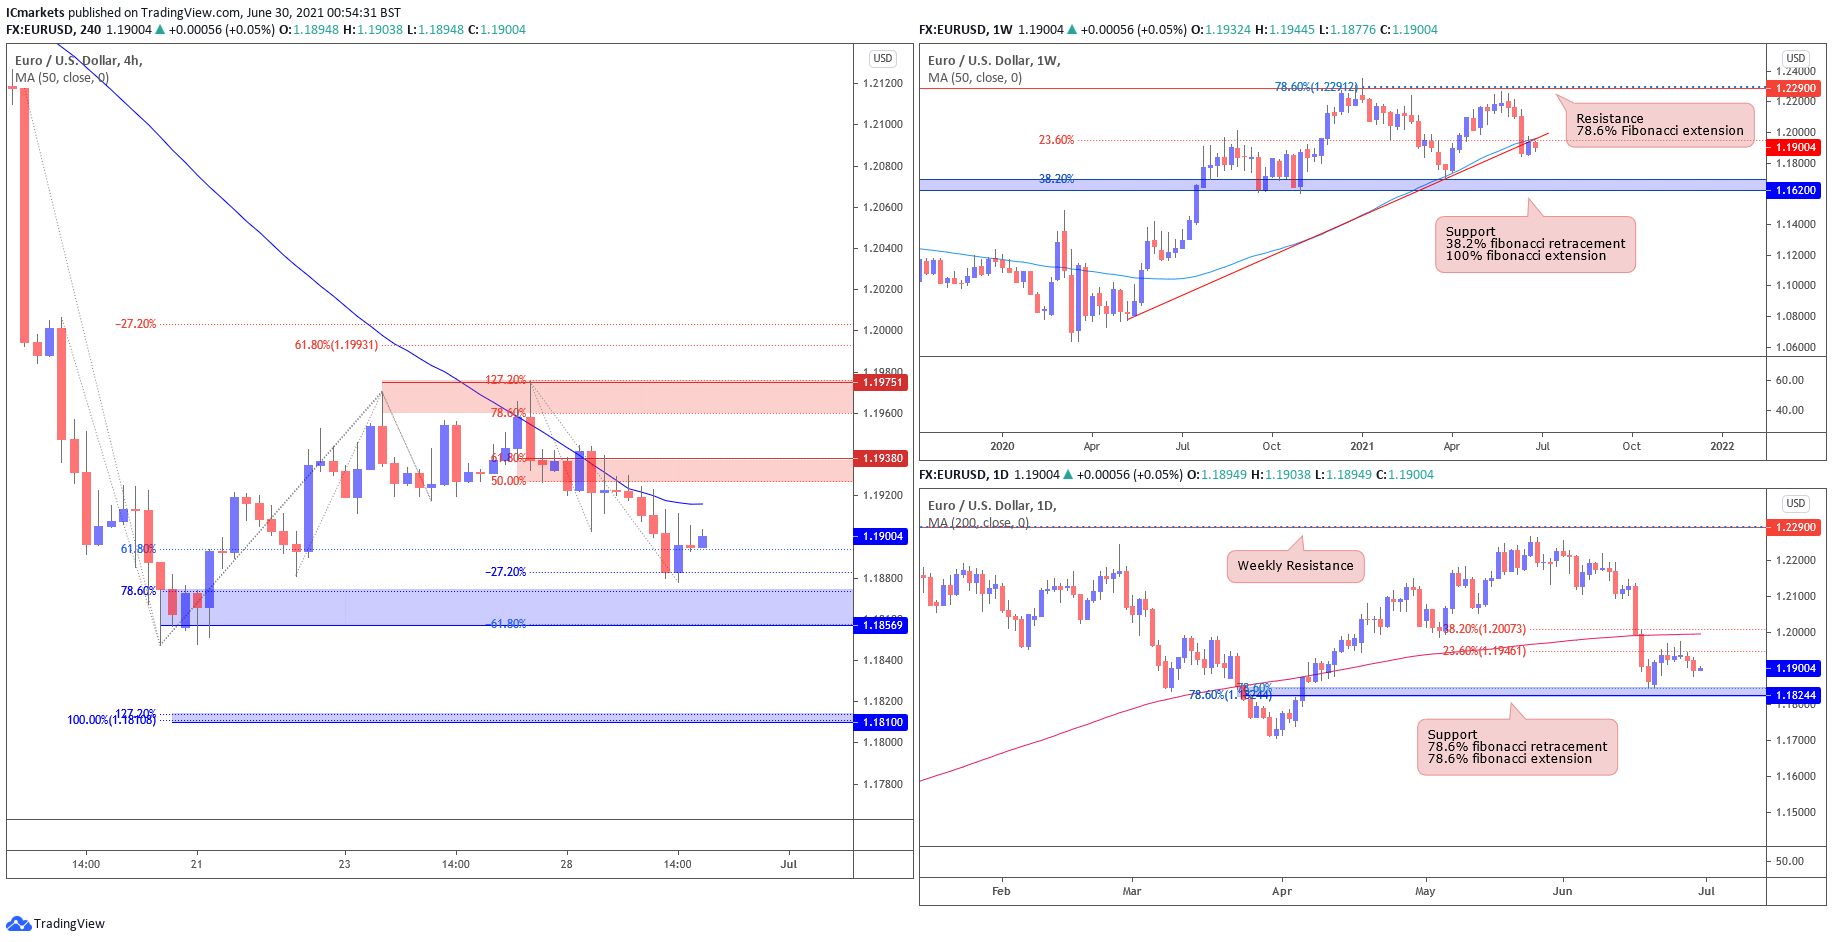
Looking at the weekly chart we can see that price has bounced back but closed below the ascending trendline support-turned-resistance and 23.6% Fibonacci retracement where we could potentially see prices facing bearish pressure. On the daily chart, prices faced bearish pressure and were unable to close above the 23.6% Fibonacci retracement where we could possibly see a medium-probability scenario where the price face bearish pressure to retest 1.18244, in-line with 78.6% Fibonacci retracement and 78.6% Fibonacci extension.
On the H4 timeframe, prices dropped and found support at 1.18825, in-line with -27.2% and 61.8% Fibonacci retracement. We are seeing a low-probability scenario where the price bounces to our first resistance at 1.19380, in-line with 50% and 61.8% Fibonacci retracement and horizontal overlap resistance. The next level of resistance will be at 1.19751, in-line with 78.6% Fibonacci retracement, 127.2% Fibonacci extension.
If price drops from current level, it will swing towards our first support level at 1.18569, in-line with -61.8% and 78.6% Fibonacci retracement. The next support level will be at 1.18100, in-line with 127.2% Fibonacci retracement, 100% Fibonacci extension and daily support.
Areas of consideration:
- H4 time frame, support level at 1.18569 and 1.18100
- H4 time frame, resistance level at 1.19380 and 1.19751
GBP/USD:
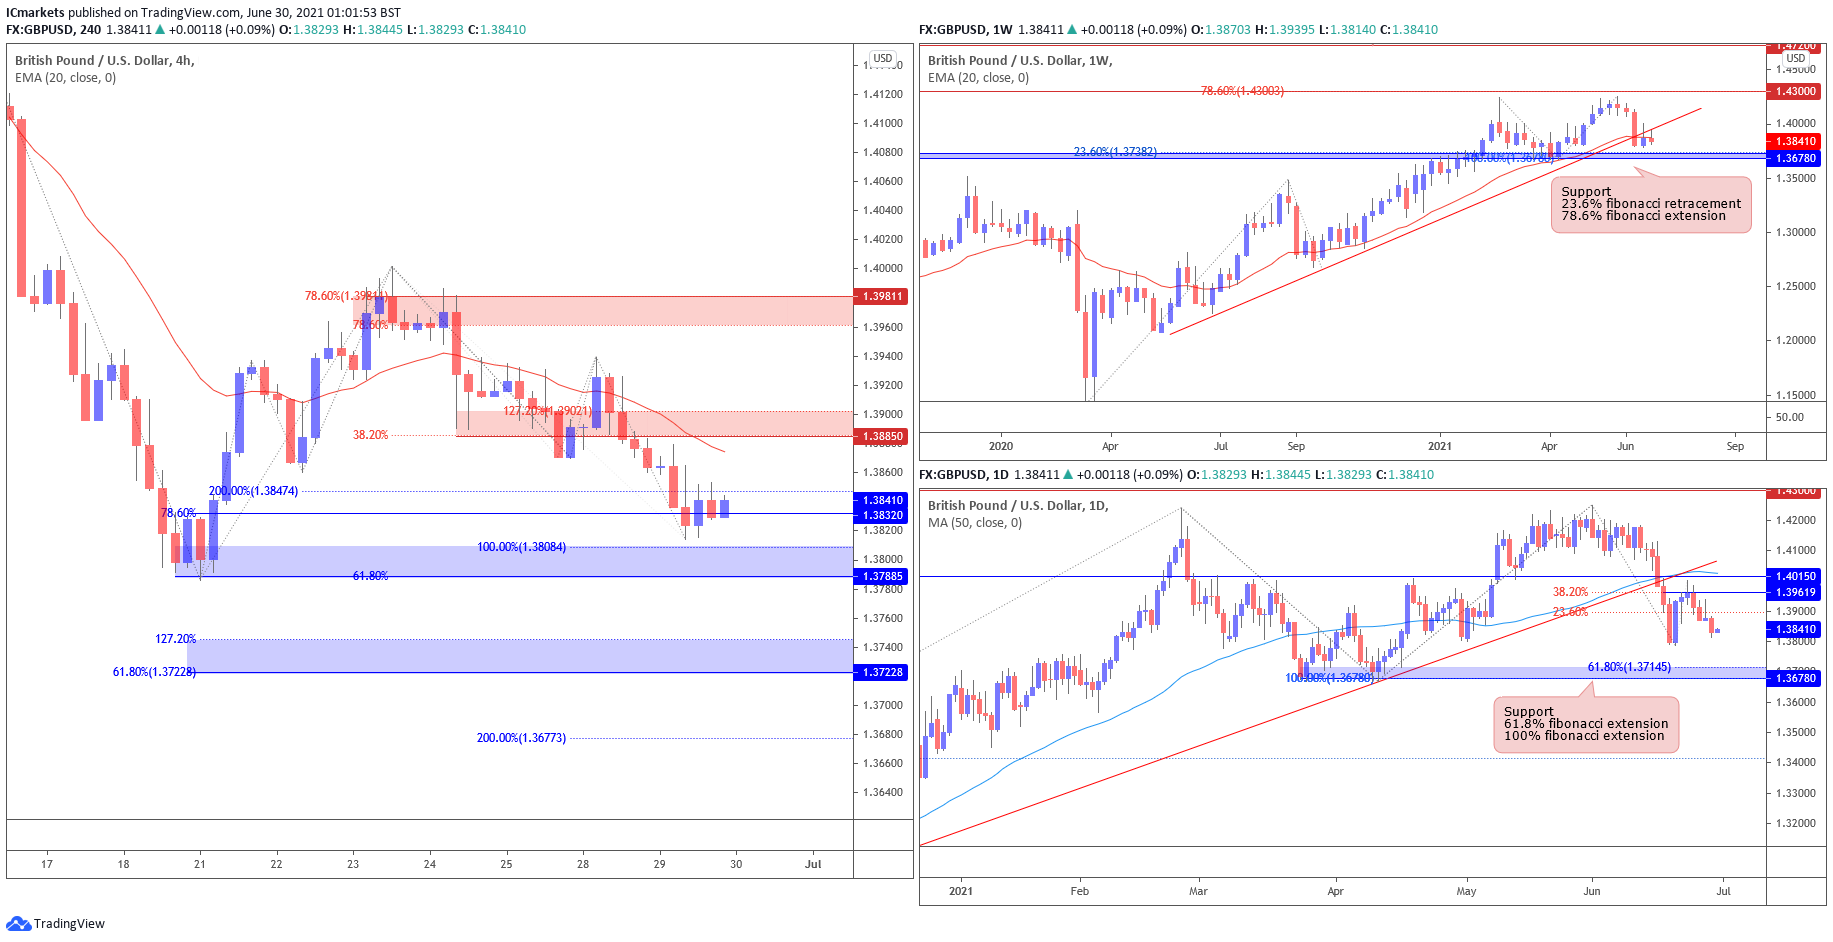
Looking at the weekly chart, we can see that the price faced bearish pressure and was unable to close above 20EMA and ascending trendline support-turned-resistance. On the daily time frame, prices faced bearish pressure and got rejected at 38.2% and 23.6% Fibonacci retracement. We are seeing a low-probability scenario where the prices continue to face bearish pressure and drop to support level at 1.36780, in-line with 61.8% and 100% Fibonacci extension.
On the H4 timeframe, prices dropped and found support at 1.38320, in-line with 78.6% Fibonacci retracement and 200% Fibonacci extension. We are seeing a low-probability scenario where the price bounces to our first resistance at 1.38850, in-line with 38.2% Fibonacci retracement, 127.2% Fibonacci extension and 20EMA. The next resistance level is at 1.39811, in-line with 78.6% Fibonacci retracement and 78.6% Fibonacci extension.
If the price drops from current level, it will swing towards our first support level at 1.37885, in-line with -61.8% Fibonacci retracement and 100% Fibonacci extension. The next support level will be at 1.37228, in-line with 127.2% Fibonacci retracement and 61.8% Fibonacci extension.
Areas of consideration:
- H4 time frame, 37885 and 1.37228 support level
- H4 time frame, 1.38850 and 1.39811 resistance level
AUD/USD:
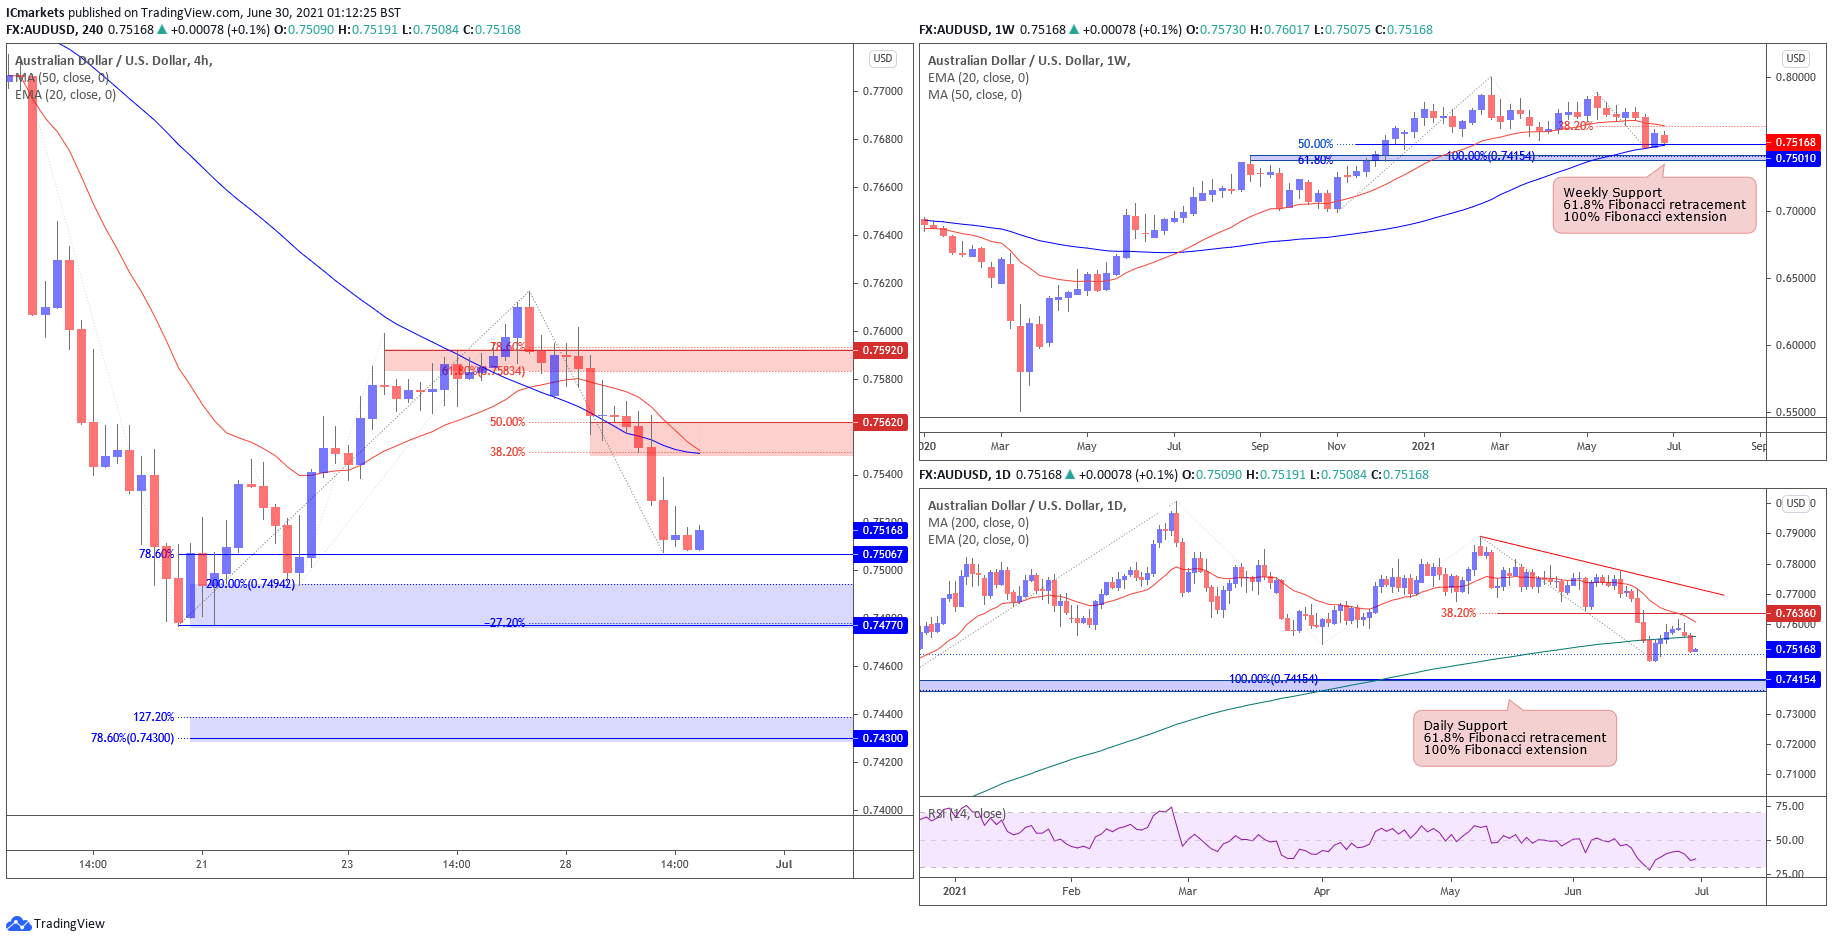
Looking at the weekly chart, we can see that the price is retesting support level at 0.75010, in-line with 50% Fibonacci retracement and 50MA. On the daily time frame, prices faced bearish pressure and closed back below 200MA. We are seeing a medium-probability scenario where the prices continue to face bearish pressure and drop to support level at 0.74154, in-line with 61.8% and 100% Fibonacci extension.
On the H4 timeframe, prices dropped and found support at 0.75067, in-line with 78.6% Fibonacci retracement. We are seeing a low-probability scenario where the price bounces to our first resistance at 0.75620, in-line with 38.2%, 50% Fibonacci retracement, 20EMA and 50MA . The next resistance level is at 0.75920, in-line with 78.6% Fibonacci retracement and 61.8% Fibonacci extension.
If the price drops from current level, it will swing towards our first support level at 0.74770, in-line with -27.2% Fibonacci retracement and 200% Fibonacci extension. The next support level will be at 0.74300, in-line with 127.2% Fibonacci retracement and 78.6% Fibonacci extension.
Areas of consideration:
- H4 time frame, 74770 and 0.74300 support level
- H4 time frame, 0.75620 and 0.75920 resistance level
USD/JPY
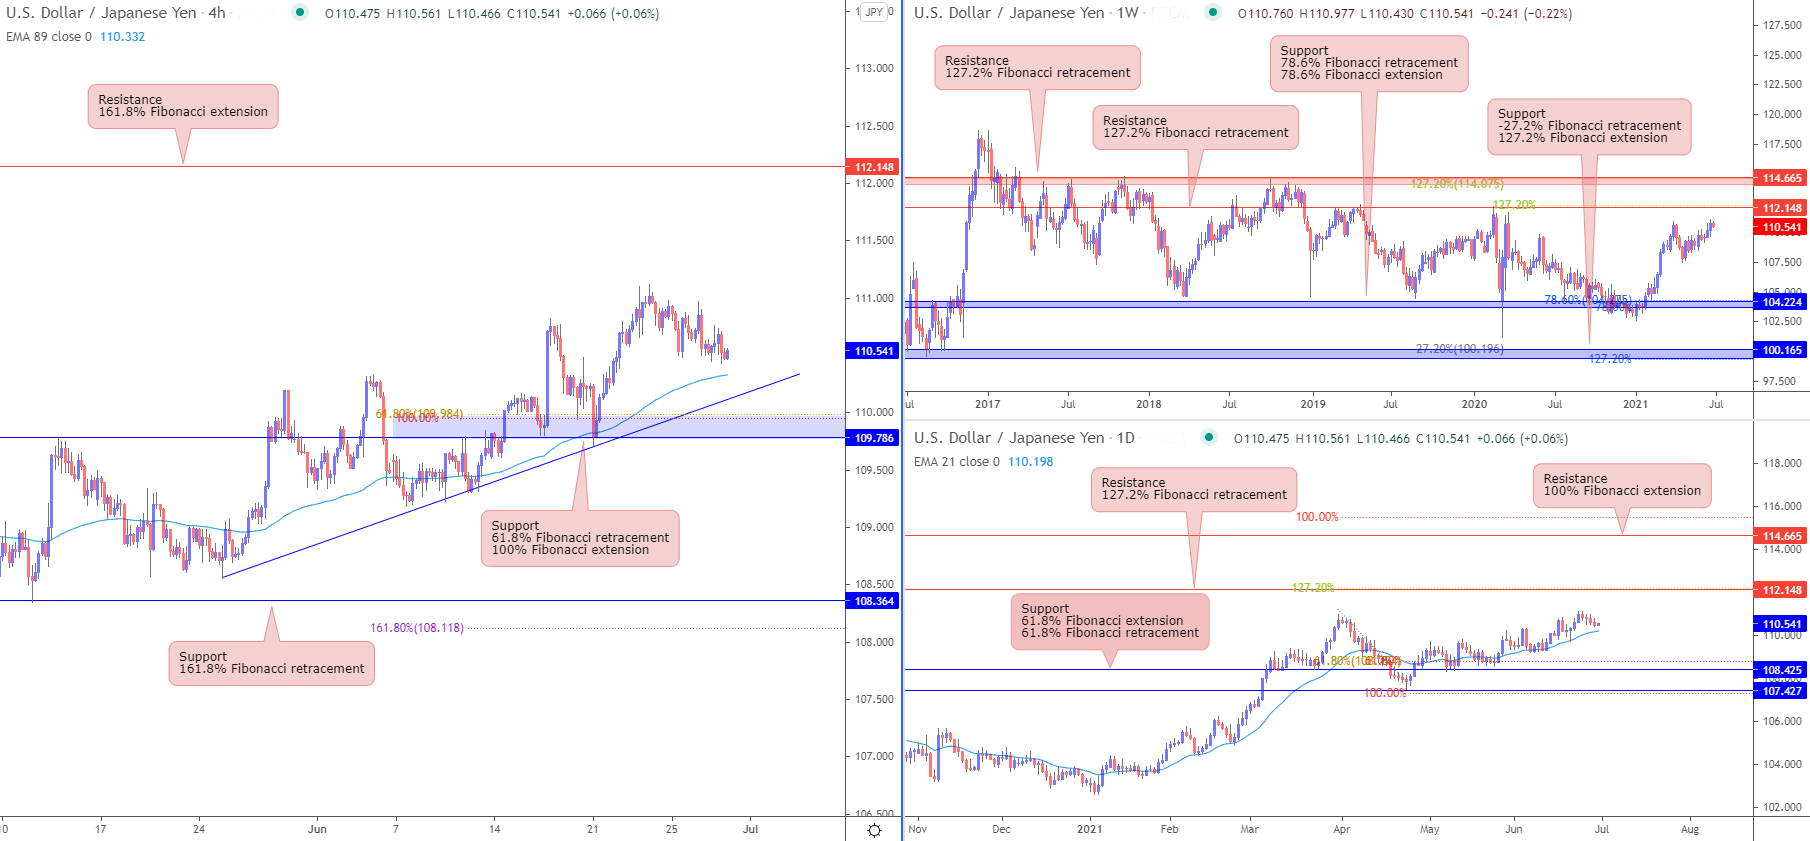
From the weekly timeframe, prices are bullish and are pushing up towards facing resistance from horizontal swing high resistance level 114.465 which coincides with 127.2% Fibonacci retracement. On the daily time frame, prices are holding nicely above the 21 period EMA. Prices have broken through the previous resistance level of 110.978 and are now pushing up towards the weekly level of 114.665,in line with 100% Fibonacci extension. A pullback from that level could mean prices would take support on 108.425 level.
On the H4 timeframe, prices are showing the same picture. Prices have broken through the previous swing high which is daily/weekly resistance level of 110.978. Next short term target is 112.148 level in line with 161.8% Fibonacci extension before the 114.665 level on the daily and weekly timeframe. However, prices might have a short term pullback towards the 109.786 level which is in line with ascending trendline support, 61.8% Fibonacci retracement and 100% Fibonacci extension. 89 Period EMA is also below prices, showing a bullish pressure for prices.
Areas of consideration:
- 148 resistance level on the H4 timeframe might be next upside target
- 786 support level on the H4 timeframe
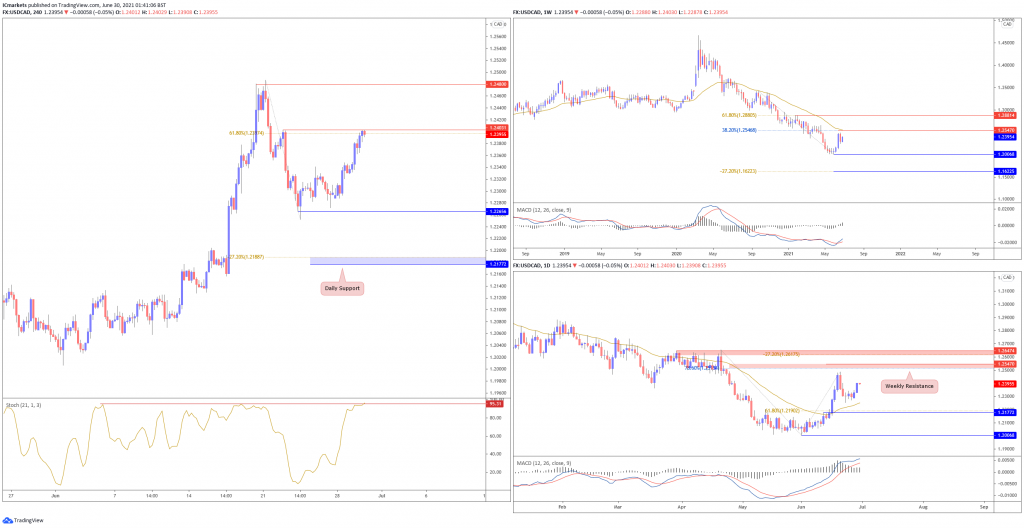
USD/CAD:
On the Weekly timeframe, price is within a long term descending trend. Holding below long term moving average and MACD indicator is below 0, showing strong bearish momentum. Price is currently holding between long term resistance at 1.25470 and long term support at 1.20068. On the Daily timeframe, we see that the indicators are showing a build up in bullish momentum. It is possible to see further bullish pressure above support at 1.21772 with possible upside target at weekly resistance 1.25470. Otherwise, failure to hold above 1.21772 will see price swing to graphical low at 1.20068.
On the H4, price pushed higher and surpassed previous resistance. With price testing key 61.8% Fibonacci retracement level and Stochastic indicator testing resistance as well, we see a medium probability for a short term intraday drop. Price could possibly face bearish pressure below 1.23955 resistance and find support at 1.22656. Otherwise, failure to hold below 1.23955 will see price push higher towards 1.24800 instead.
Areas of consideration:
- 23955 resistance is level to watch on H4
USD/CHF:
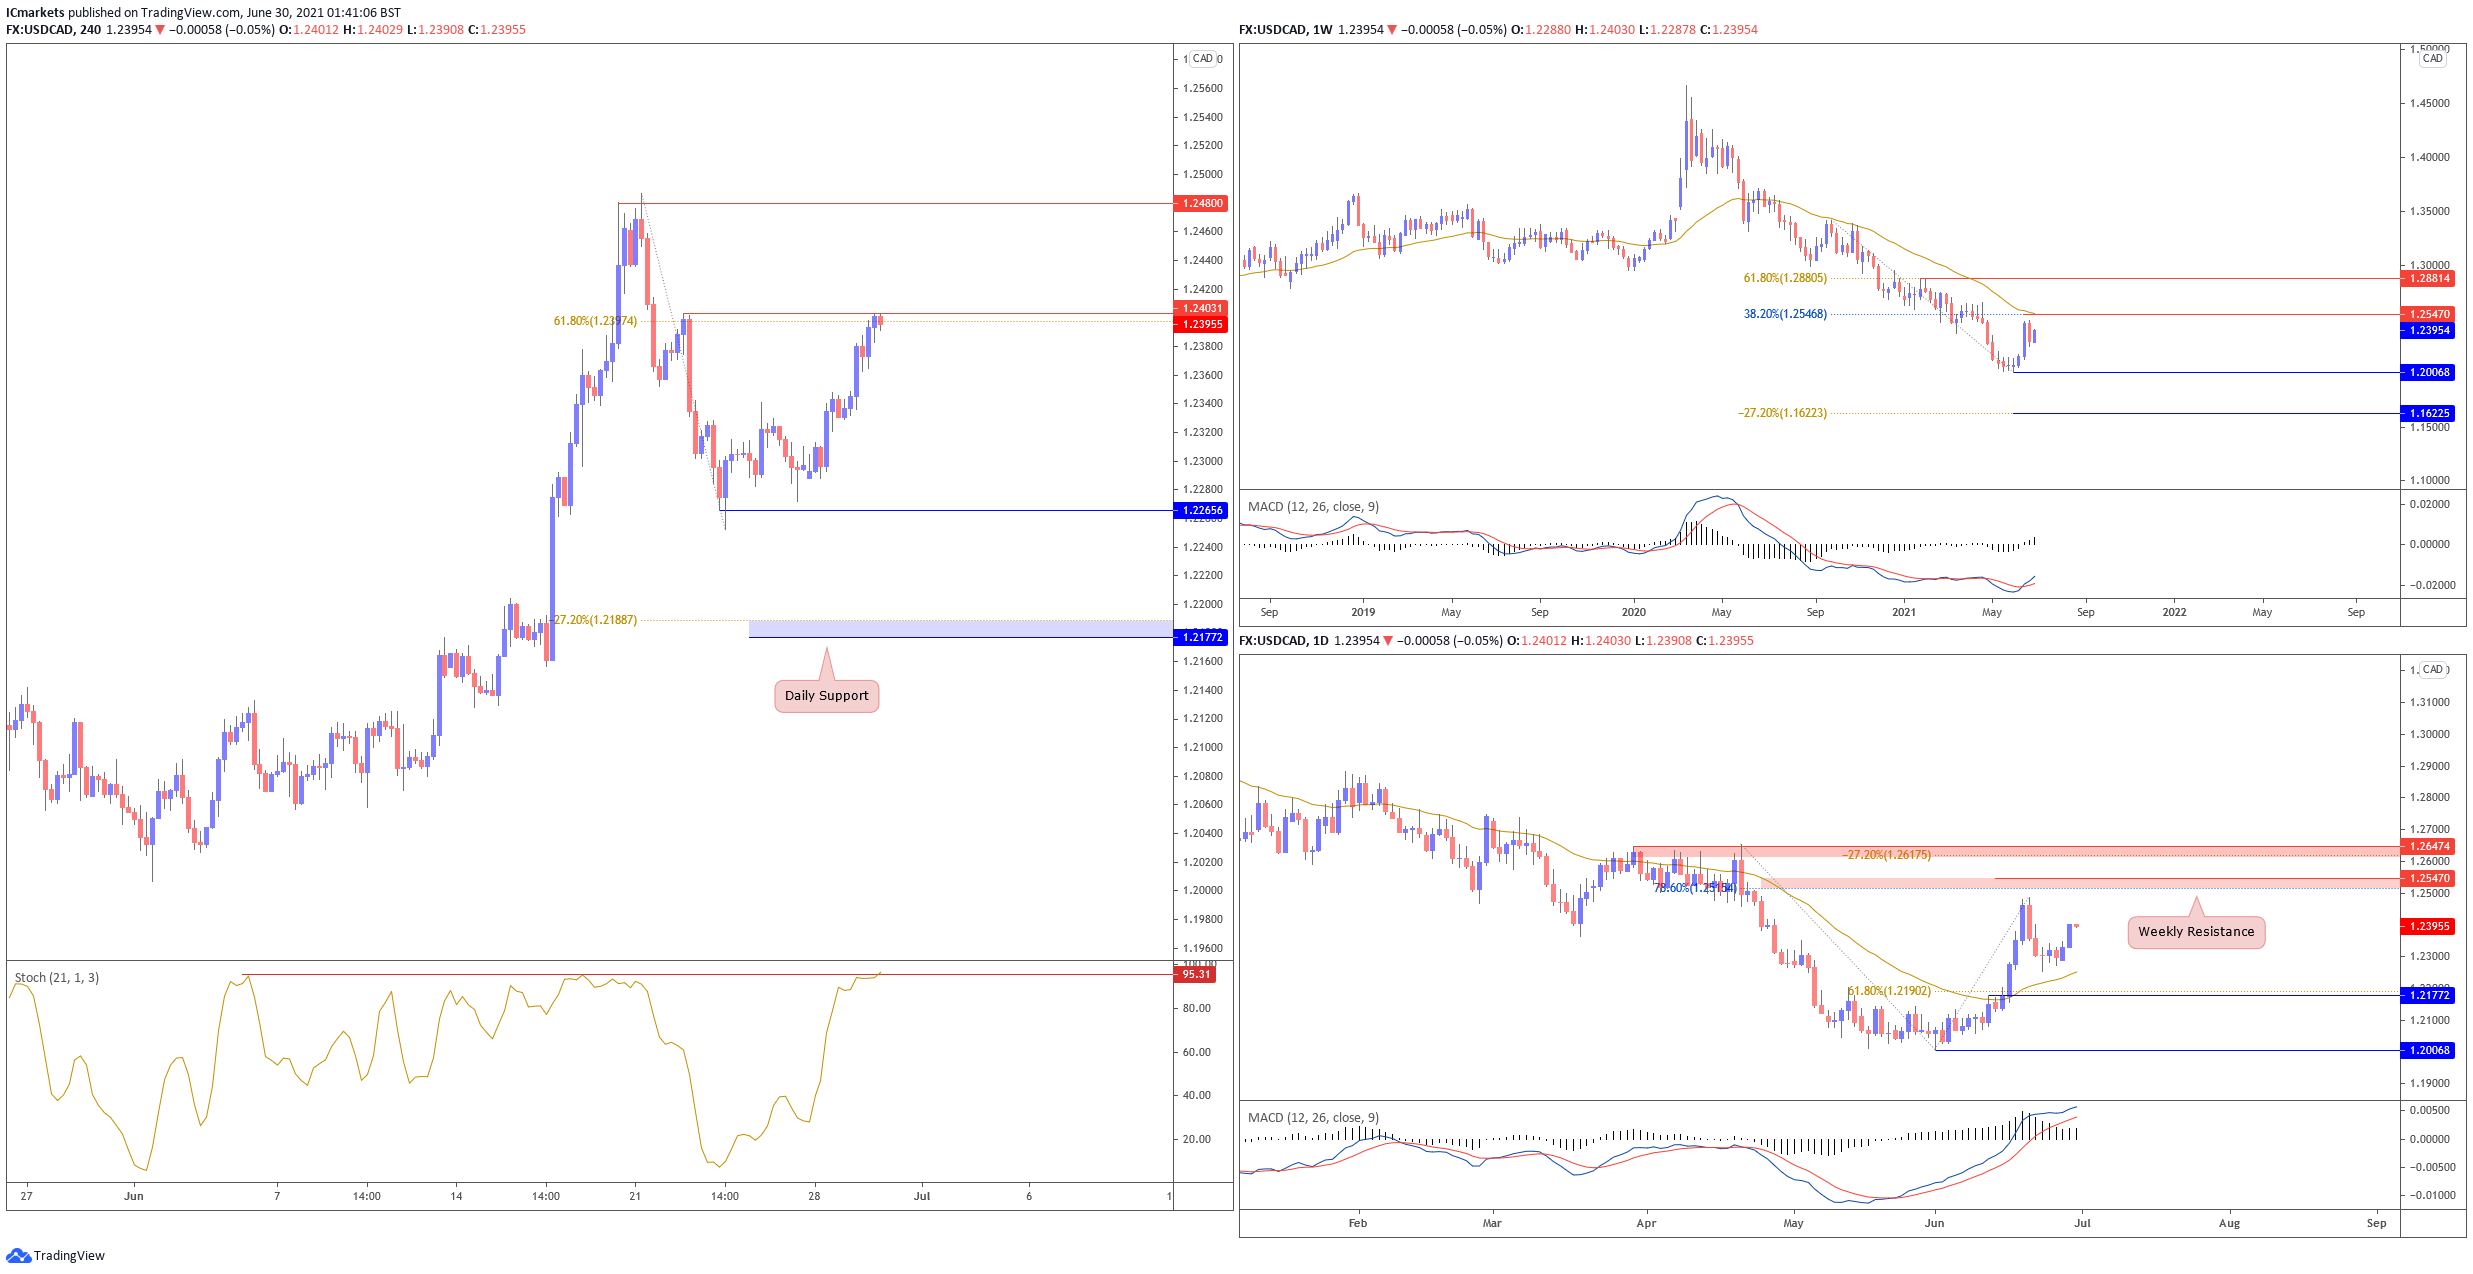
USD/CHF has shown a strong bounce from the weekly 0.89500 support, in line with 61.8% Fibonacci retracement and 78.6% Fibonacci extension. The daily chart shows that price is now testing the key daily 0.92300 support-turned-resistance and ascending trendline support-turned-resistance. We could potentially see further downside below the 0.92300 resistance.
On the H4 chart, we can see that price is now retesting the 0.92300 resistance level, in line with 61.8% Fibonacci retracement level. The 0.92300 resistance level is a key intraday level to watch. We note that Stochastics is also approaching resistance where price has reversed from before, in line with our bearish bias. In this scenario, we could see price face further downside towards 0.90500 support, in line with 61.8% Fibonacci retracement, 161.8% Fibonacci extension and horizontal pullback resistance. However, should price break and close above the 0.92300 resistance, we could see price push higher to test the subsequent weekly resistances.
Areas of consideration:
- The 0.92300 resistance is a key intraday level to watch.
- We could see price drop towards the next 0.90500 support level.
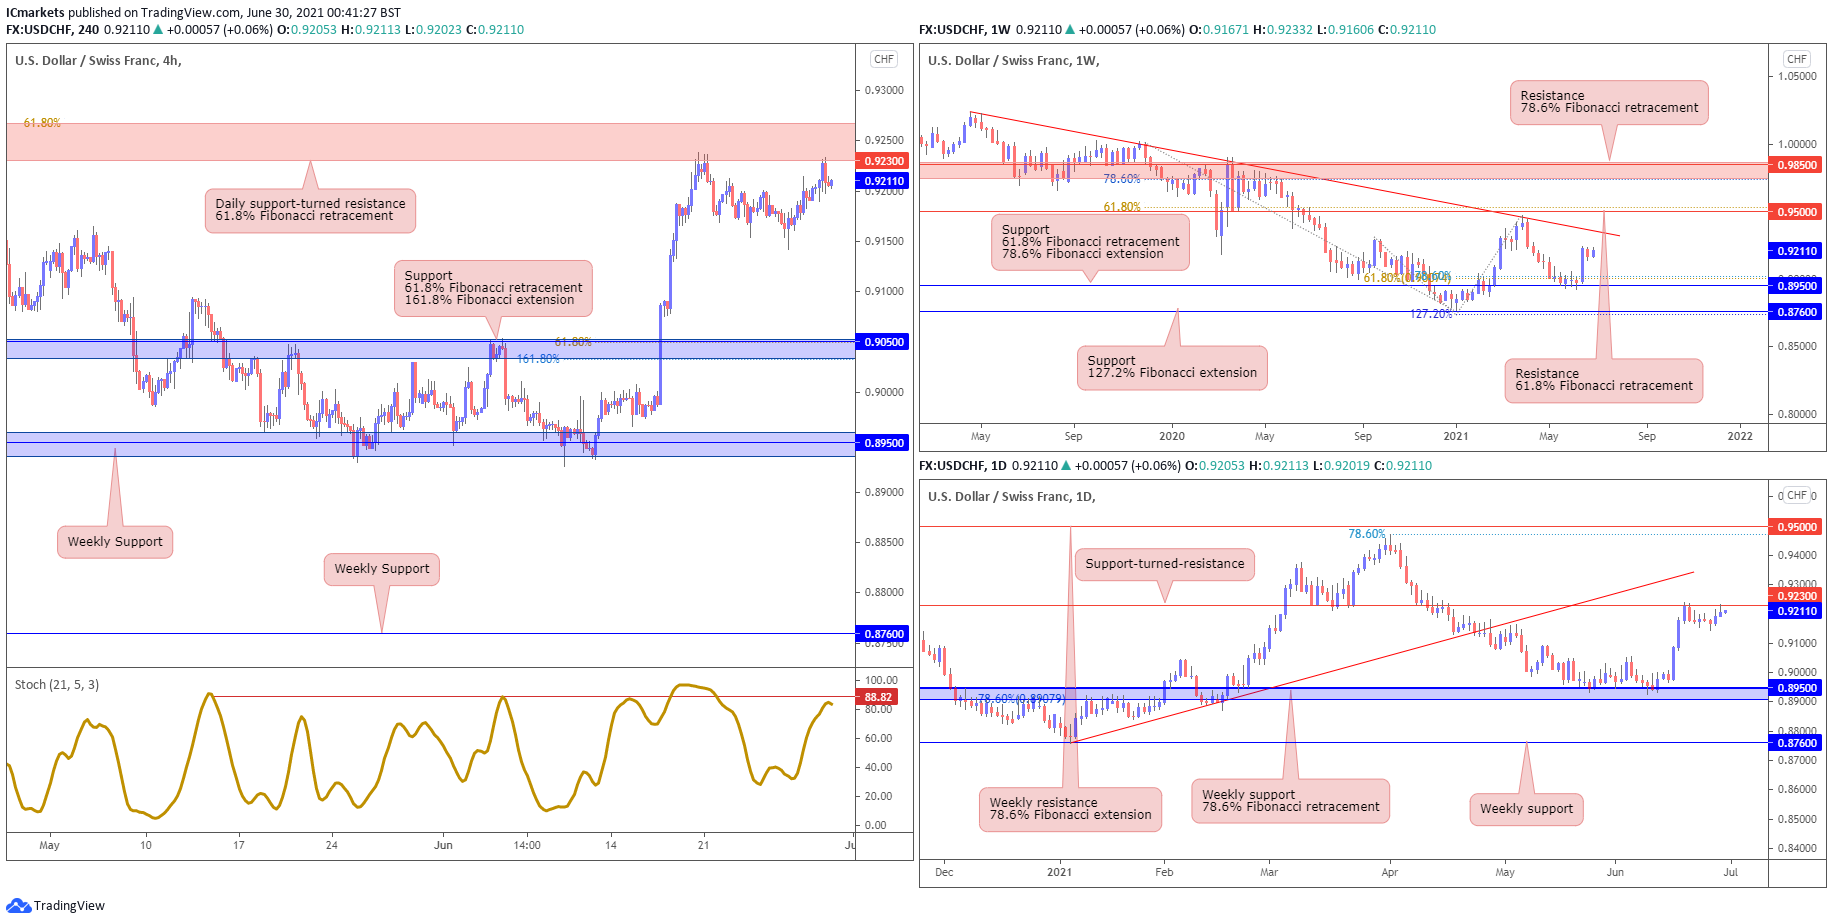
Dow Jones Industrial Average:
On the weekly chart, prices bounced higher above 32765 support, as inflation fears subsided. With price holding 32765 support, we might see bullish pressure above this level. On the daily chart, price bounced above the weekly support at 32765 and is currently holding between resistance at 15090 and support at 32765. With stochastic still reacting above support, we see price facing further bullish pressure.
On the H4, price is still holding below near term resistance at 34472. With stochastic reacting below resistance where price pulled back in the past, we see a possibility where sellers may add to their shorts on pullbacks with a downside target at 33475 support. Otherwise, failure to hold below 34472 should see the price swing the other way towards daily resistance at 35090.
Areas of consideration:
- Weekly key level at 32765 support is of key interest
- 34472 near term resistance on H4
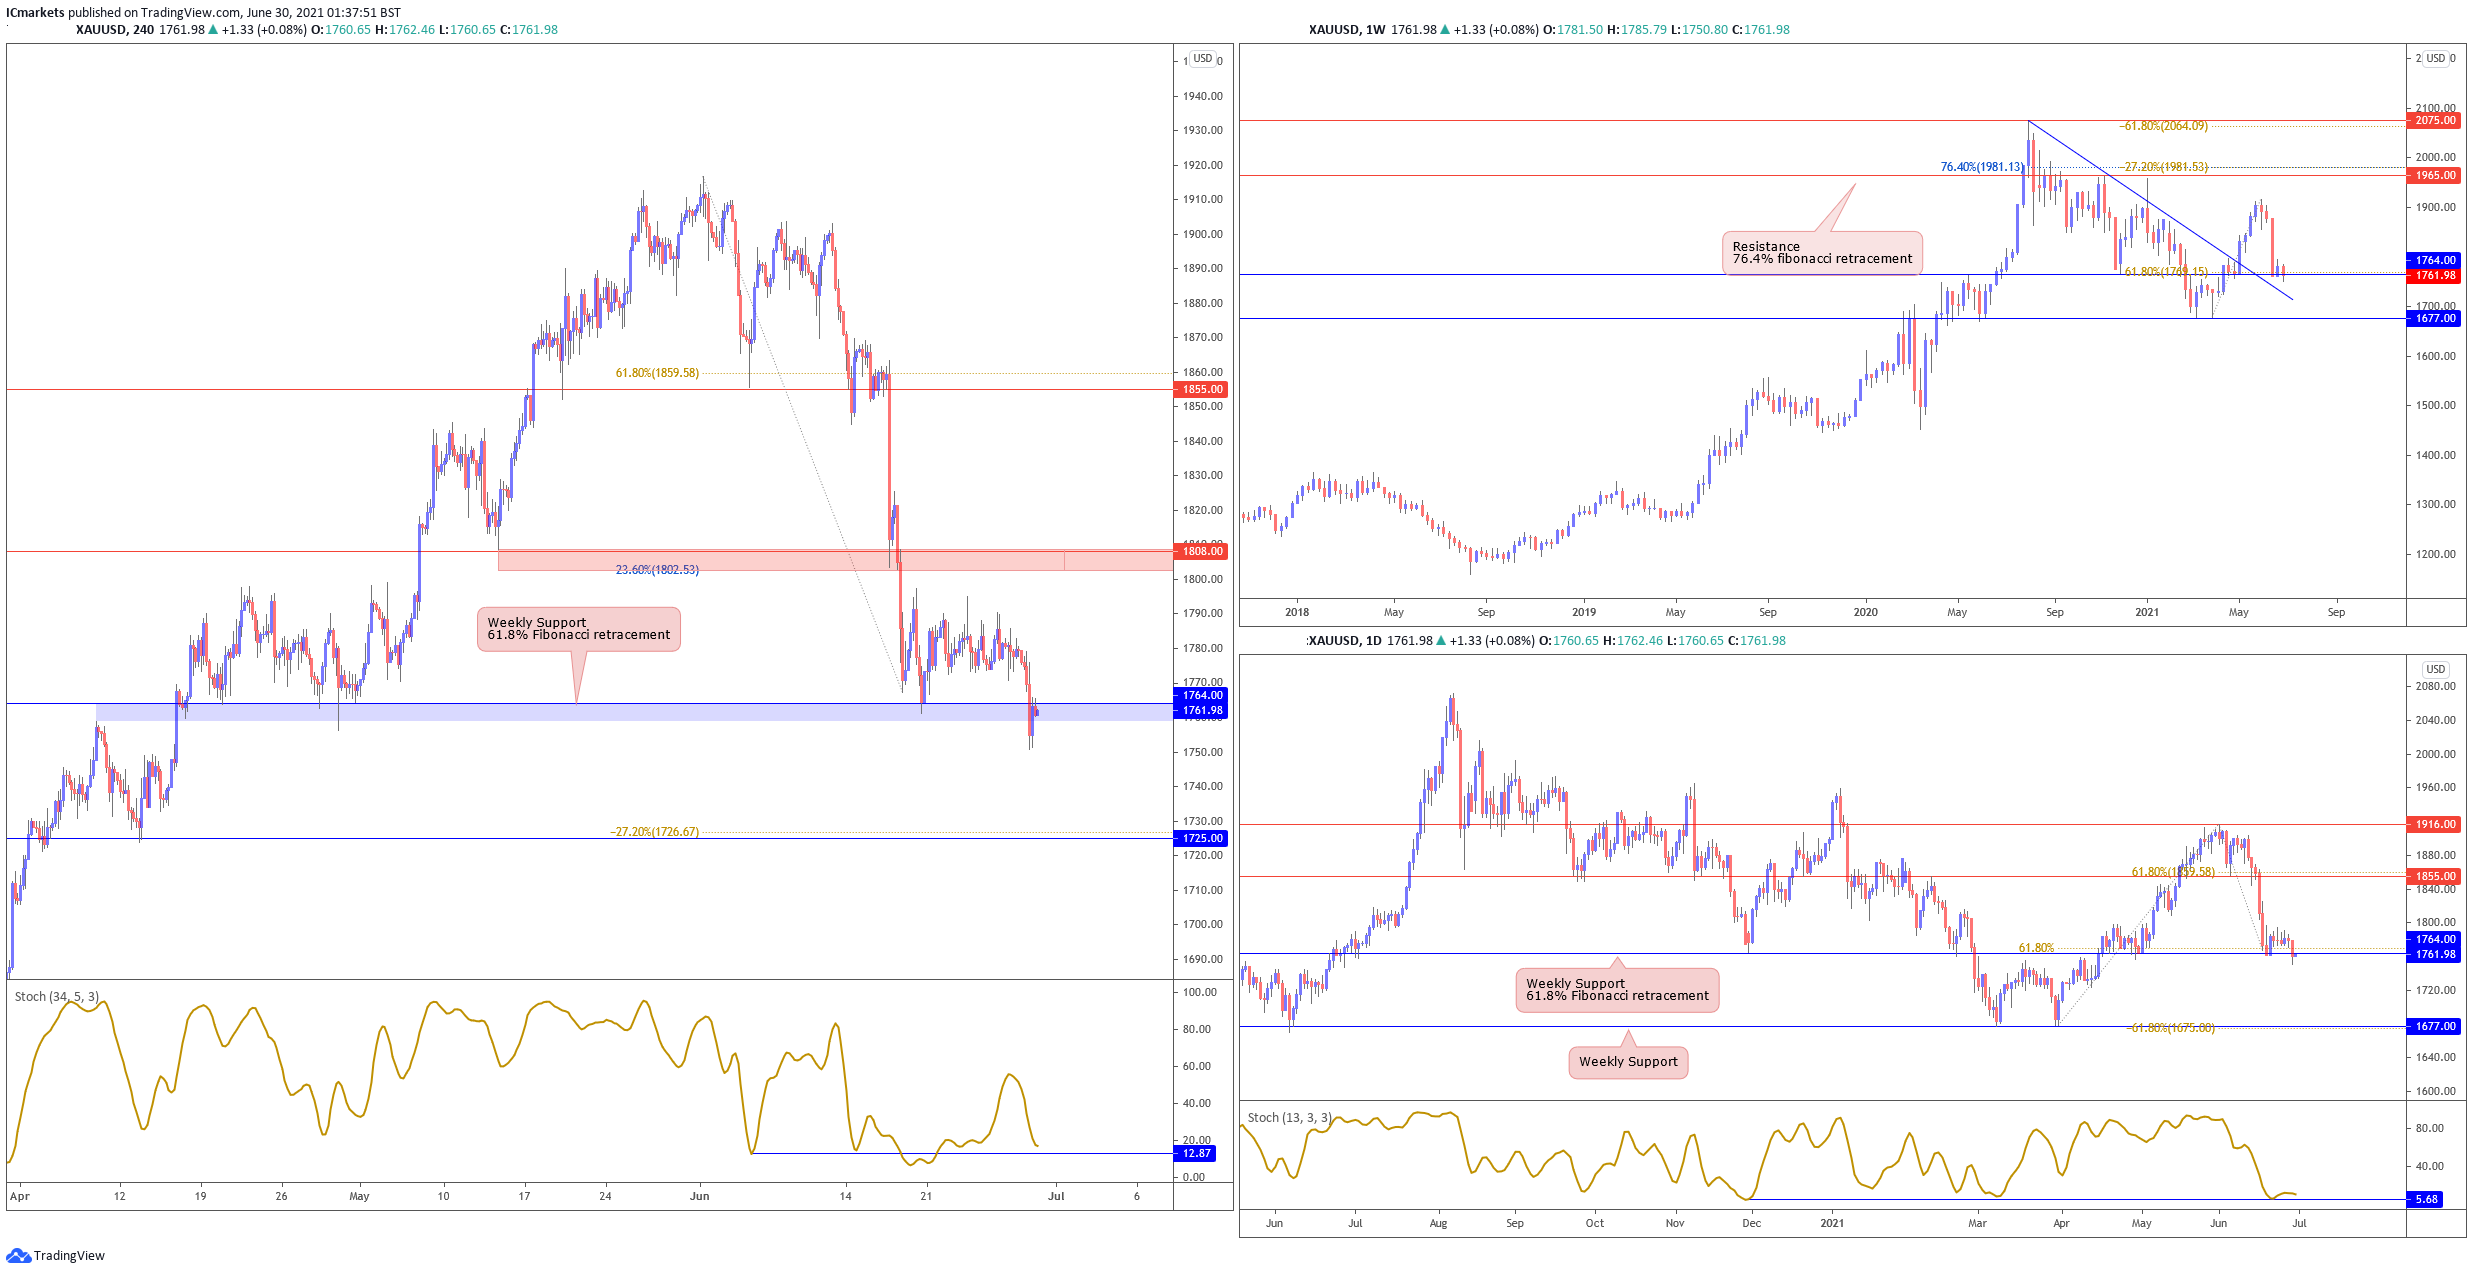
XAU/USD (GOLD):
On the weekly timeframe, price is testing key trendline pullback support at 1764. On the daily, price is also testing key 1764 weekly support. While 1764 support looks fragile, as long as we do not have a daily close below this support, we may see price bounce towards 1855 resistance. Otherwise, breaking below 1764 support, price could drop lower towards 1677 support next.
On the H4, price dropped lower and is testing weekly 1764 support zone. We still see a low probability bullish scenario where buyers could add to their longs above 1764 weekly support with a possible upside target at 1808 resistance. Otherwise, failure to hold within the zone or above 1764 weekly support will see price drop much lower towards next support at 1724. Stochastic is reacting above support where price bounced in the past.
Areas of consideration:
- 1764 support is the key level to watch.
- 1808 resistance on H4 to watch.
The accuracy, completeness and timeliness of the information contained on this site cannot be guaranteed. IC Markets does not warranty, guarantee or make any representations, or assume any liability regarding financial results based on the use of the information in the site.
News, views, opinions, recommendations and other information obtained from sources outside of www.icmarkets.com.au, used in this site are believed to be reliable, but we cannot guarantee their accuracy or completeness. All such information is subject to change at any time without notice. IC Markets assumes no responsibility for the content of any linked site.
The fact that such links may exist does not indicate approval or endorsement of any material contained on any linked site. IC Markets is not liable for any harm caused by the transmission, through accessing the services or information on this site, of a computer virus, or other computer code or programming device that might be used to access, delete, damage, disable, disrupt or otherwise impede in any manner, the operation of the site or of any user’s software, hardware, data or property.


