
DXY:
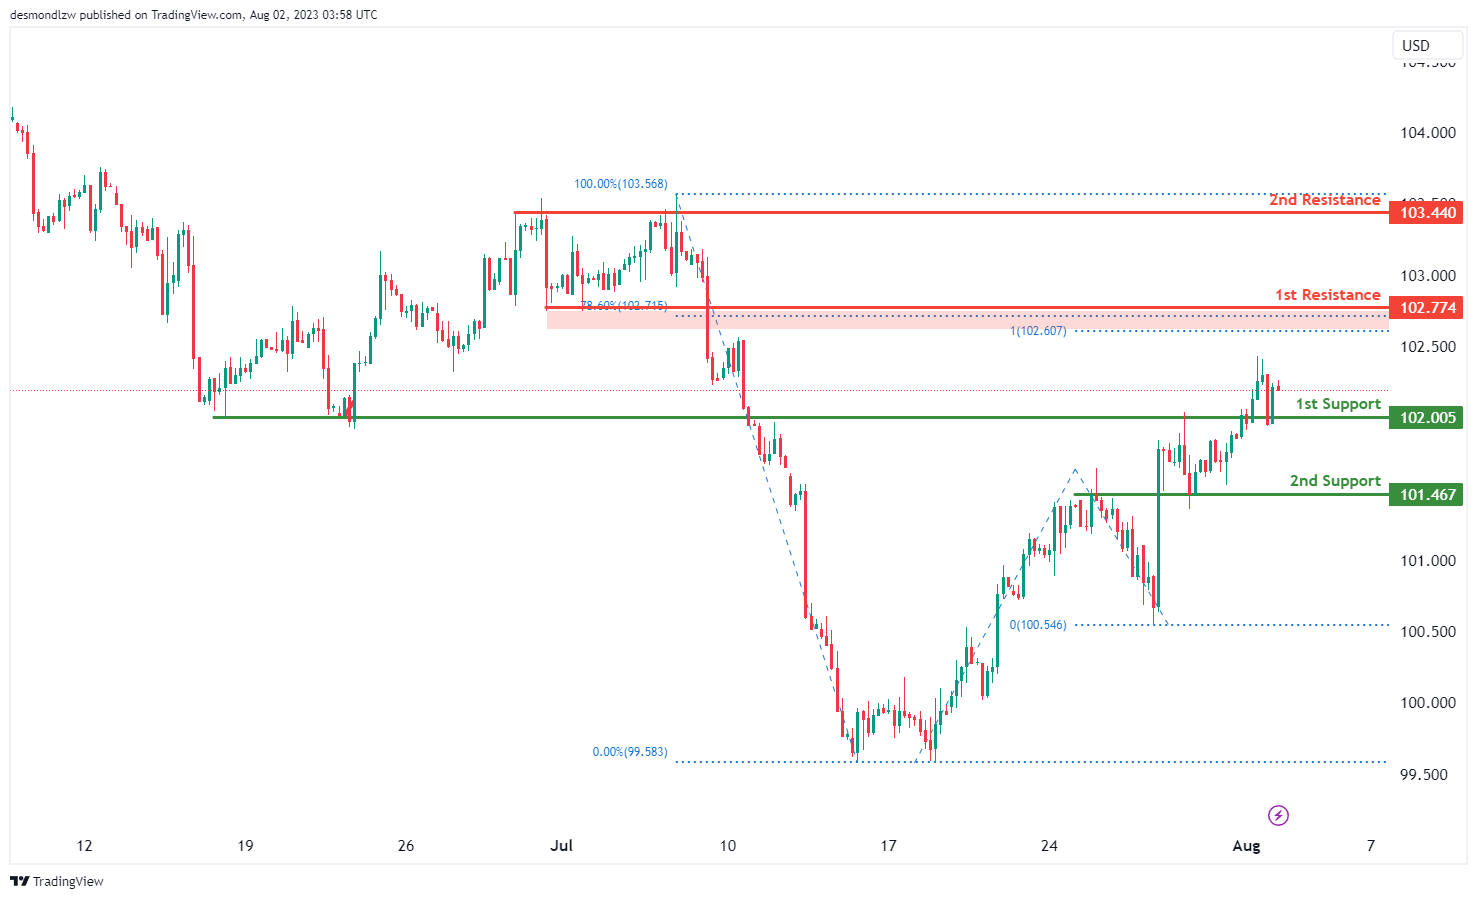
The DXY financial instrument is currently demonstrating bullish momentum, suggesting a potential bullish continuation towards the 1st resistance level at 102.77.
In the scenario of a market pullback, the 1st support level at 102.00 and the 2nd support at 101.46 both serve as critical overlap supports. These levels may provide a solid buffer against any significant price drops.
On the other hand, if the price moves upwards, it could potentially face resistance at the 1st resistance level of 102.77, which is identified as a pullback resistance. Beyond this, the 2nd resistance level at 103.44, recognized for its role as a multi-swing high resistance, may pose additional challenges for any further price increases.
EUR/USD:
The EUR/USD instrument is currently indicating a bearish trend, which suggests a potential bearish continuation towards the 1st support level at 1.0964. This support level holds significance due to its role as an overlap support.
Should the price decrease further, the 2nd support level at 1.0923, functioning as a pullback support and aligning with the 78.60% Fibonacci retracement level, could provide a strong barrier against further downward movement.
On the other hand, if the price attempts to recover, the 1st resistance level at 1.1038, noted for its role as an overlap resistance and its alignment with the 78.60% Fibonacci Projection, could pose a challenge. If the price manages to break past this point, the 2nd resistance level at 1.1142, identified as a swing high resistance, may offer additional resistance to further price progression.

EUR/JPY:
The EUR/JPY chart exhibits a bullish momentum, indicating the potential for a bullish continuation towards the 1st resistance level at 158.01. This resistance level is identified as a multi-swing high resistance, which suggests its significance in potentially halting the price’s upward movement and causing a pullback.
To support the bullish scenario, the chart shows 1st and 2nd support levels at 155.99 and 155.10, respectively. Both of these levels are recognized as overlap supports, adding to their importance in potentially providing a base for the price and contributing to the bullish momentum.
Furthermore, there is a 2nd resistance level at 159.57, which corresponds to the 127.20% Fibonacci Extension. This level is also identified as an overlap resistance and may serve as a significant point of resistance, potentially limiting the price’s further upward movement.

EUR/GBP:
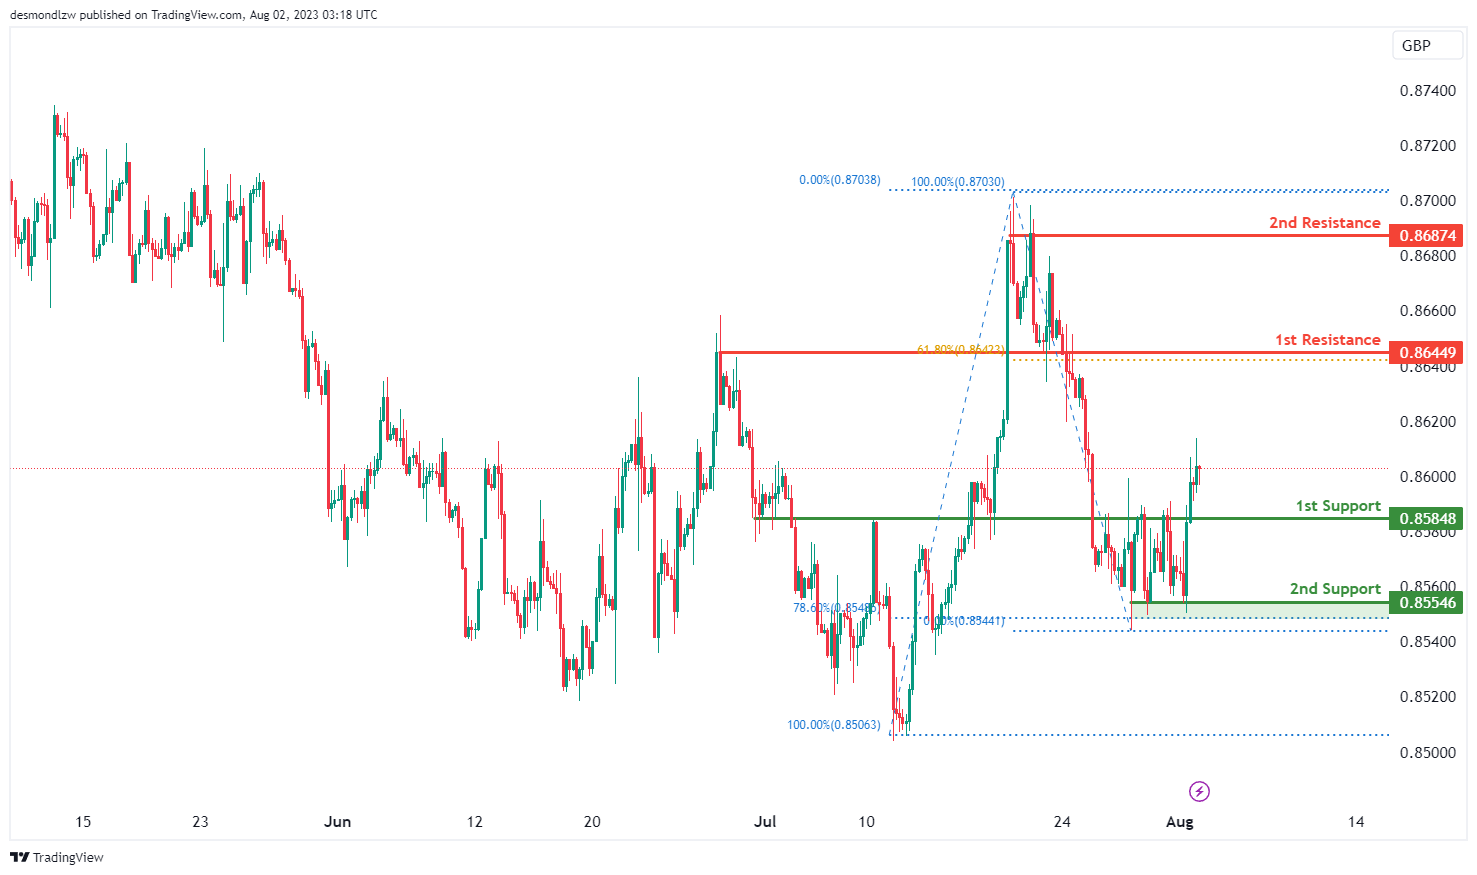
The EUR/GBP chart displays a bullish momentum, indicating the potential for a bullish continuation towards the 1st resistance level at 0.8644. This resistance level is identified as an overlap resistance and also coincides with the 61.80% Fibonacci Retracement, suggesting its significance in potentially halting the price’s upward movement.
To support the bullish scenario, the chart shows 1st and 2nd support levels at 0.8584 and 0.8554, respectively. The 1st support is identified as an overlap support, while the 2nd support represents a multi-swing low support. Both of these levels are essential in providing potential bases for the price and contributing to the overall bullish momentum.
Additionally, there is a 2nd resistance level at 0.8687, recognized as a multi-swing high resistance. This level may act as a crucial point of resistance, potentially limiting the price’s further upward movement.
GBP/USD:
The GBP/USD instrument exhibits a bullish trend, primarily supported by the fact that the price resides above a significant ascending trend line. This positioning suggests a possibility of further bullish momentum.
In this context, a likely scenario could be a bullish continuation towards the 1st resistance level at 1.2876. This resistance level is notable due to its role as an overlap resistance.
On the downside, the 1st support level is at 1.2756, which acts as an overlap support, and could prevent further price decline. If the price drops further, the 2nd support level at 1.2675, another overlap support, could halt this downward progression.
If the price breaks past the 1st resistance level, the 2nd resistance level at 1.2992, marked by a swing high resistance, may present a significant obstacle to additional bullish momentum.

GBP/JPY:
The GBP/JPY chart currently exhibits a neutral momentum, suggesting a lack of clear directional bias. As a result, the price could potentially fluctuate between the 1st support at 182.15 and the 1st resistance at 183.81.
The 1st support level at 182.15 is identified as an overlap support, while the 2nd support at 179.88 is also recognized as an overlap support. These support levels may act as potential barriers, preventing the price from declining further and contributing to the overall neutral momentum.
On the upside, the 1st resistance at 183.81 represents a multi-swing high resistance and also corresponds to the 127.20% Fibonacci Extension level. This resistance level might serve as a crucial point of resistance, potentially restricting the price’s upward movement.

USD/CHF:
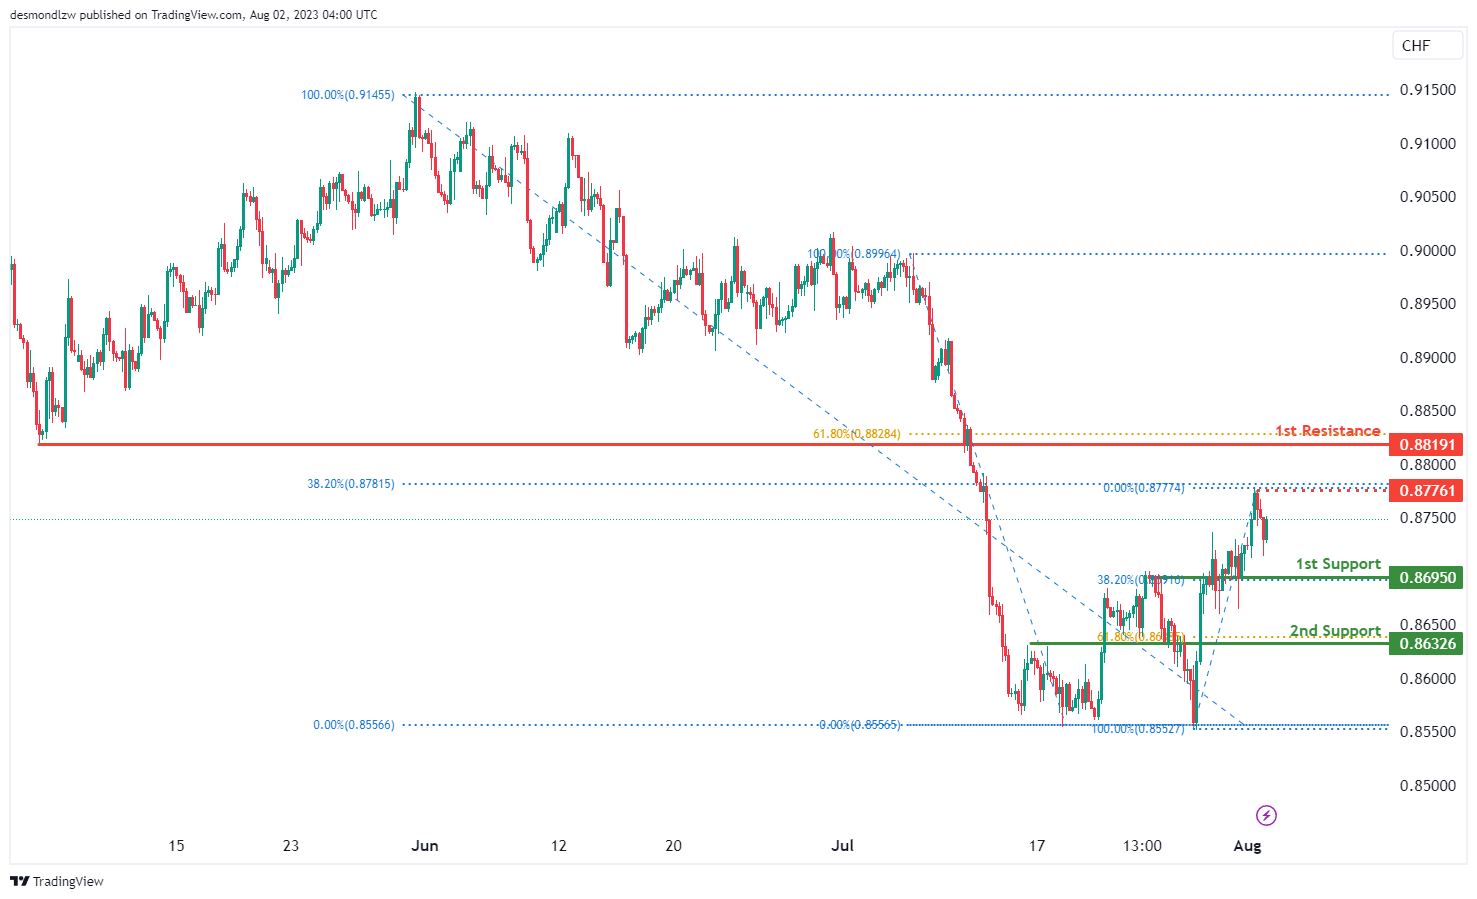
The USD/CHF instrument is currently demonstrating a bullish momentum, indicating a potential bullish continuation towards the 1st resistance level at 0.8819. This resistance level holds significance due to its role as a pullback resistance and its alignment with the 61.80% Fibonacci retracement level.
Should the price begin to decline, the 1st support level at 0.8695, serving as an overlap support, aligns with the 38.20% Fibonacci retracement level and could inhibit further price drop. If the price breaks past this level, the 2nd support level at 0.8632, also an overlap support, aligns with the 61.80% Fibonacci retracement level and could provide a further price floor.
In between, the intermediate resistance at 0.8776, notable as a swing high resistance and aligning with the 38.20% Fibonacci retracement level, could pose a significant hurdle for the bullish price movement
USD/JPY:
The USD/JPY instrument is currently exhibiting a bearish momentum. Based on this, the price has the potential to continue this bearish movement towards the 1st support level at 142.09. This support level is notable due to its role as an overlap support and its alignment with the 23.60% Fibonacci retracement level.
If the price declines further, the 2nd support level at 140.75, acting as a pullback support, aligns with the 50% Fibonacci retracement level and could act as a solid barrier to additional losses.
On the bearish side, the 1st resistance level at 143.87 is significant due to its role as a pullback resistance. This level aligns with the 78.60% Fibonacci retracement and 145.00% Fibonacci extension, suggesting a Fibonacci confluence that could be challenging for bullish movements.
The 2nd resistance level at 144.86, identified as a multi-swing high resistance, could also serve as a substantial obstacle for price increases.
Adding to the bearish momentum, the Relative Strength Index (RSI) is displaying bearish divergence versus the price, suggesting a potential reversal in the near future.

USD/CAD:
The USD/CAD chart is currently exhibiting a bullish momentum as price has experienced a bullish bounce from the 1st support level at 1.3262, which aligns with both an overlap support and the 23.60% Fibonacci retracement level. In addition, the 2nd support level at 1.3153 represents an overlap support that is significant.
Following this bounce, the price might head towards the intermediate resistance at 1.3325, which plays a crucial role in the potential price movement. This resistance level coincides with an overlap resistance, the 78.60% Fibonacci retracement and the 161.80% Fibonacci extension levels, indicating a strong Fibonacci confluence. In case the bullish momentum strengthens, the 1st resistance is at 1.3387 which represents a significant swing high resistance.

AUD/USD:
The AUD/USD chart indicates a weak bullish momentum with low confidence. It’s worth noting that the RSI is displaying bullish divergence versus the price, indicating that a potential bounce might occur soon.
A potential scenario suggests that the price might experience a further drop towards the 1st support at 0.6596 in the short term. This support level is essential as it aligns with an overlap support and the 78.60% Fibonacci projection level. From there, a bounce could occur, leading the price towards the 1st resistance at 0.6640, which represents another significant overlap resistance.
If the bullish momentum strengthens, the price may face further resistance at the 2nd resistance level of 0.6725, which also serves as an important overlap resistance. If price does not bounce off the 1st support level, the 2nd support level at 0.6544 represents a pullback support that coincides with the 100.00% Fibonacci projection level.

NZD/USD
The NZD/USD chart indicates a bearish momentum as price has broken below the 1st support level at 0.6132 this morning, which is a significant area as it aligns with an overlap support and the 78.60% Fibonacci retracement level. This bearish momentum could lead to a drop towards the 2nd support at 0.6065, which also acts as another essential overlap support.
On the upside, the 1st resistance at 0.6221 represents a notable swing high resistance level. Further upward movement may face resistance at the 2nd resistance at 0.6272, which also serves as a significant swing high resistance.

DJ30:
The DJ30 chart indicates a bullish momentum, suggesting a potential bullish continuation towards the 1st resistance level.
For this scenario, the 1st support at 35228.58 is a significant area as it coincides with the 23.60% Fibonacci retracement, serving as an overlap support. Additionally, the 2nd support at 34938.35 acts as a pullback support, corresponding to the 38.20% Fibonacci retracement.
On the upside, the 1st resistance at 35728.64 represents a crucial swing high resistance. Furthermore, the 2nd resistance at 35867.78 is identified as the 127.20% Fibonacci extension, potentially acting as another significant level.

GER30:
The GER30 chart displays a bearish momentum, suggesting the potential for a bearish continuation towards the 1st support level at 16000.84. This support level is identified as multi-swing low support, indicating its significance in potentially halting the price’s downward movement and providing a potential bounce.
On the upside, the chart shows 1st and 2nd resistance levels at 16217.15 and 16319.30, respectively. Both of these levels are recognized as overlap resistances, indicating their importance in potentially limiting the price’s upward movement and causing a pullback.

US500
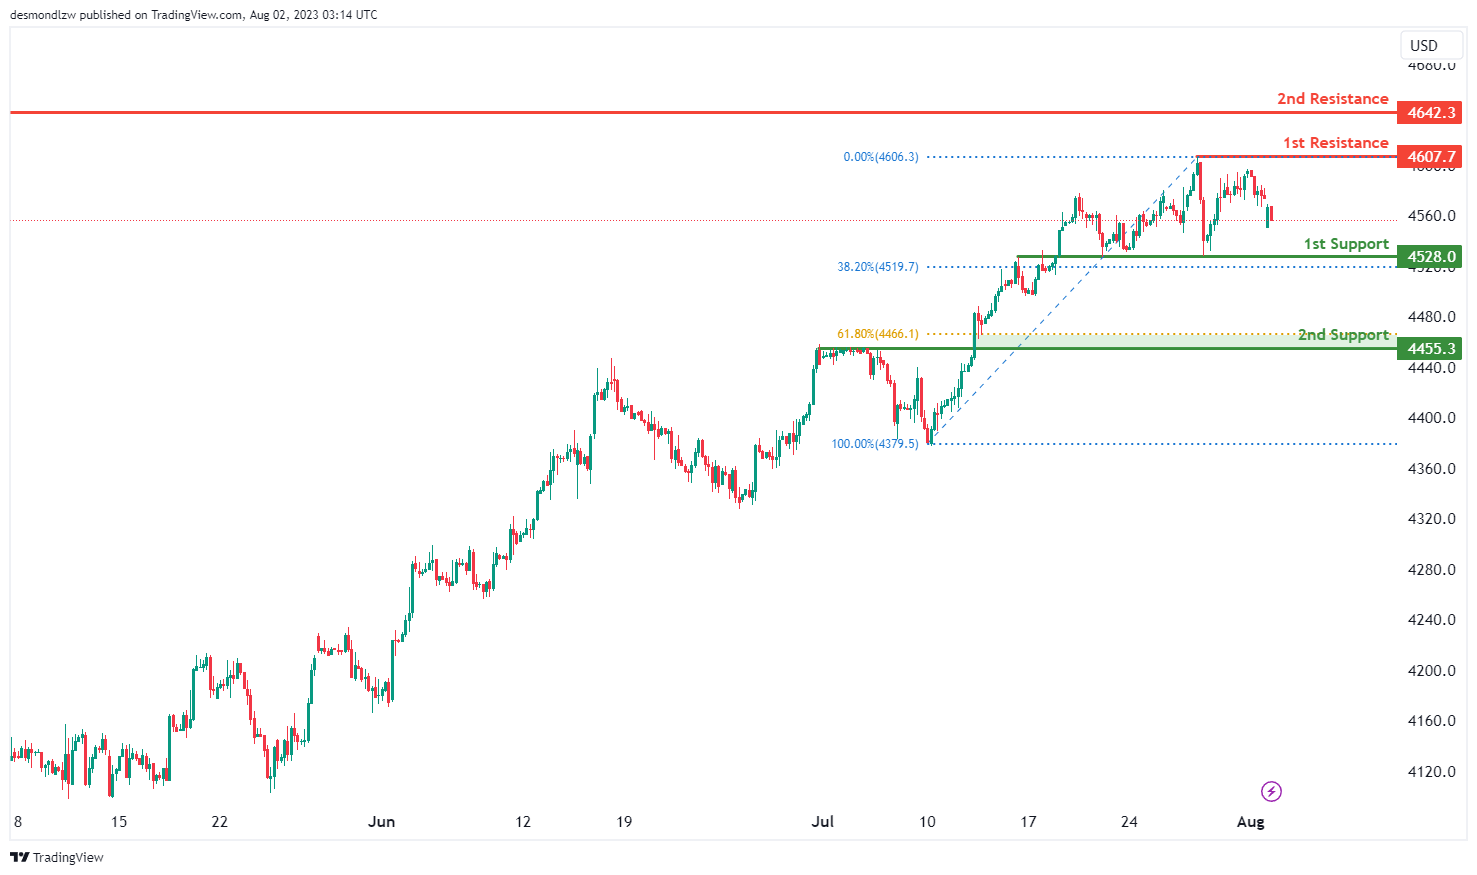
The US500 chart indicates a bearish momentum, suggesting the potential for a bearish continuation towards the 1st support level at 4528.0. This support level is identified as a pullback support and aligns with the 38.20% Fibonacci retracement, adding to its significance in potentially halting the price’s downward movement and causing a bounce.
Additionally, there is a 2nd support level at 4455.3, which is also recognized as a pullback support and corresponds to the 61.80% Fibonacci retracement. This further strengthens its potential as a critical level of support.
On the upside, the chart shows 1st and 2nd resistance levels at 4607.7 and 4642.3, respectively. Both of these levels are recognized as swing high resistances, indicating their importance in potentially limiting the price’s upward movement and causing a pullback.
BTC/USD:
The BTC/USD chart indicates a bullish momentum, suggesting the potential for a bullish continuation towards the 1st resistance level at 30333. This resistance level is significant as it aligns with multi-swing high resistance and also coincides with the 161.80% Fibonacci Extension, adding to its importance as a possible barrier for further upward movement.
For potential downward movements, the chart has 1st and 2nd support levels at 29567 and 28840, respectively. The 1st support is recognized as pullback support, while the 2nd support corresponds to multi-swing low support, both indicating possible levels where the price may find temporary stability and bounce higher.
On the upside, the 2nd resistance at 31271 represents another relevant level as it is an overlap resistance, indicating its potential significance in capping the price’s upward movement.

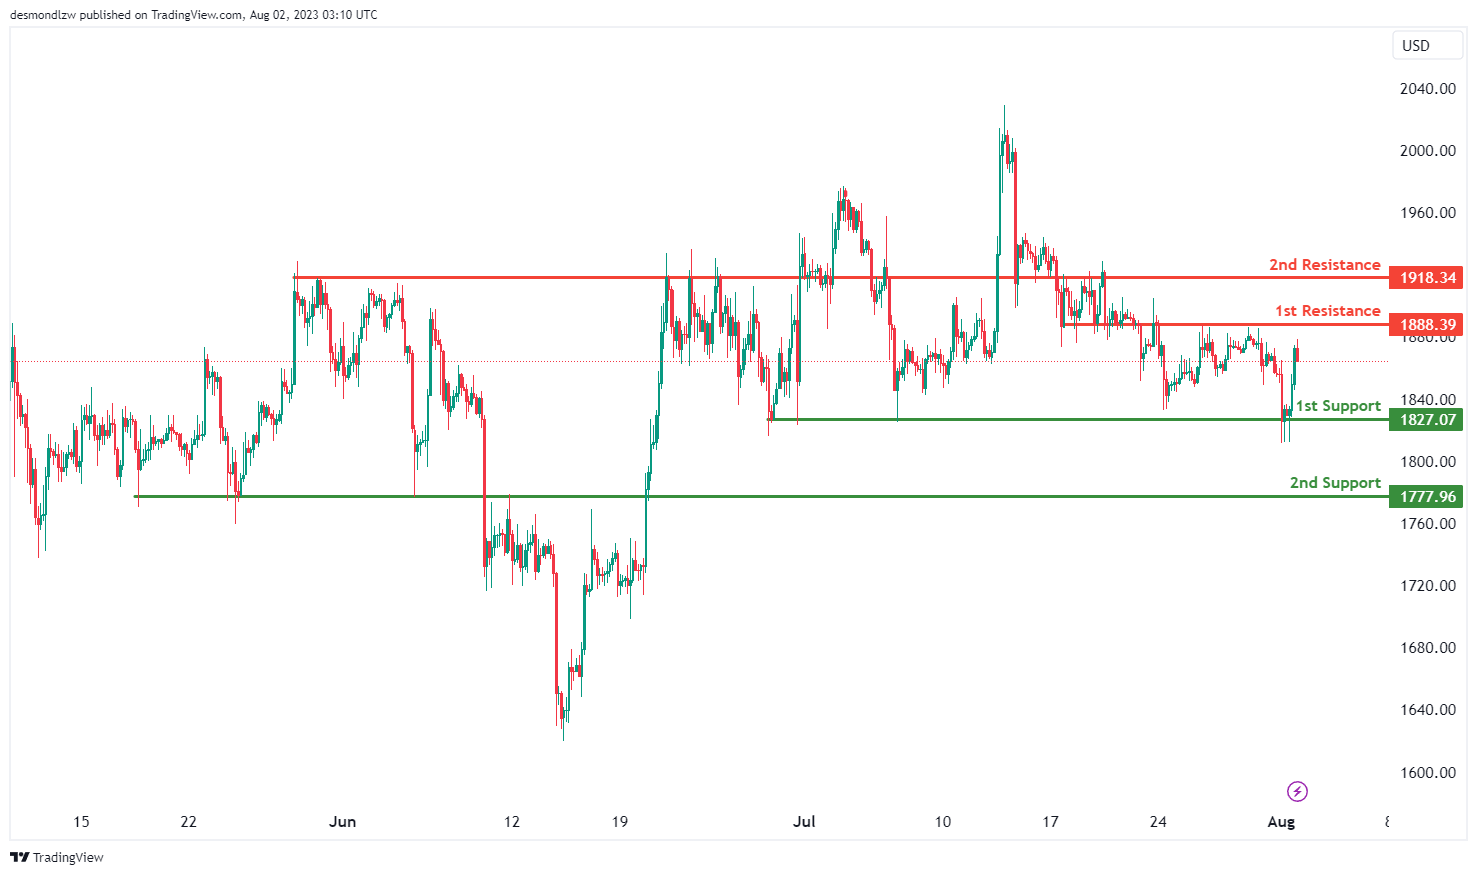
ETH/USD:
The ETH/USD chart exhibits a bullish momentum, suggesting the potential for a bullish continuation towards the 1st resistance level at 1888.39. This resistance level is recognized as an overlap resistance, indicating its significance in potentially halting the price’s upward movement.
For potential downward movements, the chart has 1st and 2nd support levels at 1827.07 and 1777.96, respectively. The 1st support is identified as multi-swing low support, while the 2nd support serves as an overlap support, both indicating possible levels where the price may find temporary stability and bounce higher.
On the upside, the 2nd resistance at 1918.34 represents another relevant level, adding to its importance as it also coincides with an overlap resistance.
WTI/USD:
The WTI/USD chart currently shows a weak bearish momentum with low confidence. There is a potential scenario for a bearish continuation towards the 1st support level at 80.31, which is an overlap support. If the bearish momentum persists, the price might further drop towards the 2nd support at 78.76, which also acts as another overlap support.
On the upside, the 1st resistance at 83.27 is considered an overlap resistance, suggesting a potential barrier for upward movement.
It is also worth noting that the RSI is displaying bearish divergence versus price, indicating a possible weakening of the current uptrend and a potential rapid decline in price.

XAU/USD (GOLD):
The XAU/USD instrument is currently displaying neutral momentum. Accordingly, the price could potentially fluctuate between the 1st resistance and the 1st support level.
The 1st support level at 1938.59, which acts as an overlap support, serves as a critical barrier for potential downward movements. If the price falls further, the 2nd support at 1929.36, representing a pullback support and aligning with the 61.80% Fibonacci retracement, could provide a strong level of support.
On the upside, the 1st resistance level is at 1953.42. This level is significant due to its role as an overlap resistance and its alignment with the 38.20% Fibonacci retracement. The 2nd resistance level at 1970.48, identified as a swing high resistance, aligns with the 100% Fibonacci projection, potentially challenging further bullish progressions.
The chart pattern is currently forming a symmetrical triangle, often interpreted as a period of consolidation before a decisive movement. A breakout above the upper trendline could signal a bullish trend, while a breakdown below the lower trendline might indicate a bearish tren

The accuracy, completeness and timeliness of the information contained on this site cannot be guaranteed. IC Markets does not warranty, guarantee or make any representations, or assume any liability regarding financial results based on the use of the information in the site.
News, views, opinions, recommendations and other information obtained from sources outside of www.icmarkets.com, used in this site are believed to be reliable, but we cannot guarantee their accuracy or completeness. All such information is subject to change at any time without notice. IC Markets assumes no responsibility for the content of any linked site.
The fact that such links may exist does not indicate approval or endorsement of any material contained on any linked site. IC Markets is not liable for any harm caused by the transmission, through accessing the services or information on this site, of a computer virus, or other computer code or programming device that might be used to access, delete, damage, disable, disrupt or otherwise impede in any manner, the operation of the site or of any user’s software, hardware, data or property.


