
DXY:
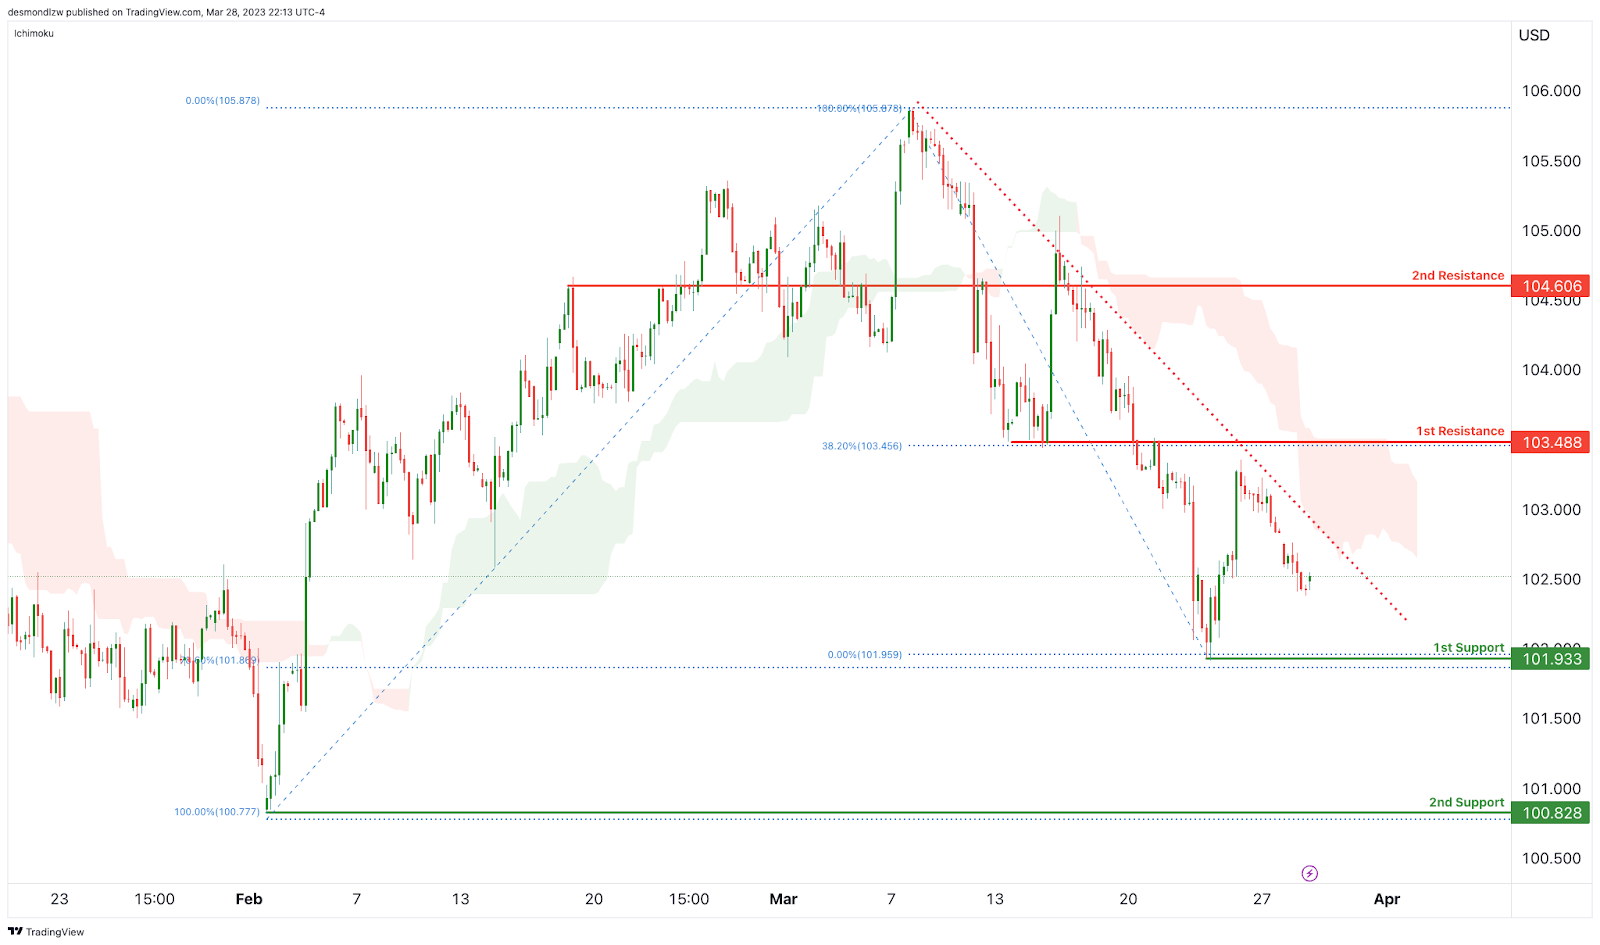
The overall momentum of the DXY chart is currently weakly bearish with low confidence, as price is trading below a major descending trend line and the bearish Ichimoku cloud. This suggests that bearish momentum is potentially on the cards.
There is a potential for a bearish continuation towards the first support level, which is at 101.93. This level is a swing low support and also has the 78.60% Fibonacci retracement lining up with it, making it a strong level to keep an eye on. If price were to break below this level, it could potentially drop down to the second support level at 100.82, which is also a swing low support.
On the upside, the first resistance level is at 103.48. This level is a pullback resistance and also coincides with a 38.20% Fibonacci retracement, making it a strong level of resistance. If price is able to break above this level, it could potentially trigger a bullish acceleration towards the second resistance level at 104.60, which is an overlap resistance.
It’s worth noting that while the current momentum of the DXY chart is weakly bearish with low confidence, it’s always important to keep an eye on the support and resistance levels. A break below the first support level at 101.93 could trigger a move down to the second support level at 100.82, while a break above the first resistance level at 103.48 could trigger a move up to the second resistance level at 104.60.
EUR/USD:
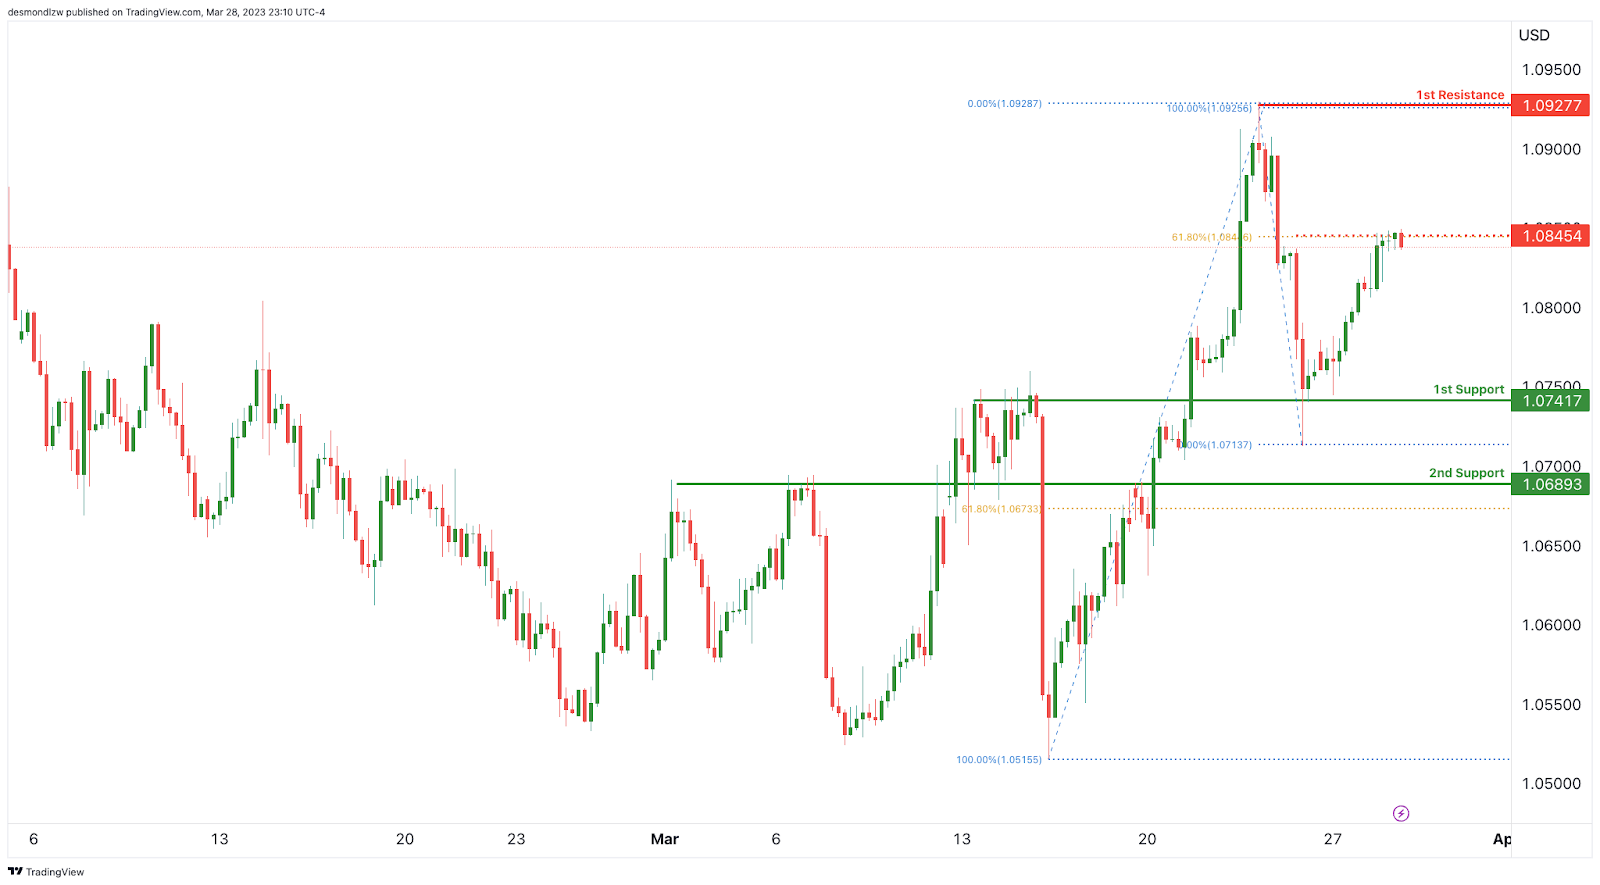
Looking at the EUR/USD chart, the overall momentum of the chart is weakly bearish with low confidence, as price is currently below a major descending trend line, which suggests the potential for further bearish momentum.
If the bearish momentum continues, price could potentially drop towards the 1st support level at 1.07417, which is an overlap support. If price were to break below this level, the next support level to watch out for would be the 2nd support at 1.06893, which is also an overlap support.
On the other hand, if price were to reverse, it could potentially rise towards the 1st resistance level at 1.09277, which is a swing high resistance. Traders should keep an eye on this level, as a break above it could signal a potential bullish reversal.
It’s worth noting that the current momentum of the EUR/USD chart is weakly bearish, and traders should remain cautious and keep an eye on support and resistance levels. A break below the 1st support level could trigger a move down to the 2nd support level, while a break above the 1st resistance level could trigger a move up to higher resistance levels.
GBP/USD:
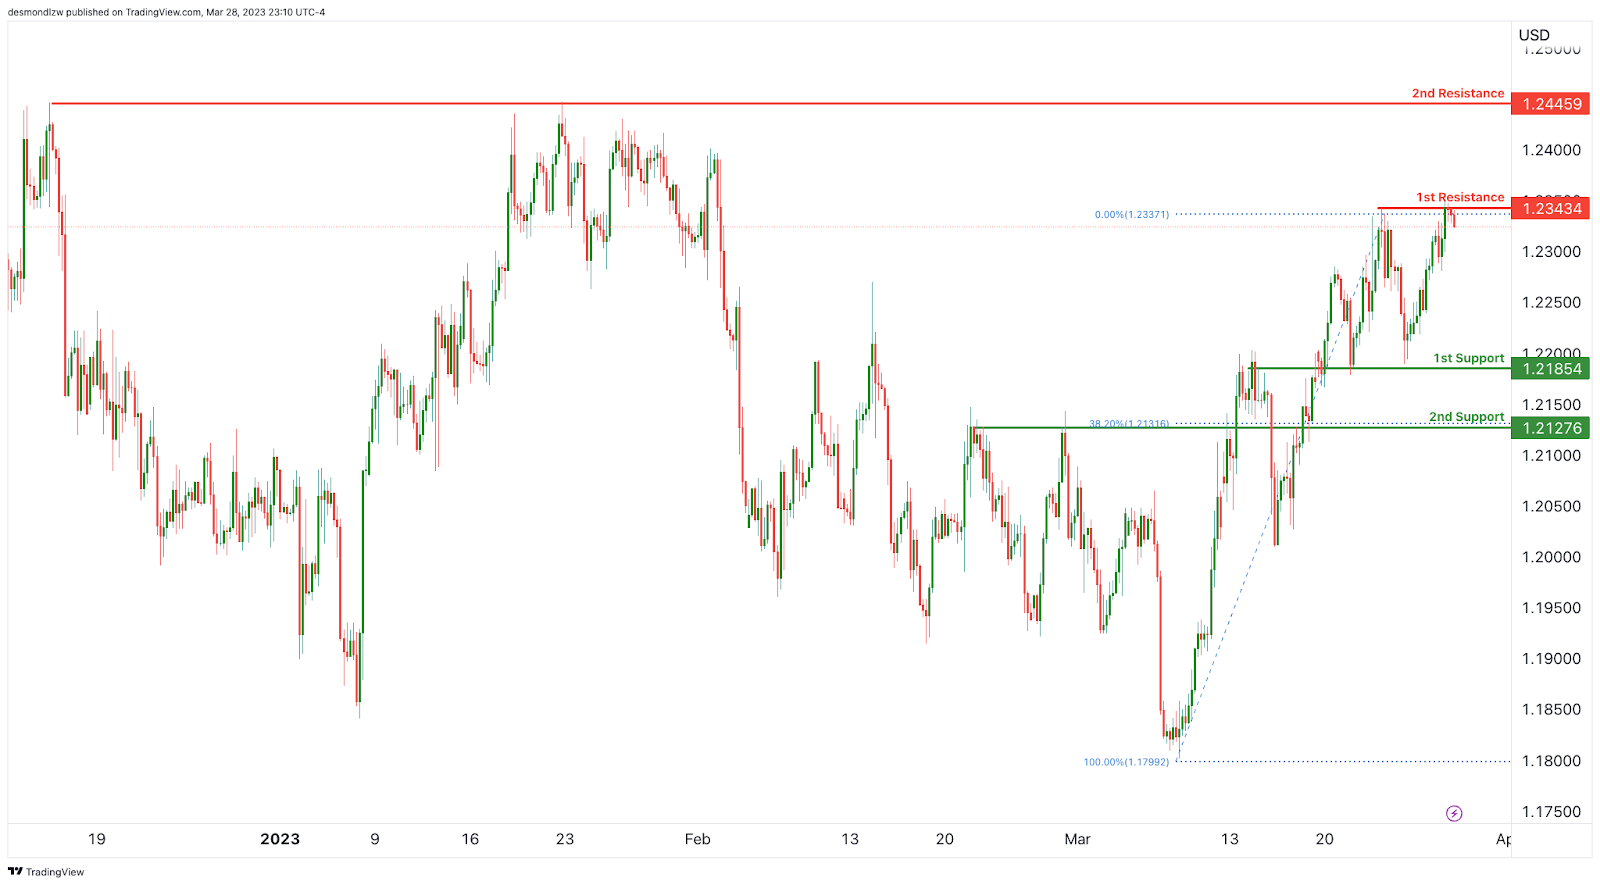
The GBPUSD chart is showing weak bearish momentum with low confidence. This is due to the fact that the price is currently below a major descending trend line, suggesting a potential for further bearish momentum.
Price could potentially continue its bearish trend towards the 1st support level at 1.21854, which is a good level to watch as it is an overlap support. Another potential support level to keep an eye on is the 2nd support at 1.21276, which is also an overlap support and aligns with the 38.20% Fibonacci retracement.
On the other hand, the 1st resistance level is at 1.23434, which is a swing high resistance level and a strong level to watch. If price were to break above this level, the next resistance level to look out for would be the 2nd resistance at 1.24459, which is another overlap resistance level.
It’s worth noting that while the overall momentum of the chart is weak bearish, traders should keep an eye on the support and resistance levels. A break below the 1st support level at 1.21854 could trigger a move down to the 2nd support level at 1.21276, while a break above the 1st resistance level at 1.23434 could trigger a move up to the 2nd resistance level at 1.24459.
USD/CHF:
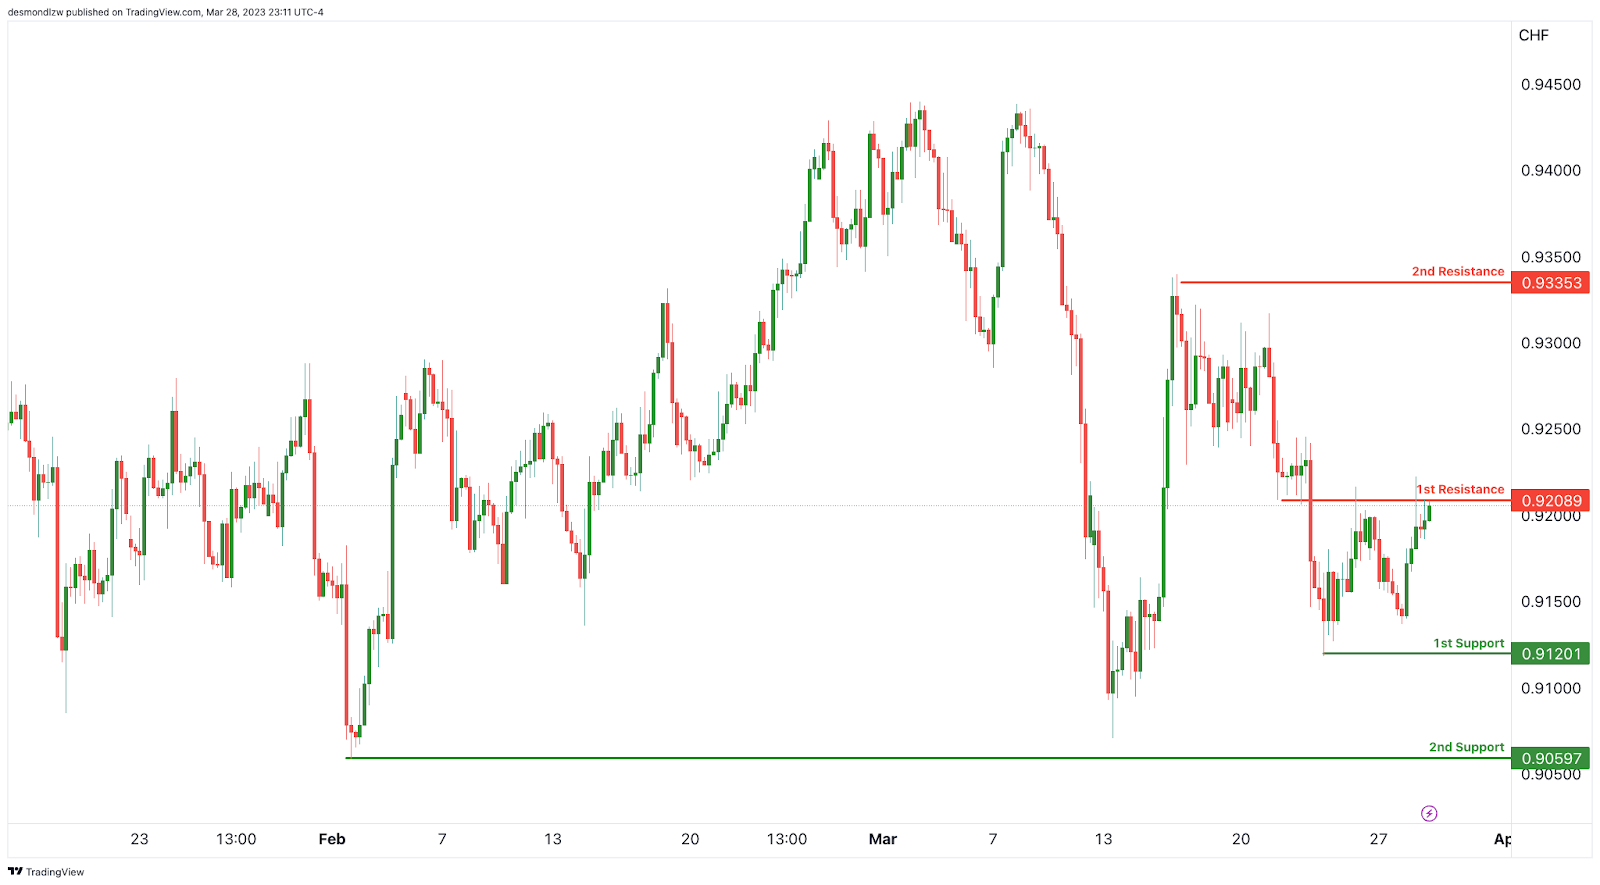
The USD/CHF chart is currently showing weak bearish momentum, with low confidence. This is due to the fact that price is below a major descending trend line, which suggests that bearish momentum is likely to continue.
Looking at potential price movements, there is a possibility of a bearish reaction off the first resistance level at 0.92089, which is an overlap resistance. This could cause prices to drop down towards the first support level at 0.91201, which is a swing low support. If prices were to break through this level, they could potentially drop further towards the second support level at 0.90597, which is also a swing low support.
On the other hand, if prices were to break above the first resistance level, they could potentially rise towards the second resistance level at 0.93353, which is a swing high resistance.
Traders should take note of the key support and resistance levels when making their trading decisions. The first support level at 0.91201 is a strong candidate for a potential bounce, as it is a swing low support. The second support level at 0.90597 is also a swing low support and could provide further support if prices were to drop further.
The first resistance level at 0.92089 is an overlap resistance level, while the second resistance level at 0.93353 is a swing high resistance level. If prices were to break above these levels, they could potentially rise further.
Overall, while the momentum of the chart is weakly bearish, traders should keep an eye on potential market movements and breakouts that could cause prices to rise towards the resistance levels or drop towards the support levels.
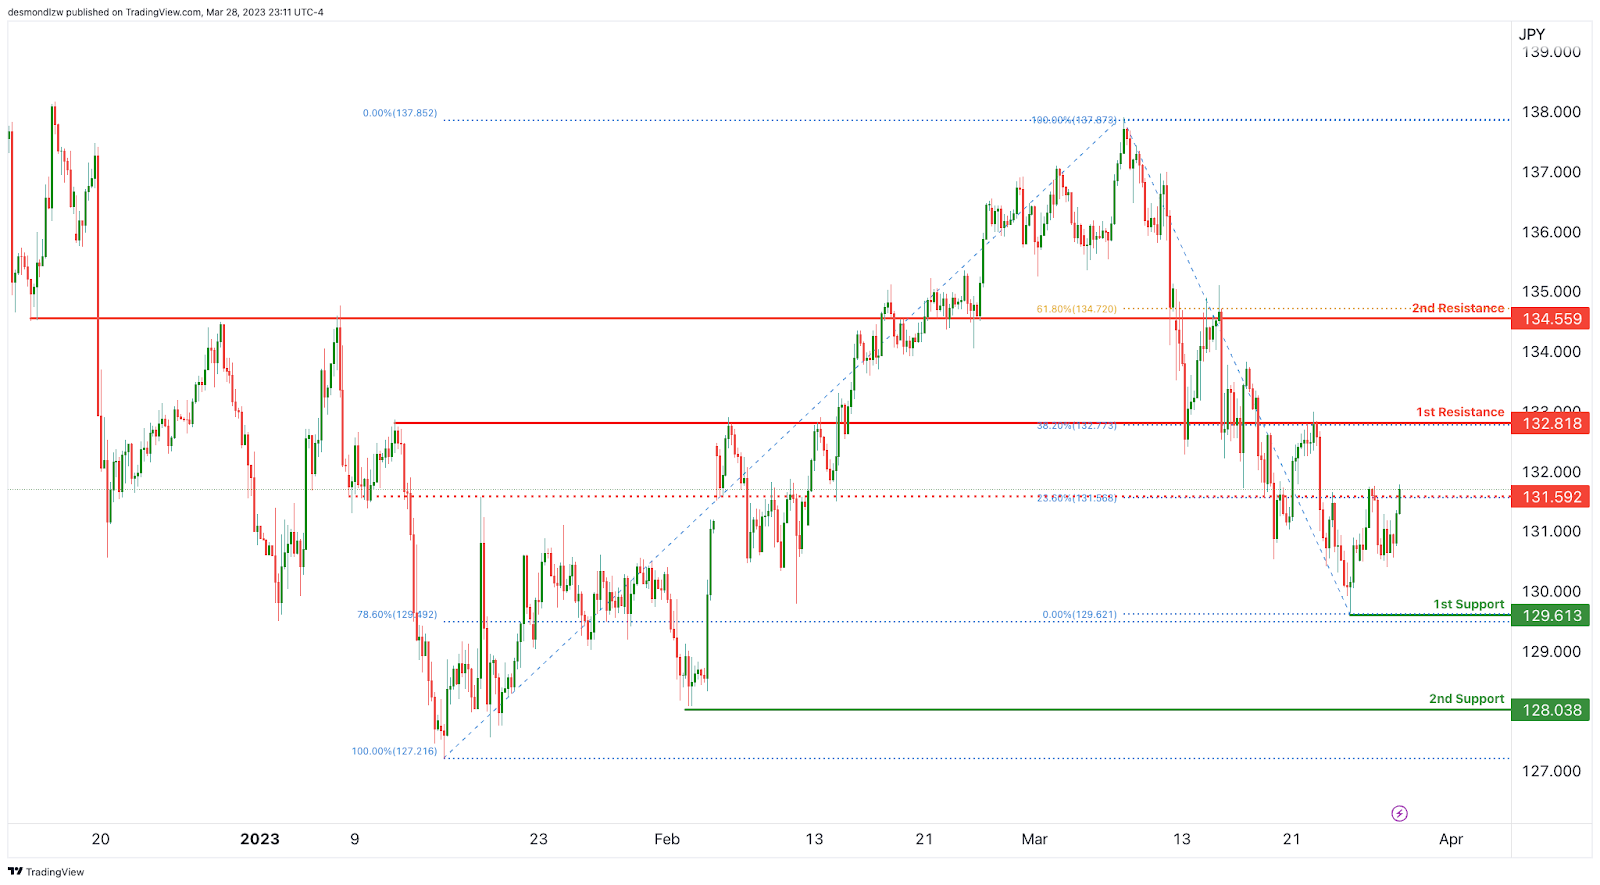
USD/JPY:
Based on the analysis of the USDJPY chart, the overall momentum of the chart is weak bearish with low confidence. This is due to the fact that the price is currently below a major descending trend line, indicating the potential for further bearish momentum.
However, in the short term, the price could potentially rise towards the 1st resistance at 132.818 before reversing off it and dropping towards the 1st support at 129.613. It’s worth noting that the 1st support level is a swing low support, while the 2nd support level at 128.038 is also a swing low support and could provide further support if prices were to drop further.
On the other hand, the 1st resistance level at 132.818 is an overlap resistance, and the 2nd resistance level at 134.559 is also an overlap resistance. These levels could potentially provide resistance to further price increases.
Traders should keep an eye on the chart for any potential breakouts or market movements that could cause prices to rise towards the resistance levels or drop towards the support levels.
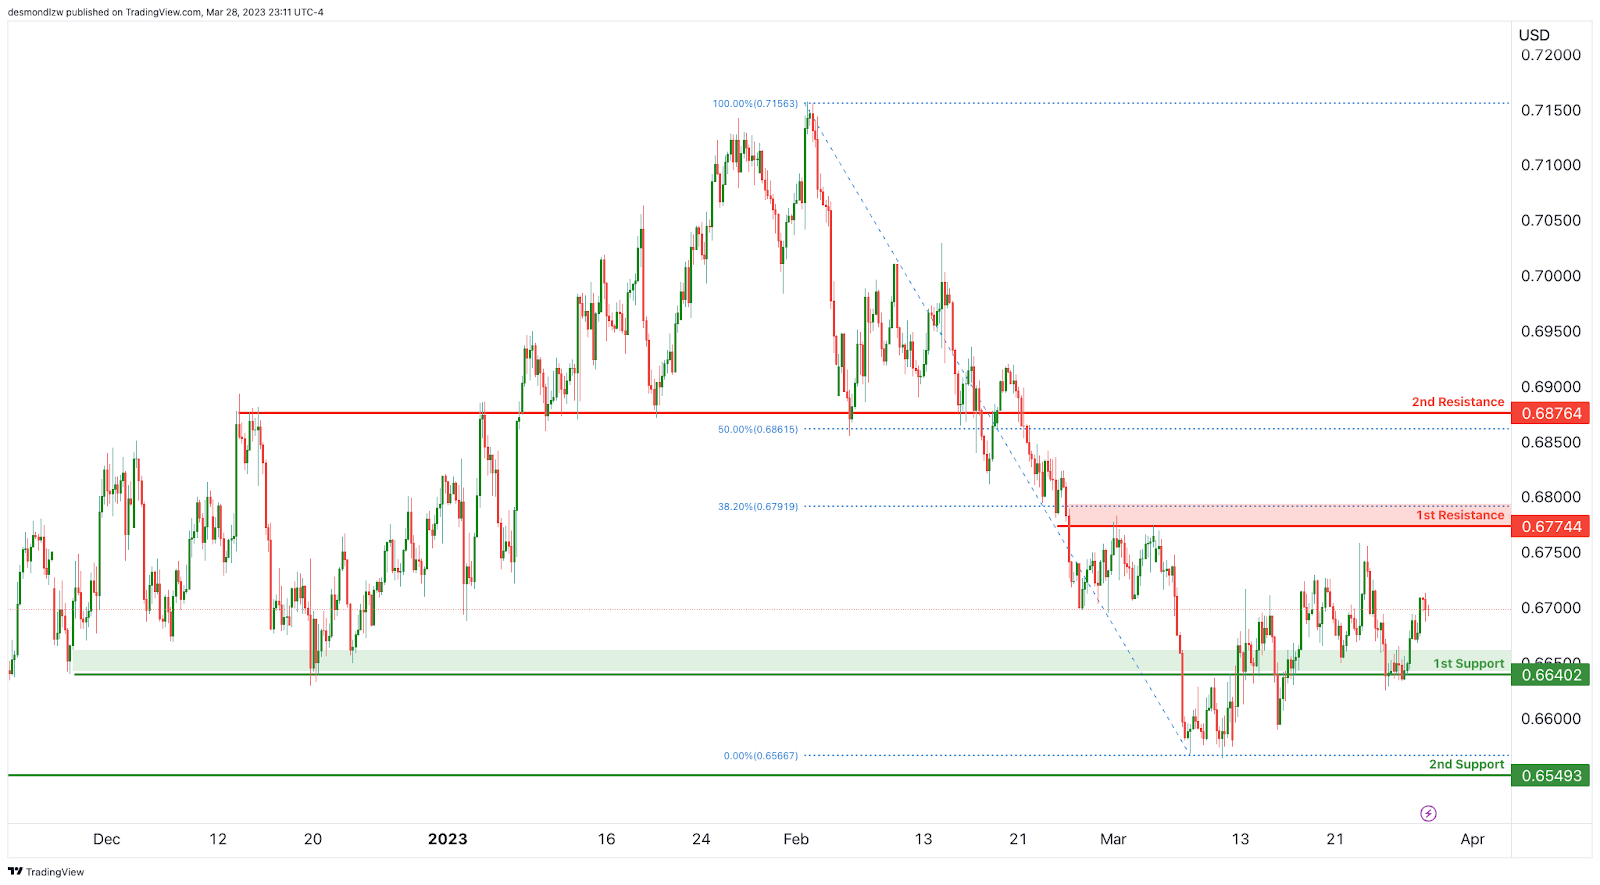
AUD/USD:
The AUDUSD chart is currently displaying a bullish momentum. This is because price is within the bullish Ichimoku cloud, which usually indicates a good support in place.
In the short term, price could potentially continue its bullish trend towards the 1st resistance level.
The 1st support is at 0.66402 and is a good level due to being an overlap support. The 2nd support is at 0.65493 and is also an overlap support.
On the other hand, the 1st resistance is at 0.67744 and is a good level due to being an overlap resistance and coinciding with the 38.20% Fibonacci retracement. The 2nd resistance is at 0.68764, which is an overlap resistance and coincides with the 50% Fibonacci retracement.
Overall, the bullish momentum in the AUD/USD chart suggests that price may continue to rise towards the 1st resistance level at 0.6774. However, it’s important to monitor the support levels at 0.6640 and 0.6549 in case of a price drop.
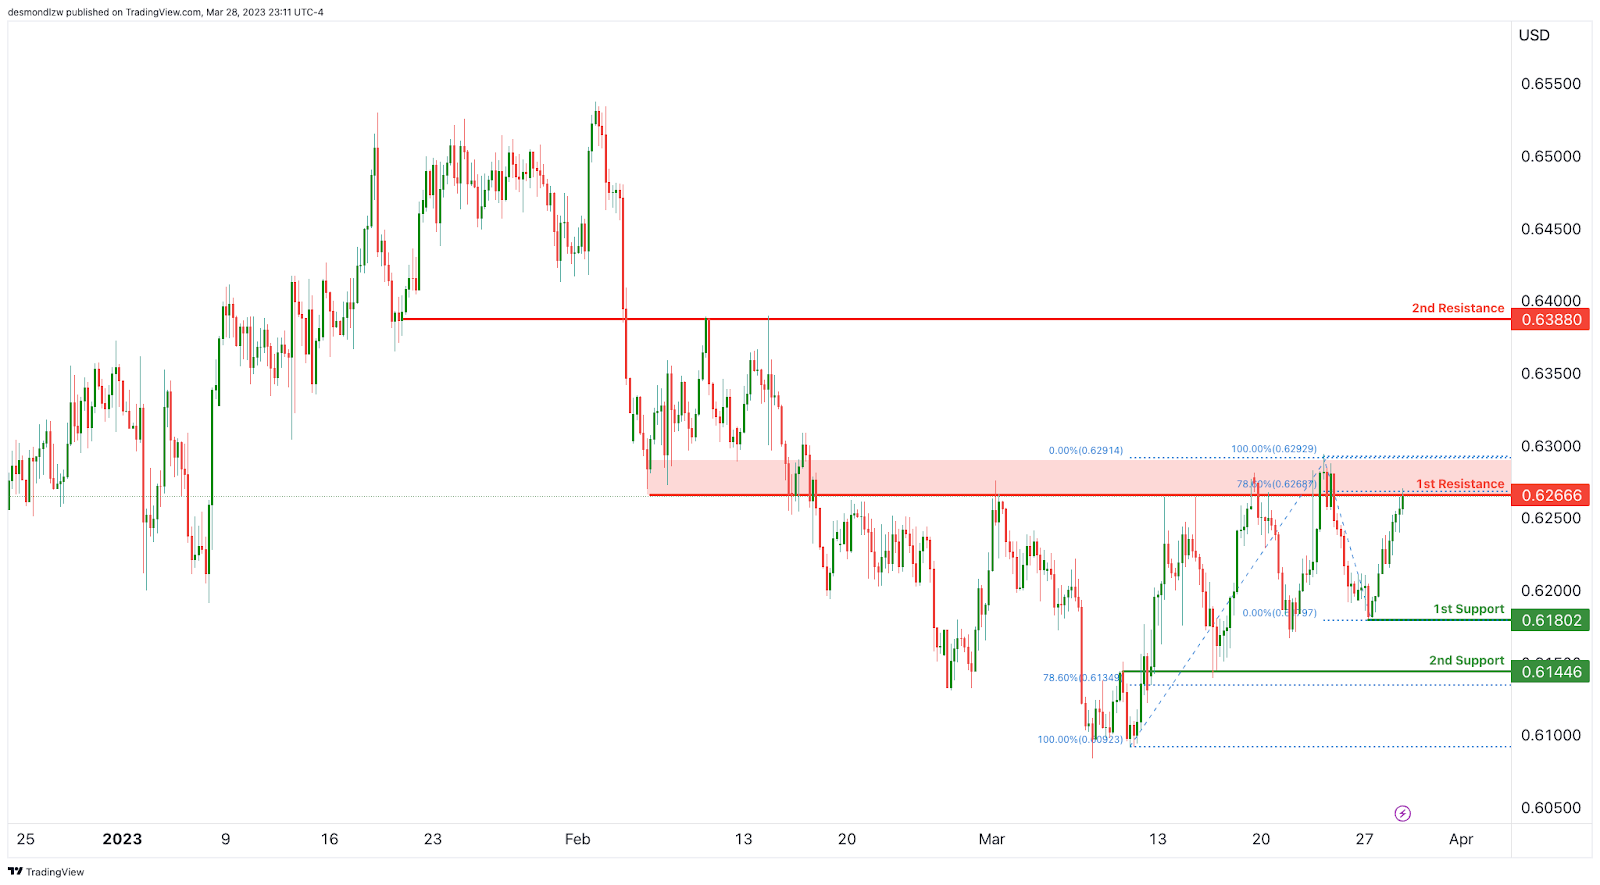
NZD/USD:
The NZDUSD chart is showing strong bullish momentum with price currently above the bullish Ichimoku cloud. This suggests that there is good support in place and the potential for a bullish continuation towards the first resistance level.
The first support level is located at 0.61802 and is a good level due to it being an overlap support. Additionally, there is a second support level at 0.61446 which is also an overlap support.
On the resistance side, the first resistance level is at 0.62666 and is also an overlap resistance. The second resistance level is located at 0.63880 which is another overlap resistance level.
If the bullish momentum continues, price could potentially reach the first resistance level. It’s important to keep an eye on these support and resistance levels as they can provide valuable insights into potential price movements.
Overall, the chart for NZDUSD is showing bullish momentum and traders should be aware of these support and resistance levels as they plan their trades.
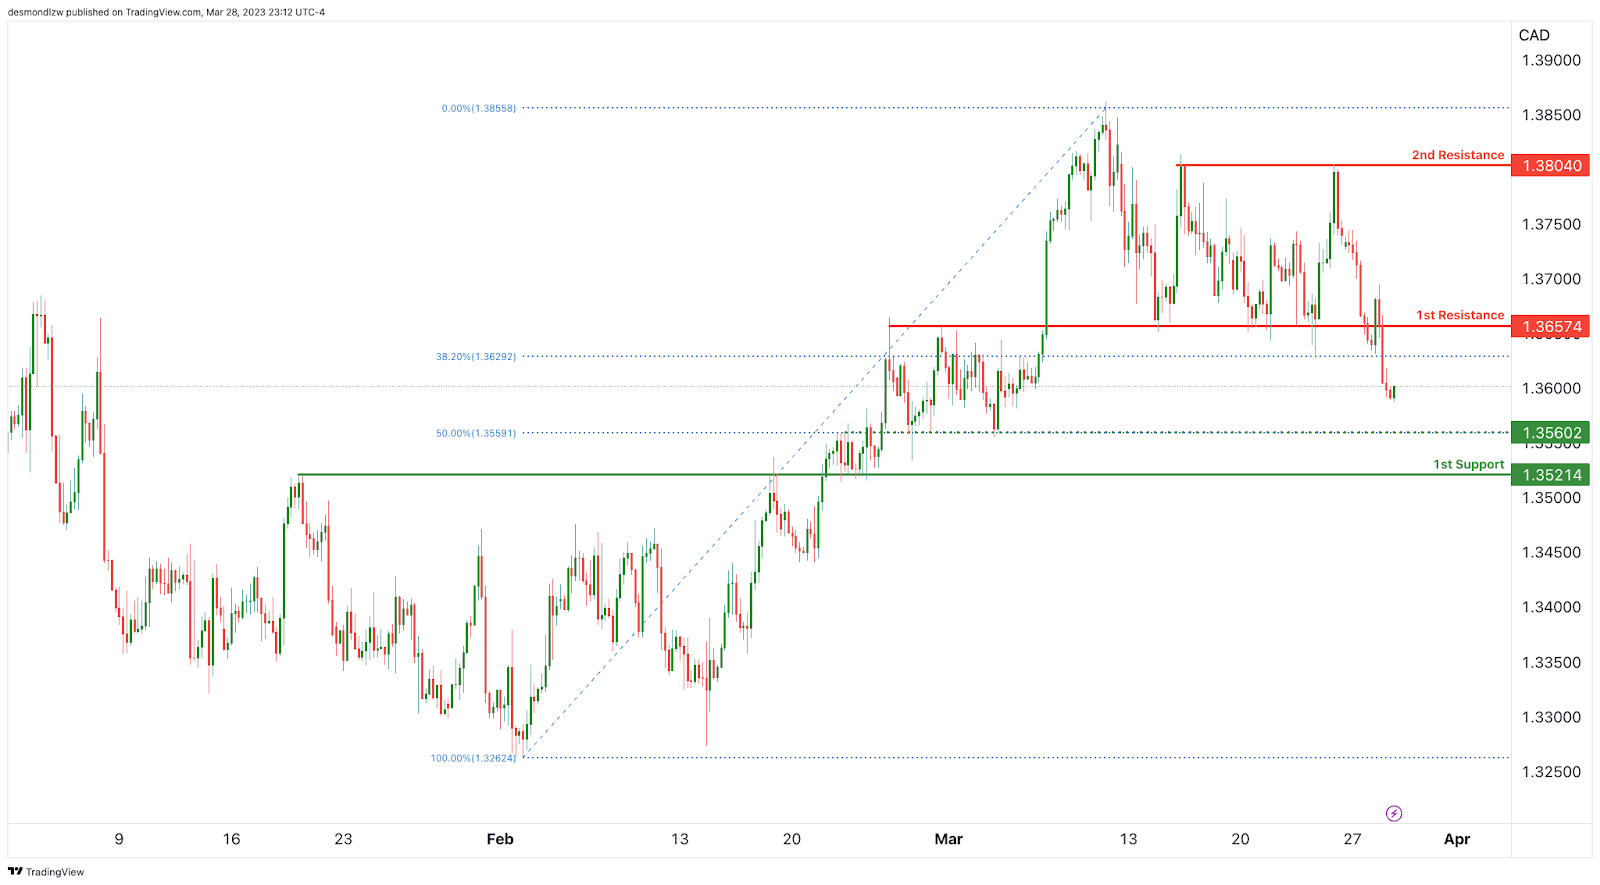
USD/CAD:
The USDCAD currency pair has been in a bearish momentum, with low confidence, as price is currently trading below the bearish Ichimoku cloud and a major descending trend line. This suggests that the bearish momentum could continue in the near term.
In terms of potential price action, there could be a bearish continuation towards the first support level at 1.35602. This support level is significant as it has acted as an overlap support in the past, and it coincides with the 50% Fibonacci retracement level. If the bearish momentum persists, the pair could potentially drop further towards the second support level at 1.35214, which is also an overlap support.
On the other hand, if the bears take a breather, the price may see some bullish retracements towards the first resistance level at 1.36574, which is another significant overlap resistance. If the bulls take control, the price could potentially rise further towards the second resistance level at 1.38040, which is also an overlap resistance.
In conclusion, the USDCAD currency pair has a bearish bias and could potentially continue its bearish momentum towards the first support level at 1.5602. However, if the price sees a bullish retracement, it may face resistance at the first resistance level at 1.36574. Traders should keep an eye on the key levels mentioned above and wait for a clear confirmation of the trend before making any trading decisions.
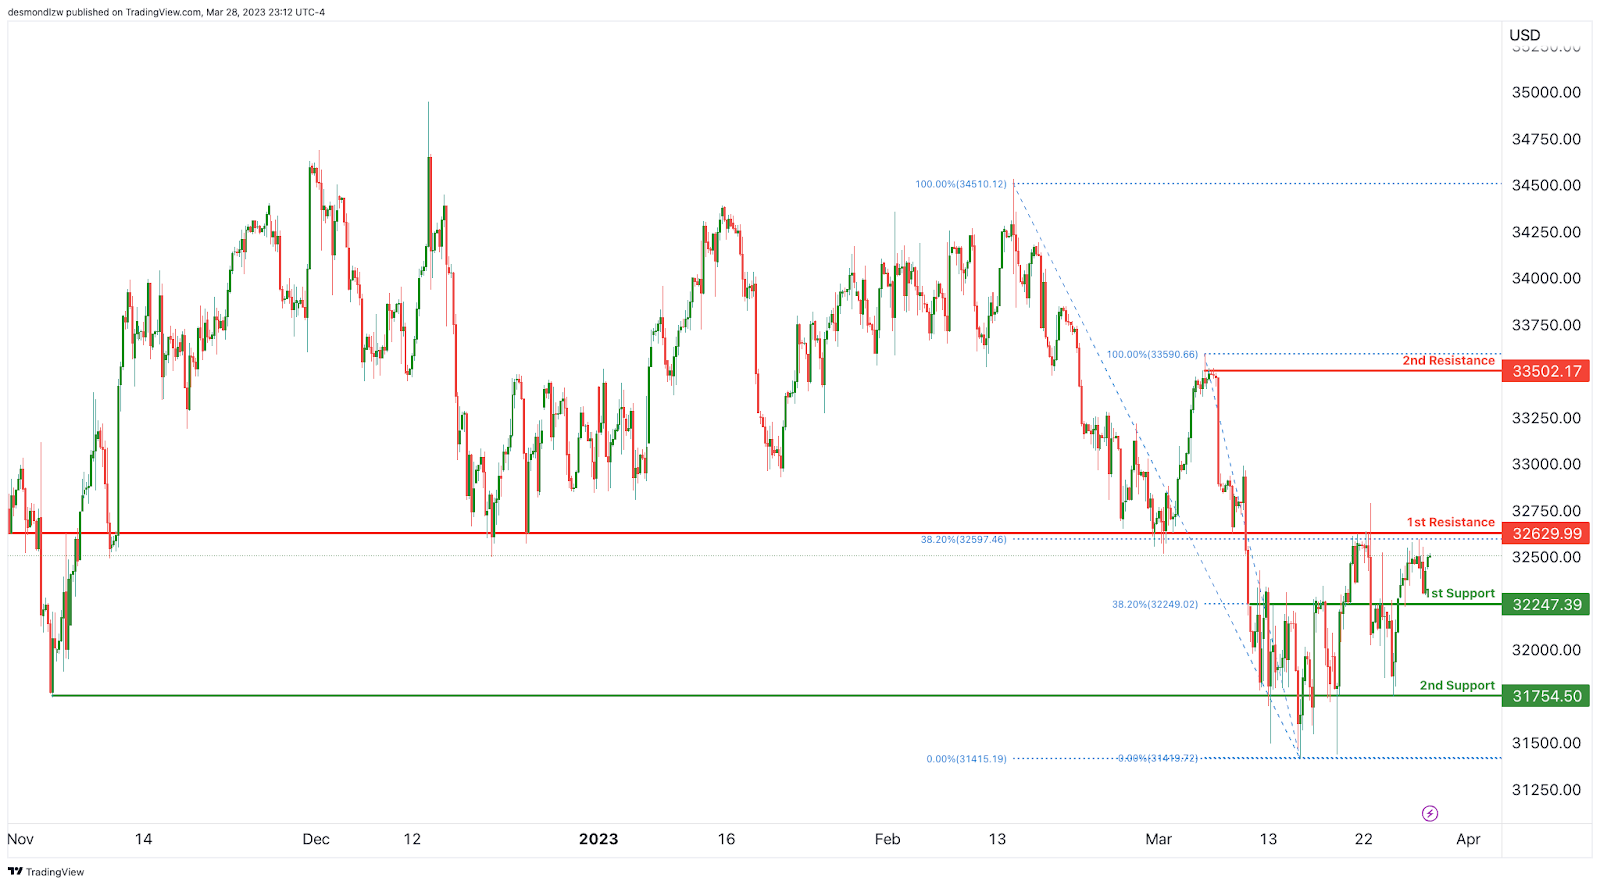
DJ30:
The DJ30 chart currently shows a neutral momentum, indicating that there is no clear direction or trend at present. However, it is likely that the price may fluctuate between the 1st resistance and 1st support levels in the short term.
The 1st support level is located at 32247.39 and is a significant level as it is an overlap support and is also at the 38.20% Fibonacci retracement level. This level has the potential to provide a strong bounce for the price in case of a drop.
The 2nd support level is situated at 31754.50 and is another overlap support level. It could be a significant support level if price continues to drop below the 1st support level.
On the resistance side, the 1st resistance level is located at 32629.99 and is an overlap resistance. Additionally, it is also at the 38.20% Fibonacci retracement level. This level could pose as a significant barrier for the price in case of a bullish move.
The 2nd resistance level is situated at 33502.17 and is also an overlap resistance. It could be a significant resistance level if price continues to rise above the 1st resistance level.
In summary, the DJ30 chart shows a neutral momentum with price currently fluctuating between the 1st support and 1st resistance levels. The 1st support level at 32247.39 and the 1st resistance level at 32629.99 are key levels to watch out for as they are significant and could have a strong impact on price action.
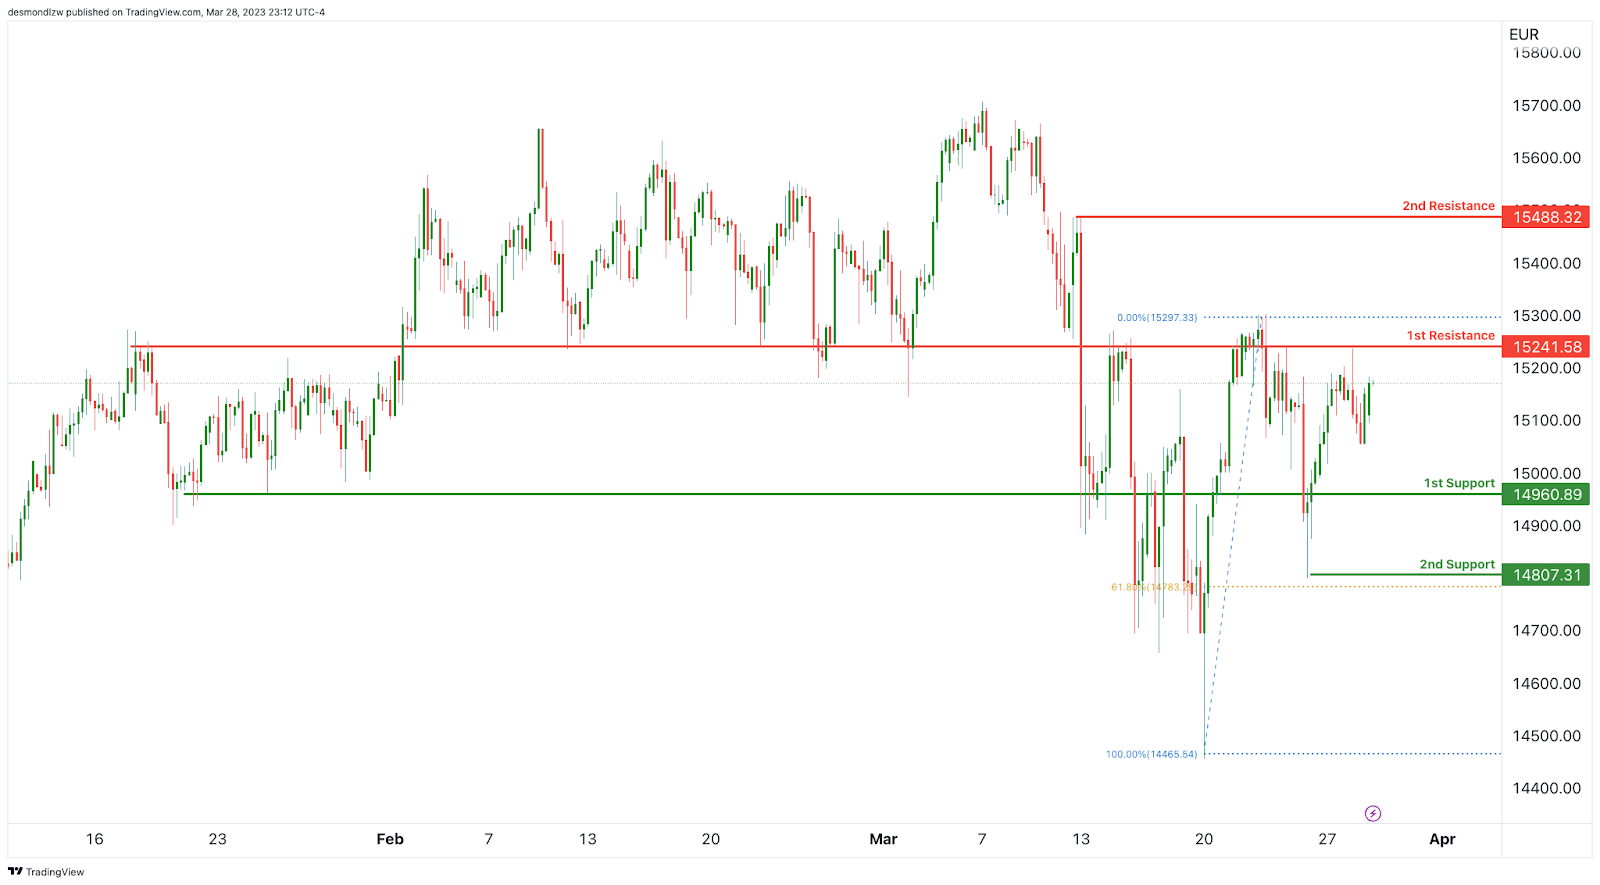
GER30:
Overall, the momentum of the GER30 chart is bullish, as price is currently above the bullish Ichimoku cloud. This suggests that there is good support in place, contributing to the bullish momentum.
Price could potentially make a bullish continuation towards the first resistance level. However, it’s important to note that the overall momentum of the chart is always subject to change.
The first support level is located at 14960.89, which is an overlap support level. If the price falls towards this level, it is likely to find support and bounce back up. The second support level is at 14807.31, which is another overlap support level and coincides with the 61.80% Fibonacci retracement level. This support level may also provide a good buying opportunity.
On the other hand, the first resistance level is at 15241.58, which is an overlap resistance level. If the price rises towards this level, it is likely to face some selling pressure. The second resistance level is at 15488.32, which is also an overlap resistance level. If the price manages to break above this level, it could signal a strong bullish momentum and potential buying opportunity.
In summary, the overall momentum of the GER30 chart is bullish, and the price could potentially make a bullish continuation towards the first resistance level. The first and second support levels are at 14960.89 and 14807.31, respectively, while the first and second resistance levels are at 15241.58 and 15488.32, respectively. These levels are important to keep an eye on for potential buying or selling opportunities.
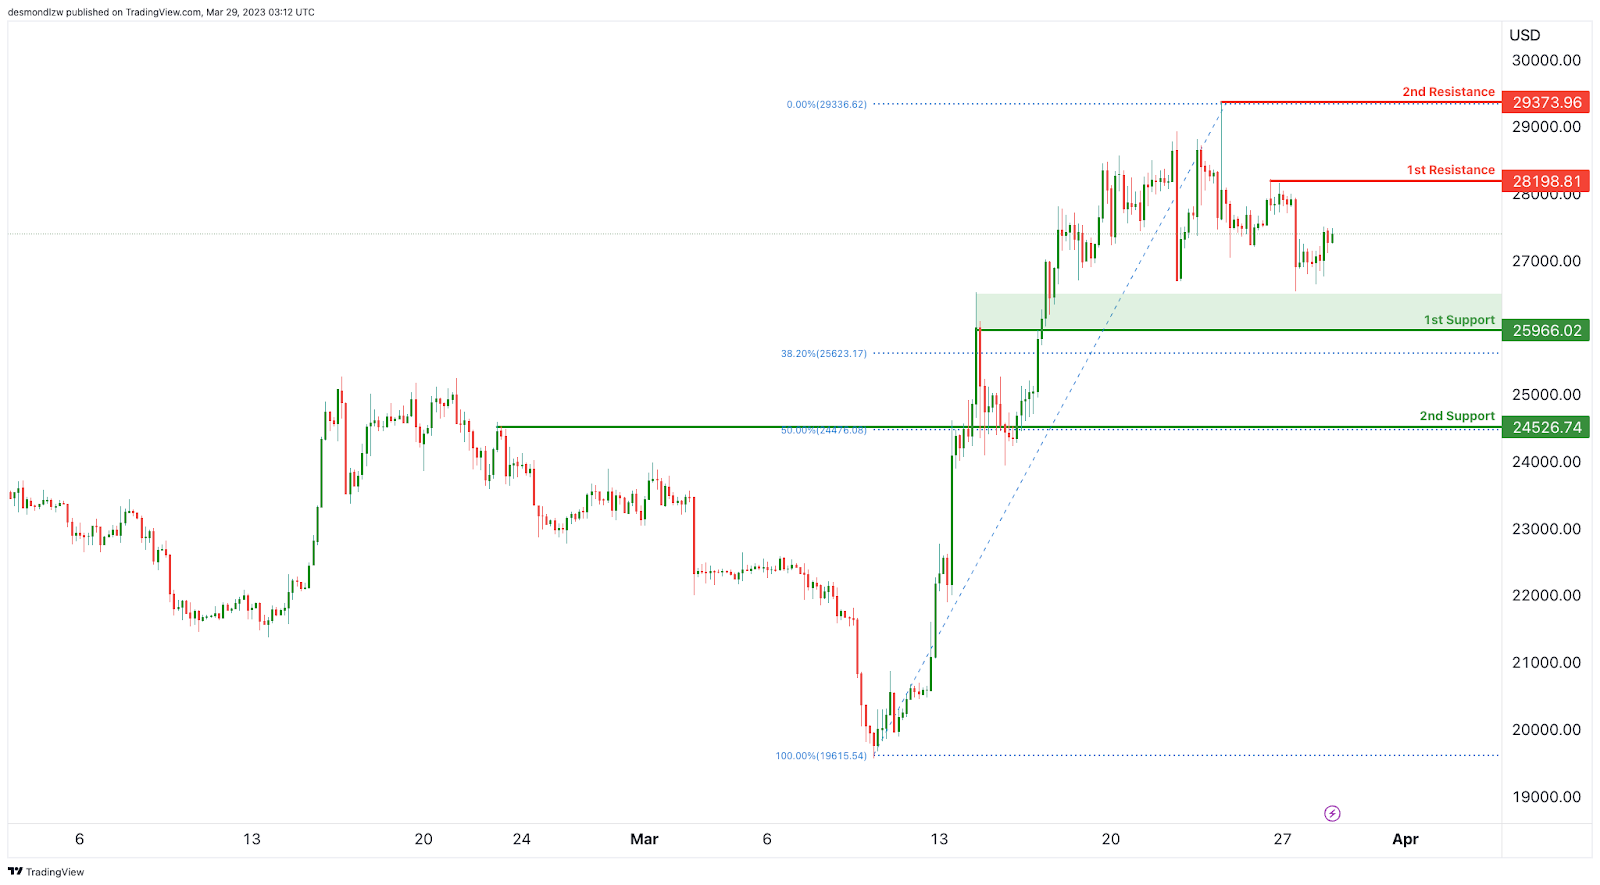
BTC/USD:
According to our analysis, BTCUSD could potentially make a bearish continuation towards the first support level at 25966.02. This support level is a significant area of interest as it coincides with the 38.20% Fibonacci retracement level, making it a strong support level. The second support level is at 24526.74 and is also an overlap support level and coincides with the 50% Fibonacci retracement level.
On the resistance side, the first resistance level is at 28198.81, which is also an overlap resistance level. The second resistance level is at 29373.96, which is a swing high resistance level.
It is worth noting that due to the high volatility in the cryptocurrency market, these support and resistance levels can quickly become invalid. Traders and investors should always use appropriate risk management strategies, such as stop-loss orders, when trading or investing in cryptocurrencies.
In conclusion, the BTCUSD chart’s overall momentum is bearish, and prices could potentially drop towards the first support level at 25966.02 or the second support level at 24526.74. Traders and investors should keep a close eye on price action and adjust their positions accordingly.
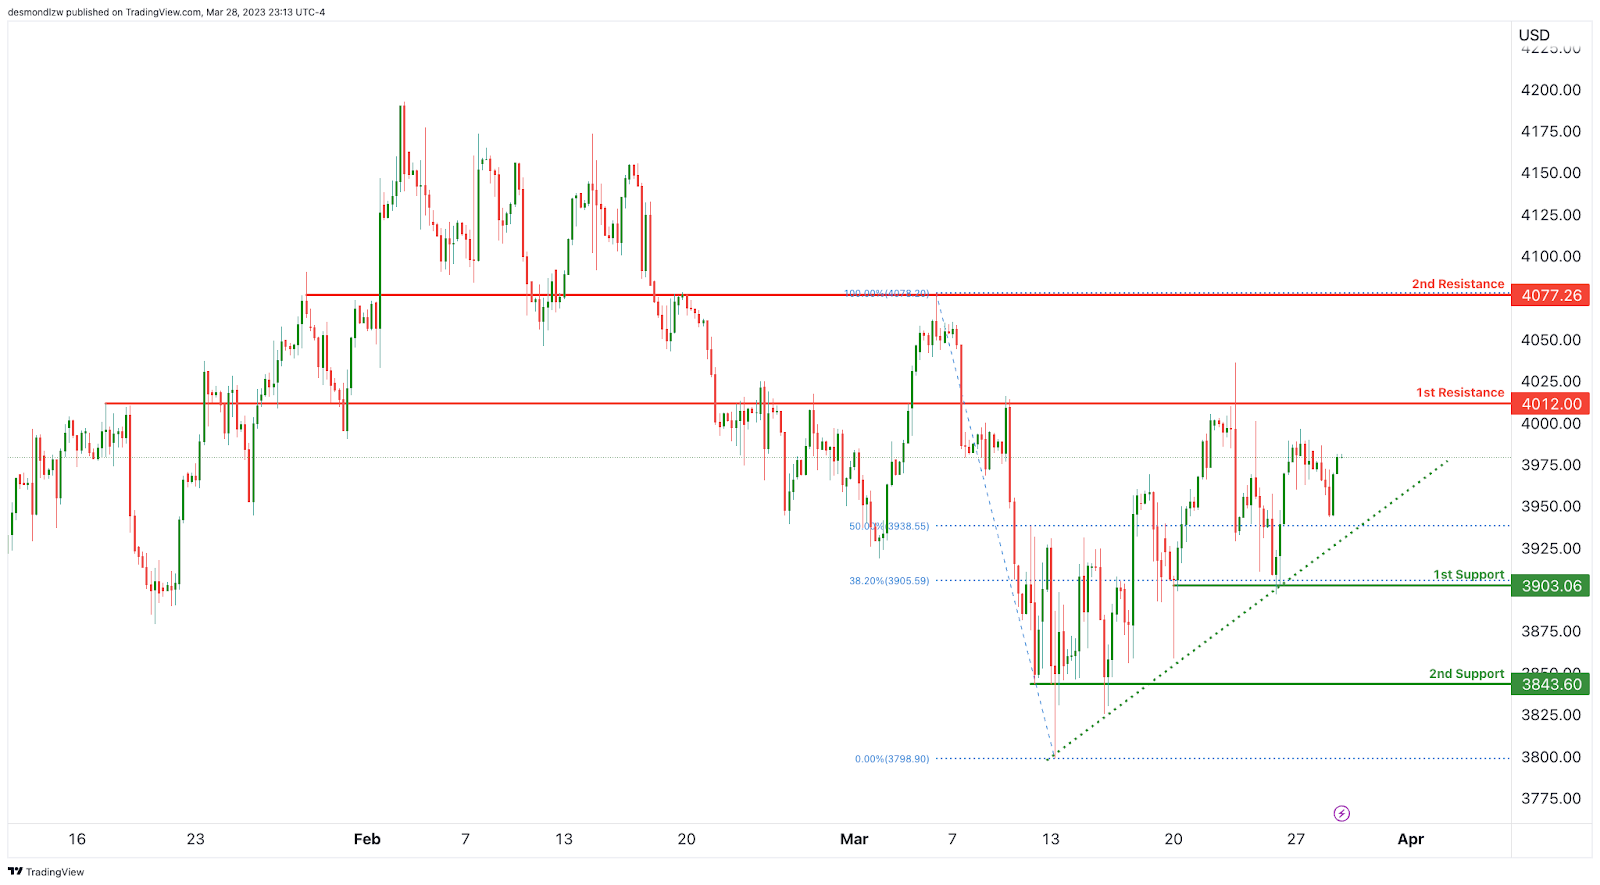
US500
The US500 index is showing bullish momentum overall, with price currently trading above the bullish Ichimoku cloud. This suggests that there is good support in place. In the short-term, price could potentially continue its bullish momentum towards the first resistance level.
The first support level is at 3903.06 and is a good level of support due to it being an overlap support and a 38.20% Fibonacci retracement. A break below this level could signal a shift in momentum to bearish.
The second support level is at 3843.60 and is also a good level of support due to it being an overlap support. If price were to drop to this level, it could potentially be a good buying opportunity for traders.
The first resistance level is at 4012.00 and is a good level of resistance due to it being an overlap resistance. A break above this level could signal further bullish momentum.
The second resistance level is at 4077.26 and is also a good level of resistance due to it being an overlap resistance. This level could potentially act as a strong barrier for price to break through.
Overall, traders should keep an eye on the support and resistance levels mentioned above, as they could play important roles in determining the short-term direction of the US500 index.
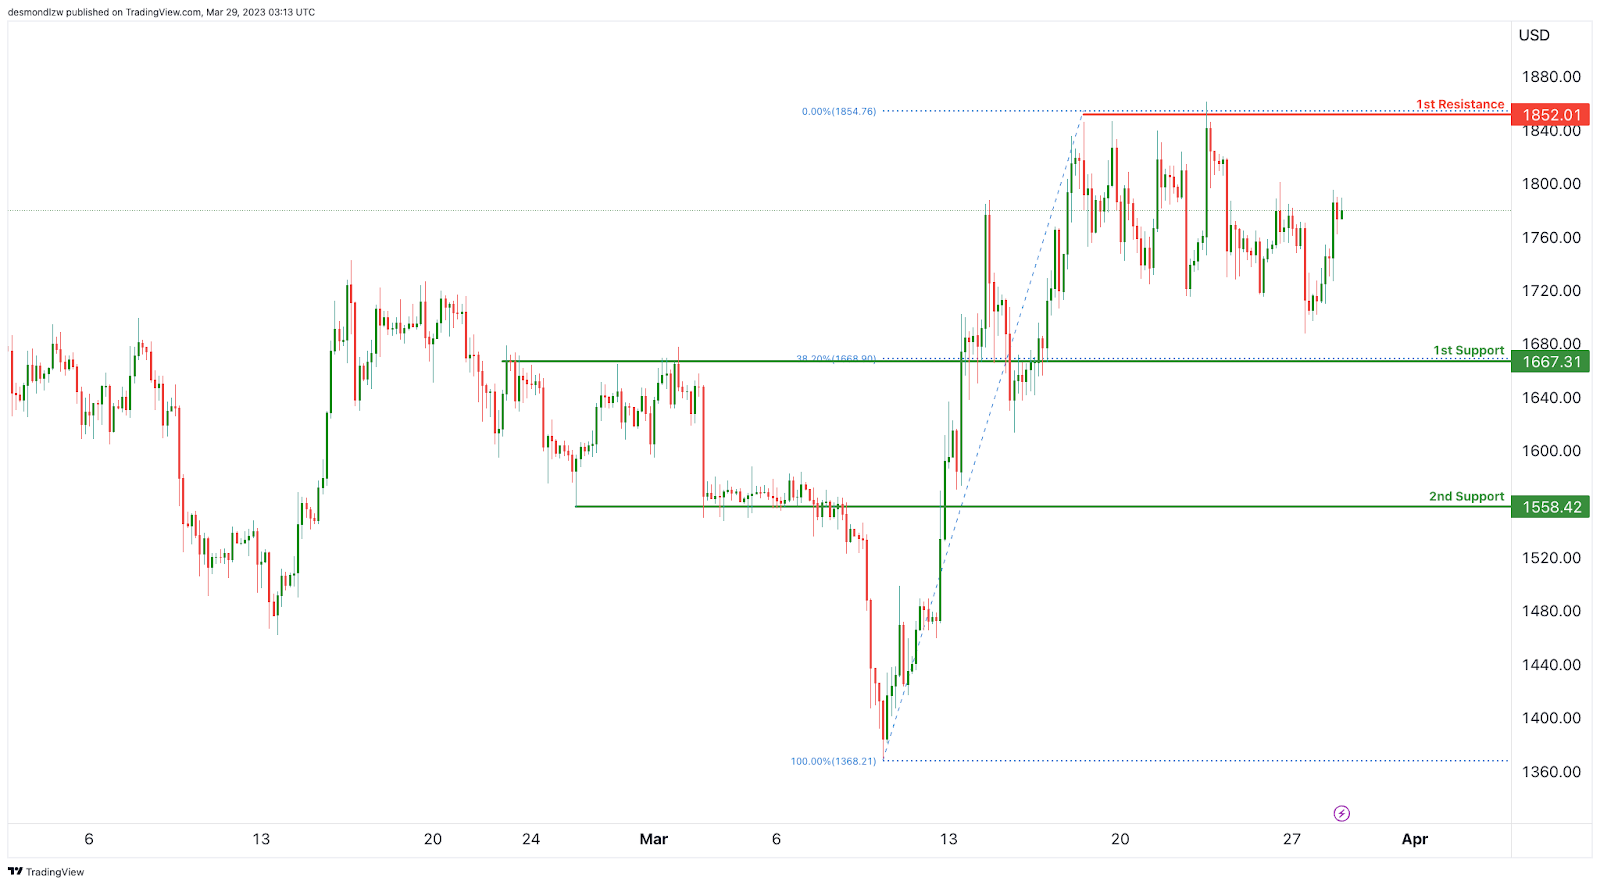
ETH/USD:
As the overall momentum of the chart for ETHUSD is bullish, with price being above the bullish Ichimoku cloud, we could potentially see a bullish continuation towards the first resistance level.
The first support level is at 1667.31, which is a strong level of support as it coincides with the 38.20% Fibonacci retracement level. The second support level is at 1558.42, which is also an overlap support level.
On the other hand, the first resistance level is at 1852.01, which is a strong level of resistance as it is an overlap resistance level. Therefore, if price manages to break through this resistance level, we may see further bullish momentum towards higher price levels.
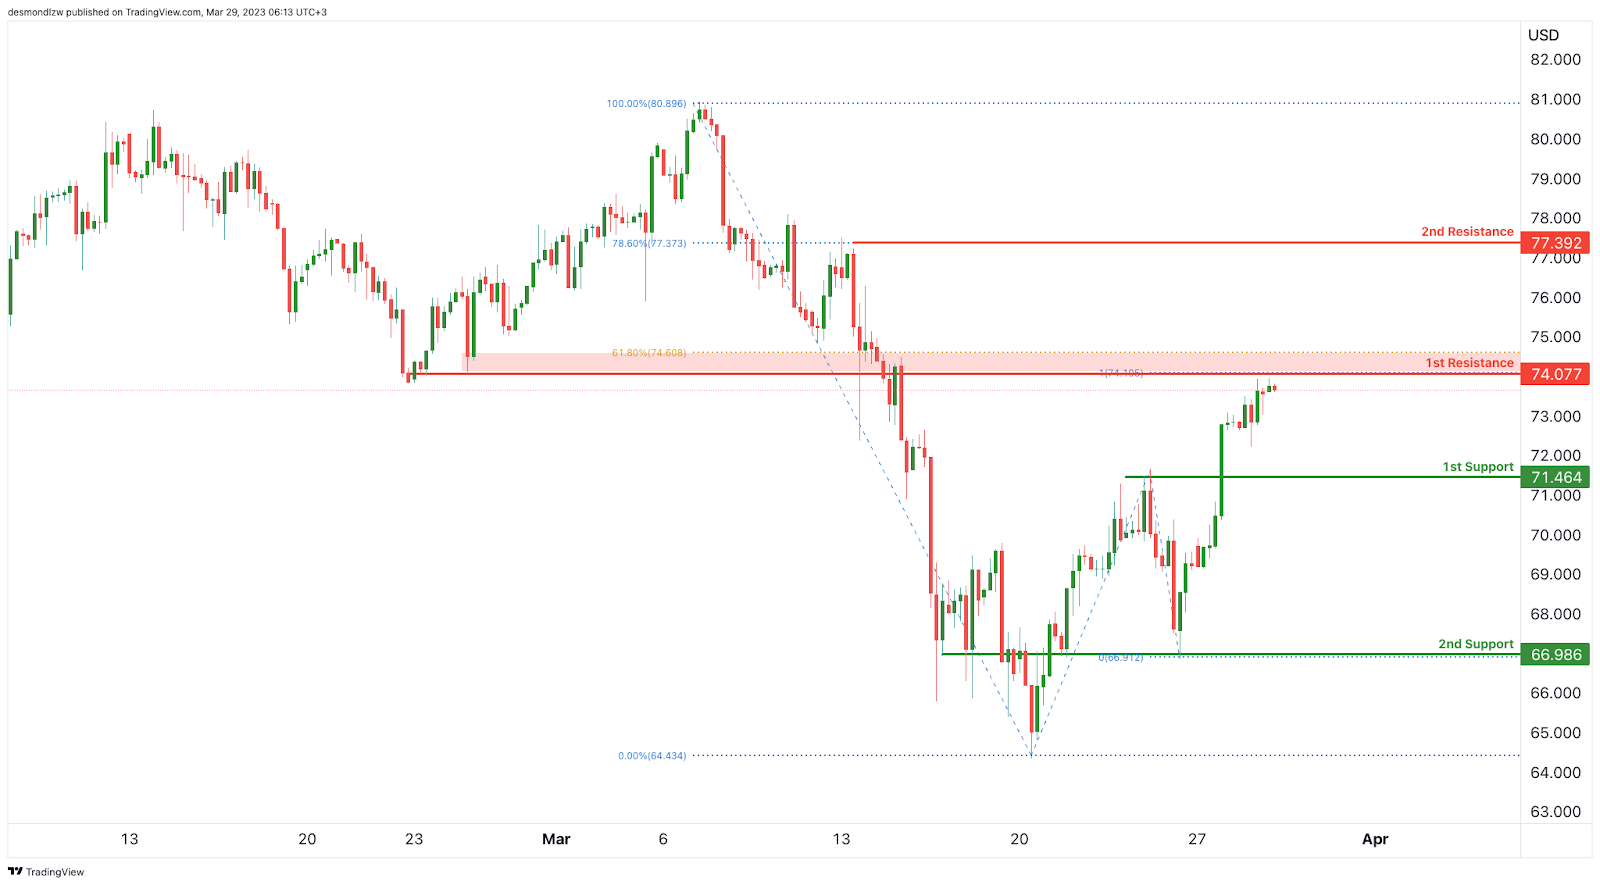
WTI/USD:
WTI crude oil has been in a weak bullish trend, with low confidence. However, in the short term, price could potentially make a bearish reaction off the first resistance level, dropping towards the first support. The first support is located at 71.464, which is an overlap support.
If the price breaks below this level, it could continue to fall towards the second support level, located at 66.986, which is also an overlap support level.
On the other hand, if price manages to break above the first resistance level, located at 74.077, which is an overlap resistance and the 61.80% Fibonacci retracement level, it could potentially reach the second resistance level at 77.392, which is another overlap resistance level.
Overall, the current market conditions suggest that traders should be cautious and keep an eye on the key support and resistance levels mentioned above. The weak bearish momentum indicates that there may be a potential for a bearish reaction at resistance, but traders should wait for confirmation before entering any trades.
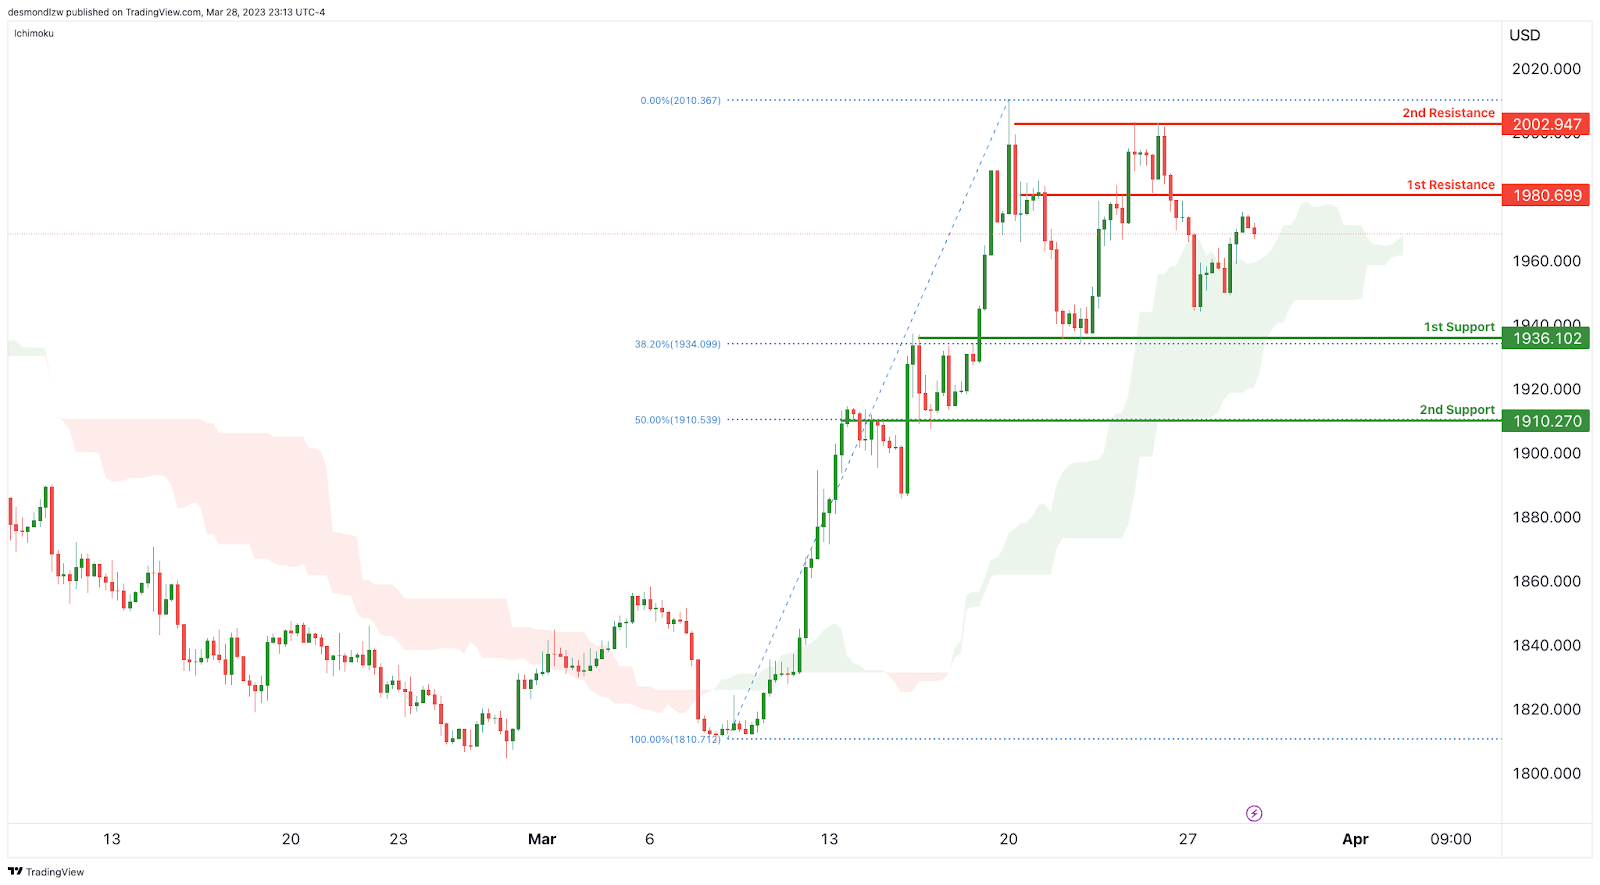
XAU/USD (GOLD):
Gold prices have been exhibiting bullish momentum, supported by the fact that price is currently above the bullish Ichimoku cloud. In the near term, prices could potentially continue to rise towards the first resistance level.
The first support level is at 1936.102, which is an overlap support and a 38.20% Fibonacci retracement level. A breach below this level could lead to a further decline towards the second support level at 1910.270, which is also an overlap support and a 50% Fibonacci retracement level.
On the upside, the first resistance level is at 1980.699, which is an overlap resistance. A break above this level could lead to a further rise towards the second resistance level at 2002.947, which is also an overlap resistance.
Traders should keep an eye on price movements near these key levels to determine potential trading opportunities. A break above the resistance levels could signal a continuation of the bullish trend, while a break below the support levels could signal a reversal towards a bearish trend.
The accuracy, completeness and timeliness of the information contained on this site cannot be guaranteed. IC Markets does not warranty, guarantee or make any representations, or assume any liability regarding financial results based on the use of the information in the site.
News, views, opinions, recommendations and other information obtained from sources outside of www.icmarkets.com, used in this site are believed to be reliable, but we cannot guarantee their accuracy or completeness. All such information is subject to change at any time without notice. IC Markets assumes no responsibility for the content of any linked site.
The fact that such links may exist does not indicate approval or endorsement of any material contained on any linked site. IC Markets is not liable for any harm caused by the transmission, through accessing the services or information on this site, of a computer virus, or other computer code or programming device that might be used to access, delete, damage, disable, disrupt or otherwise impede in any manner, the operation of the site or of any user’s software, hardware, data or property.


