
Key risk events today:
Australia inflation q/q; US Pending Home Sales m/m; Crude Oil Inventories; FOMC Statement, Federal Funds Rate and Press Conference.
(Previous analysis as well as outside sources – italics).
EUR/USD:
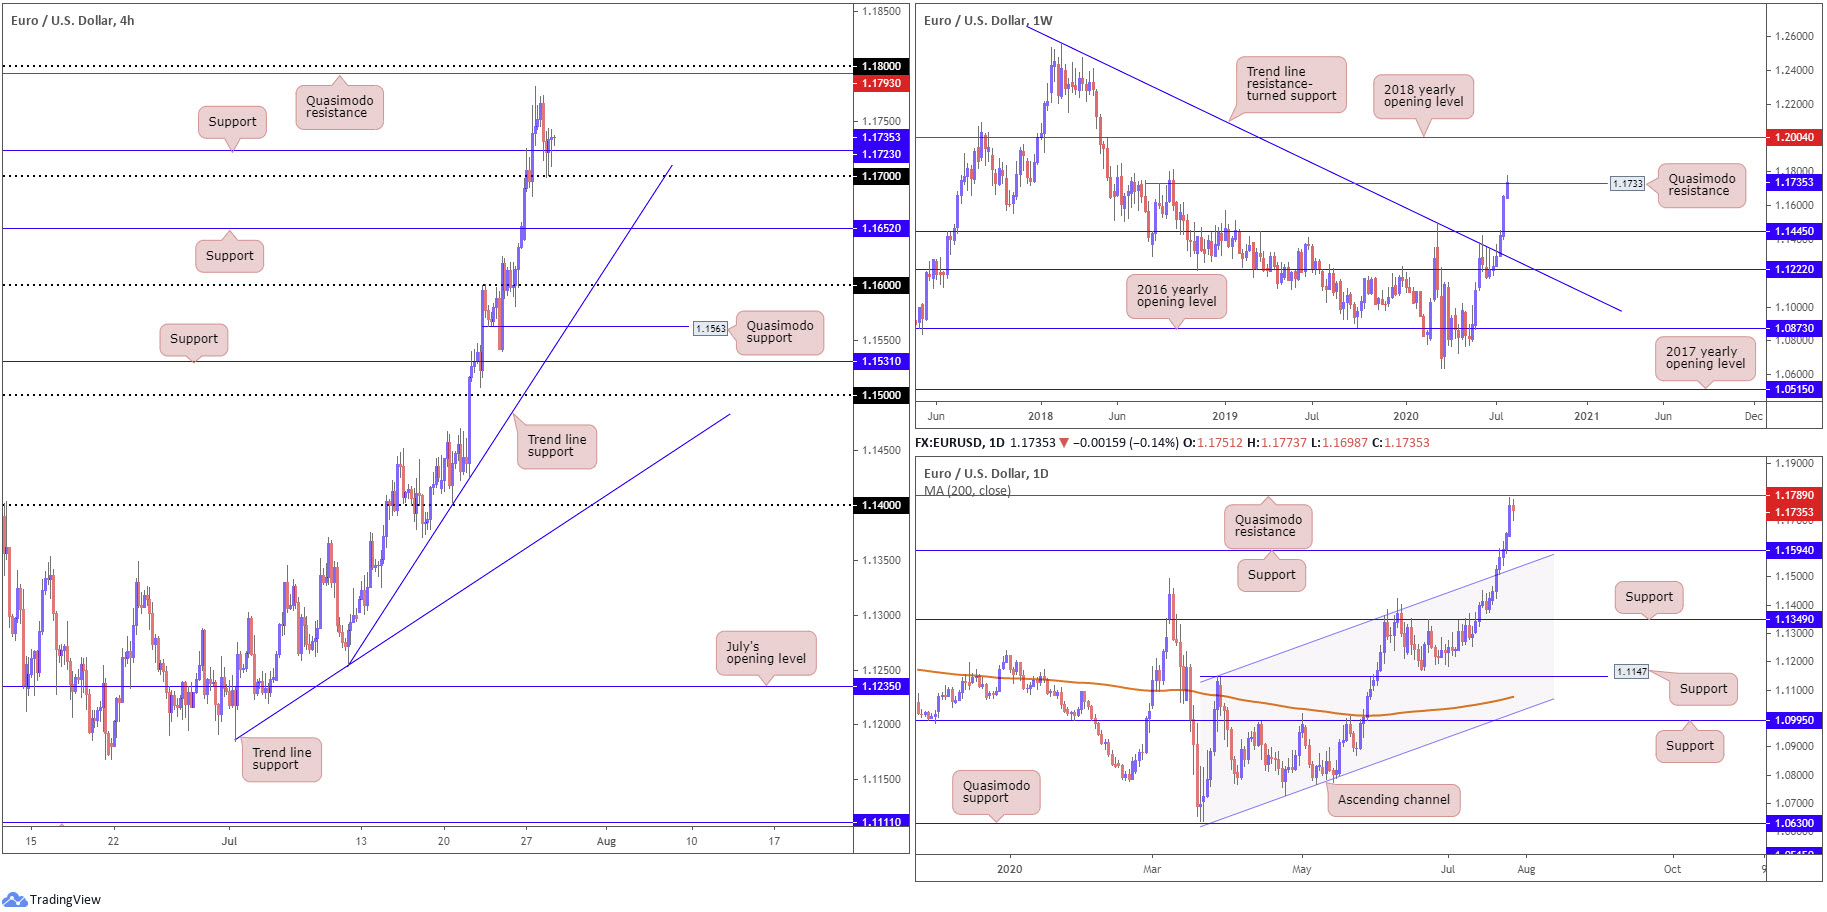
Europe’s single currency faded 22-month highs against the buck at 1.1781 Tuesday, as the US dollar index attempted to reclaim the 94.00 handle.
The recent EUR/USD pullback delivered a whipsaw through H4 support at 1.1723 into the hands of 1.17. This was, in fact, a noted possibility in Tuesday’s technical briefing (italics):
This leaves trade free on the H4 timeframe to perhaps retest support at 1.1723 and make a run for Quasimodo resistance at 1.1793/1.18 handle. However, traders are urged to pencil in the possibility of a fakeout through 1.1723 to 1.17 before buyers perhaps make an appearance.
Further out, longer-term activity on the weekly timeframe recently shook hands with Quasimodo resistance at 1.1733. A breach here shifts focus to the 2018 yearly opening level as far north as 1.2004, while a rejection could send things back to the 2019 yearly opening level at 1.1445. The story on the daily timeframe, nonetheless, reveals price snapped a seven-day bullish phase yesterday ahead of Quasimodo resistance at 1.1789. Continued depreciation here could turn things towards support at 1.1594.
Areas of consideration:
The break of weekly trend line resistance (July 13), taken from the high 1.2555, and violation of the 1.1495 March 9 high, reflects a long-term (potential) technical trend change. The retreat to H4 support at 1.1723/1.17 handle, therefore, could attract dip-buying today.
The flip side, of course, has weekly price toying with weekly Quasimodo resistance at 1.1733 and daily price closing in on Quasimodo resistance from 1.1789. As you can imagine, this may deter buying, threatening a 1.17 breach to H4 support at 1.1652.
GBP/USD:
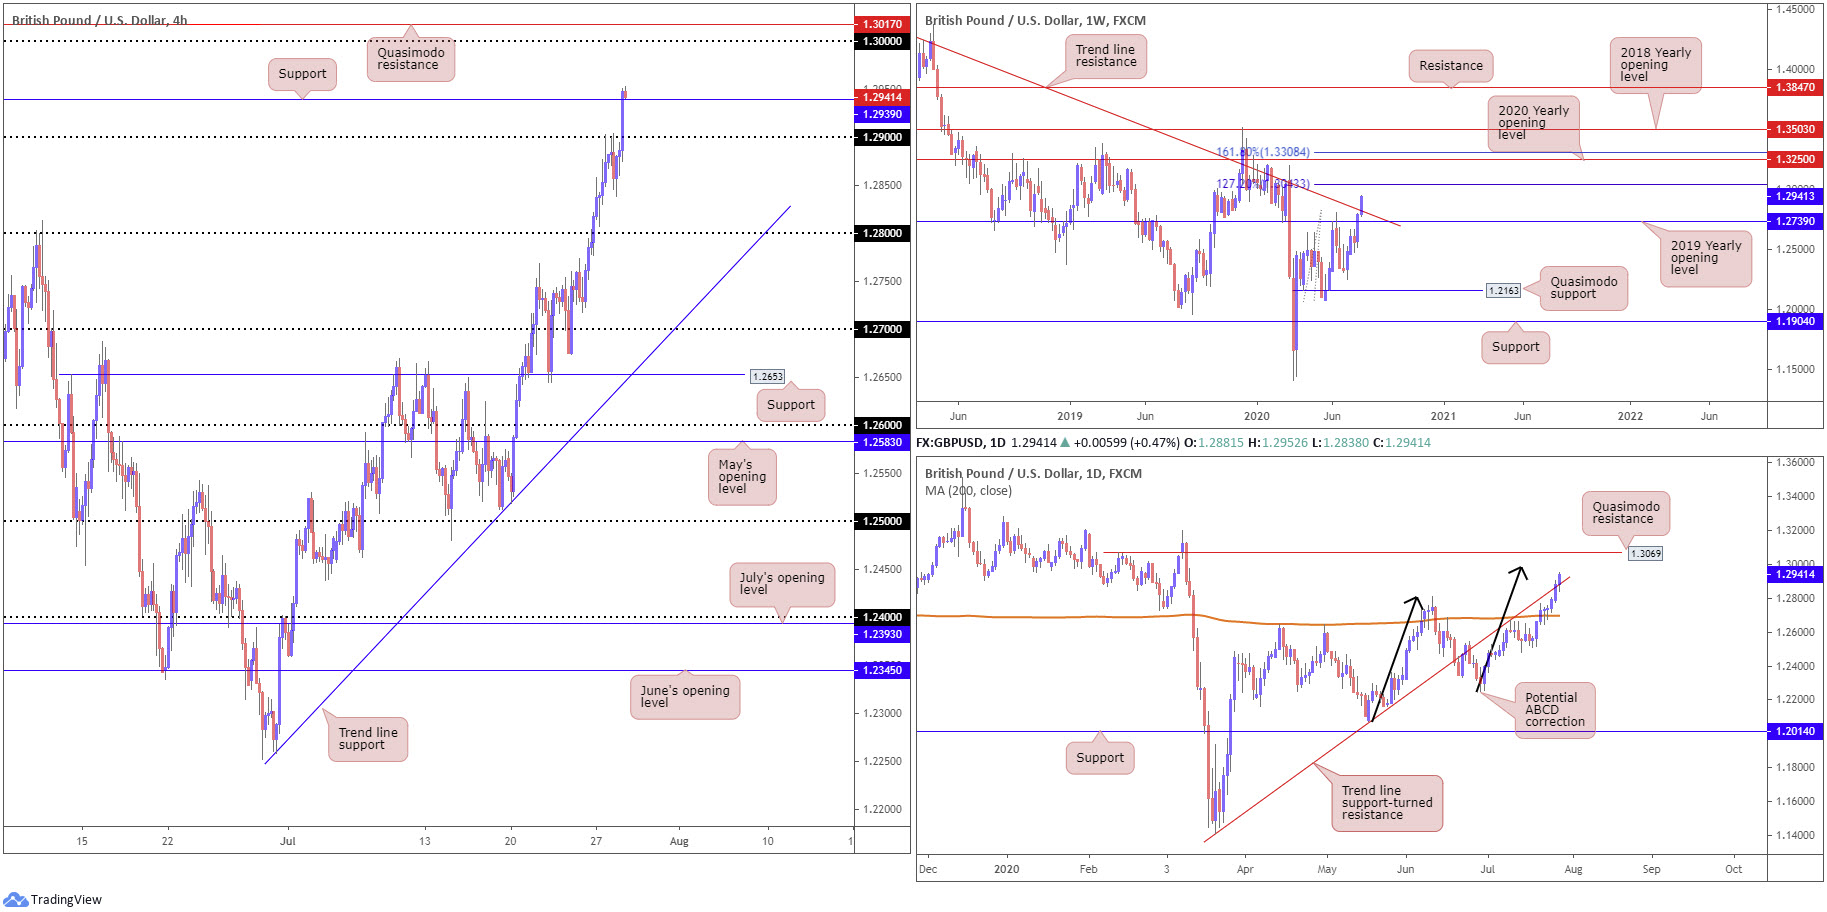
Tuesday had sterling conquer 1.29 to the upside as the US dollar index found soft grip above the 94.00 handle. On top of 1.29, H4 buyers also recently brushed aside resistance coming in at 1.2939, potentially setting the stage towards the key figure 1.30 and Quasimodo resistance at 1.3017.
Weekly flow is seen overthrowing long-term trend line resistance, extended from the high 1.5930, consequently exposing the 127.2% Fibonacci extension point at 1.3043 as the next possible upside hurdle. This comes after a decisive breach of the 2019 yearly opening level at 1.2739 last week.
Readers will also want to acknowledge daily movement crossed through trend line support-turned resistance yesterday, taken from the low 1.1409. This will have some traders looking for ABCD (black arrows) completion around 1.2982ish, plotted south of Quasimodo resistance at 1.3069.
Areas of consideration:
The recent trend line resistance break on the weekly timeframe, along with daily price also taking on trend line support-turned resistance, extended from the low 1.1409, may have H4 buyers secure newly formed support at 1.2939. A retest from the latter today could guide the currency pair to the daily ABCD completion around 1.2982, followed by 1.30 on the H4 and Quasimodo resistance at 1.3017.
AUD/USD:
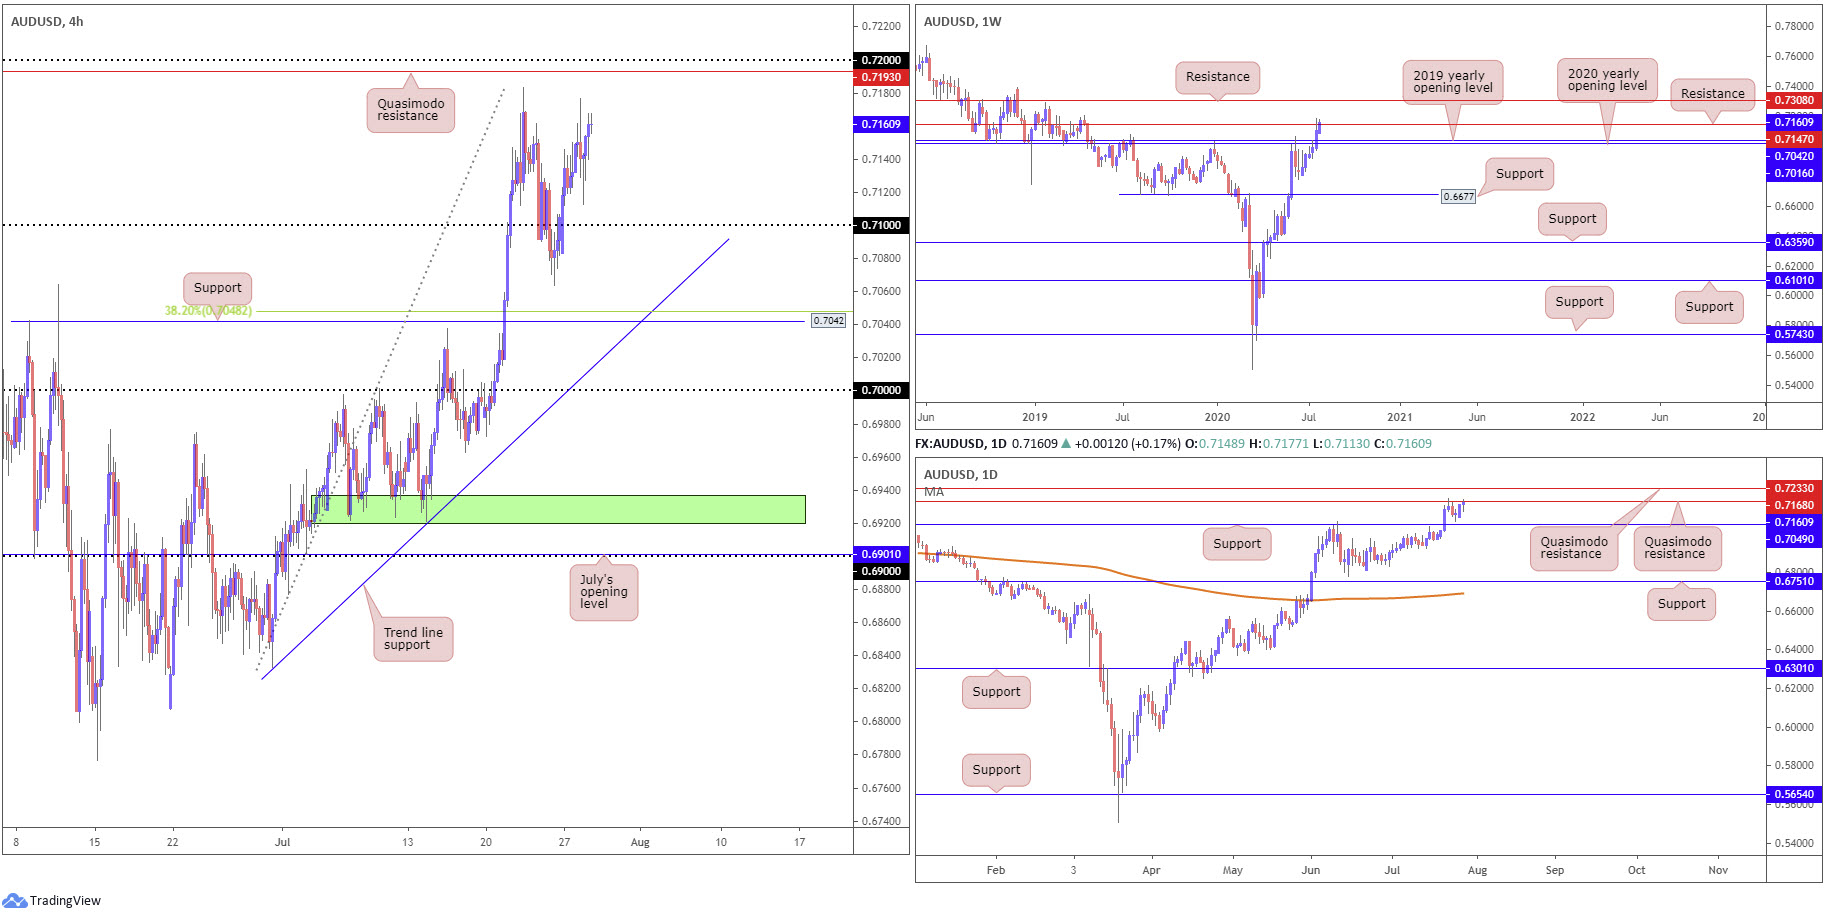
The Australian dollar nudged a shade higher against the US dollar Tuesday, pencilling in a range between 0.7177/0.7113. Structurally on the H4 timeframe, though, the 0.71 handle rests as nearby support, while last Wednesday’s peak at 0.7183 may form resistance, closely followed by Quasimodo resistance parked at 0.7193 and the 0.72 handle. Aside from the immediate trend pointing northbound, we don’t really have much more to work with on the H4 chart.
Against the backdrop of intraday movement, price action on the weekly timeframe is striving to overcome resistance at 0.7147. Further buying could eventually have longer-term action knock on the door of another layer of resistance taken from 0.7308.
Yet, with respect to the daily timeframe we are seeing Quasimodo resistance at 0.7168 make an appearance. Given last Wednesday’s performance off the base, sellers appear almost unresponsive. Elbowing above the current Quasimodo resistance, therefore, shines the spotlight on a possible run to Quasimodo resistance coming in at 0.7233.
Areas of consideration:
Buyers, according to chart studies, appear to have the upper hand right now, in line with the immediate trend. To take advantage of any upside, traders could approach the recently breached weekly resistance at 0.7147 as a viable support. Failing this, drilling down to the lower timeframes to secure an entry is an alternative, as the next available support on the H4 resides at 0.71.
Interestingly, north of 0.72, buyers have room to manoeuvre on the weekly timeframe to 0.7308, though appears hindered on the daily timeframe at resistance from 0.7233.
USD/JPY:
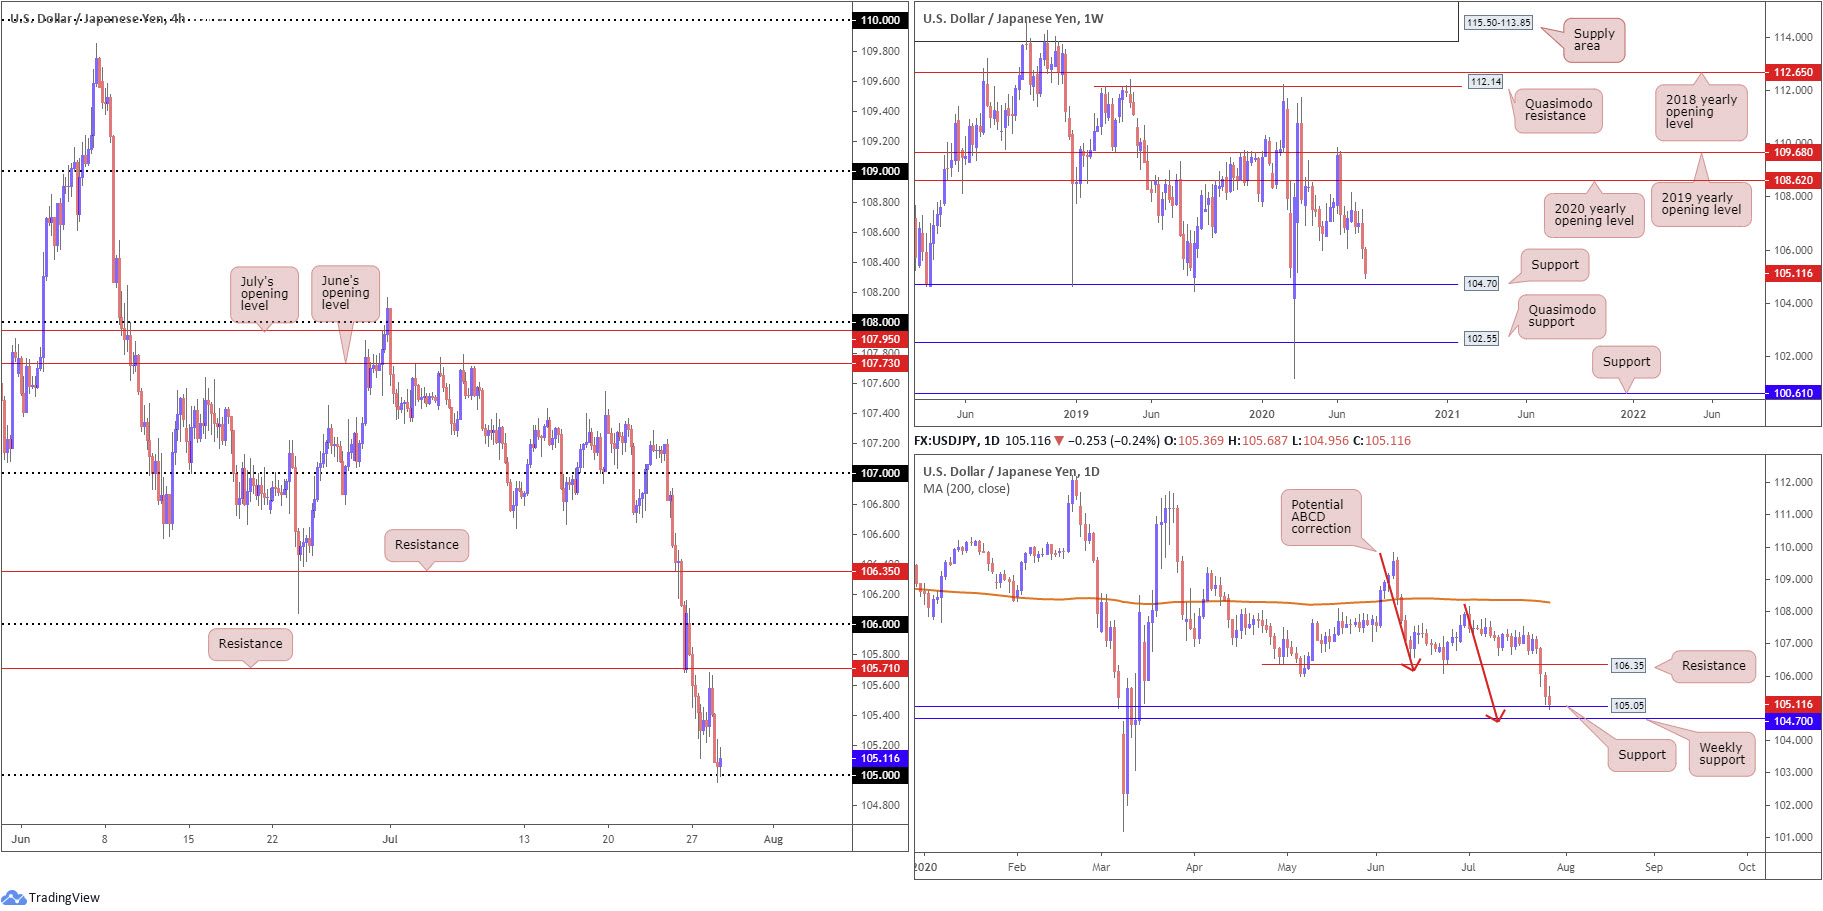
USD/JPY dipped a fourth successive session Tuesday, weighed by the US dollar index losing grip north of the 94.00 handle. Earlier, we had bulls clear a path to H4 resistance coming in at 105.71 on USD/JPY, though the pair failed to draw in the base before navigating lower terrain.
For those who read Tuesday’s technical briefing you may recall the following (italics):
Going forward, technicians are likely watching for a recovery attempt to form between 104.70/105.05, the weekly support at 104.70, daily support at 105.05 and the 105 handle on the H4. Should a retest at H4 resistance from 105.71 take shape before connecting with the aforementioned support zone, this may encourage sellers into the fight.
As briefly touched on above, we missed 105.71 by three pips before transitioning lower and shaking hands with daily support at 105.05 and the 105 handle, which, as underlined in Tuesday’s technical piece, has support positioned close by on the weekly timeframe at 104.70.
Areas of consideration:
With 104.70/105.05 support (weekly support at 104.70, daily support at 105.05 and the 105 handle on the H4) recently entering the frame, this may encourage buyers off 105 today. Conservative traders, threatened by a dip to weekly support, however, may opt to wait and see if H4 chalks up a bullish candlestick configuration before pulling the trigger, targeting 105.71 H4 resistance as an initial base.
USD/CAD:
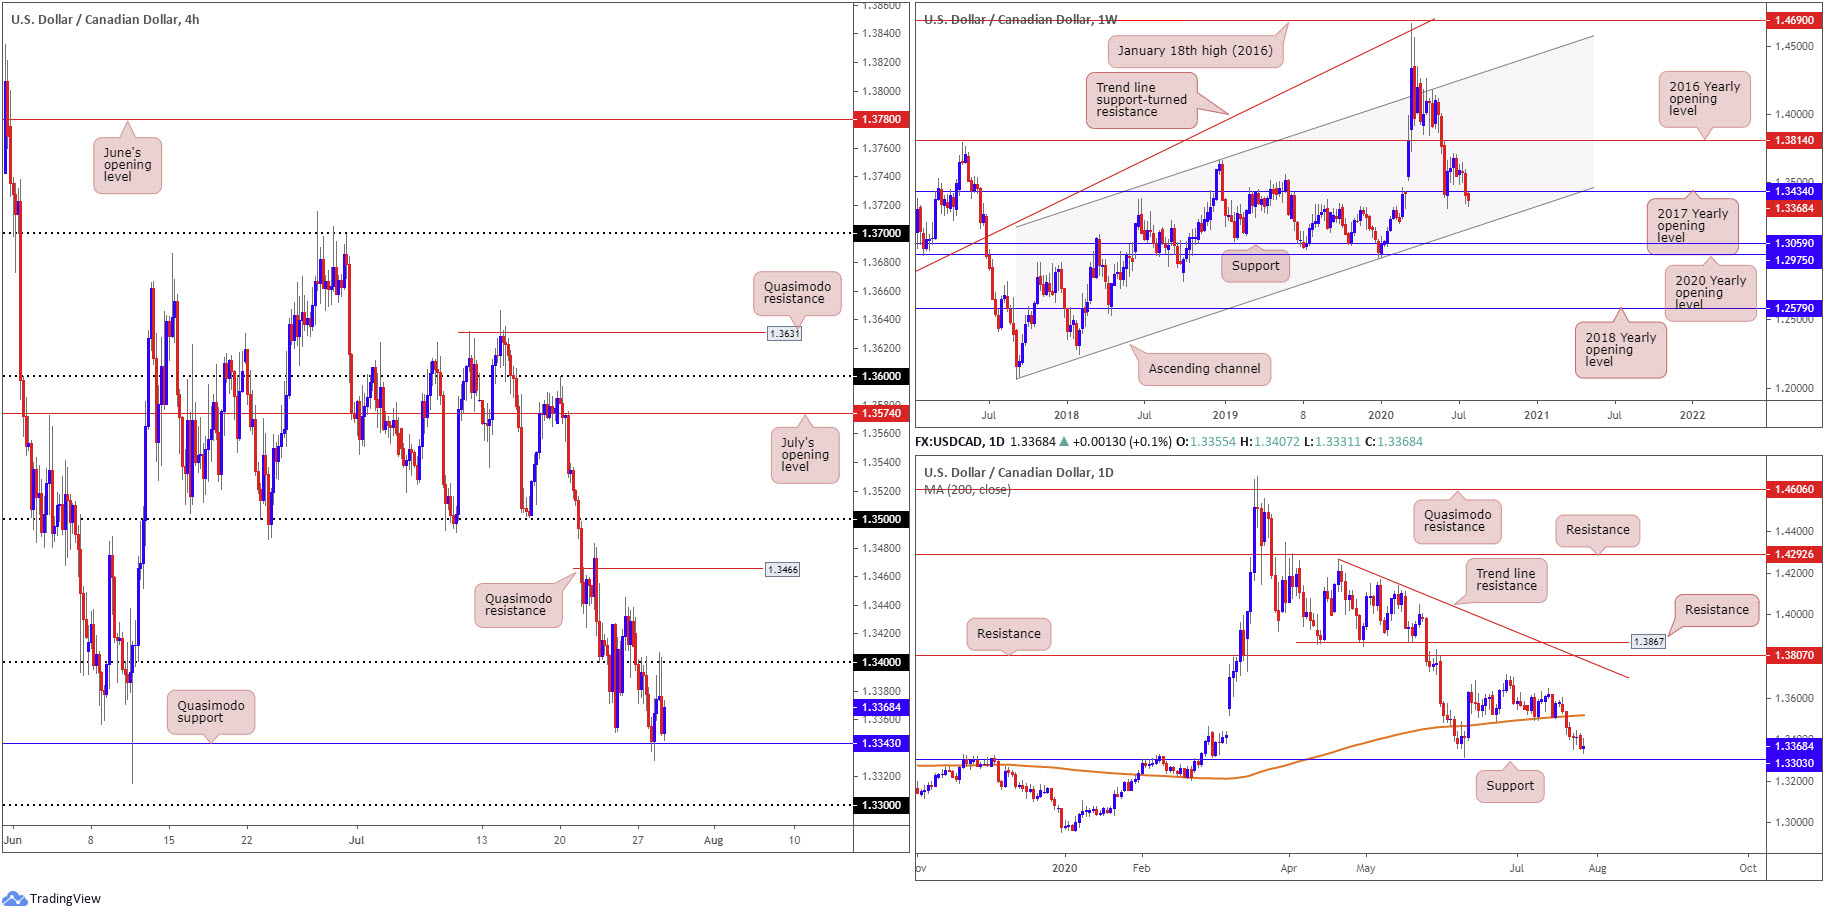
USD/CAD, as you can see, remained depressed under 1.34 on the H4 scale Tuesday, though at the same time the candles are also seen establishing a base off Quasimodo support at 1.3343. Traders will also acknowledge south of 1.3343 we’ll have candles possibly drive towards 1.33.
WTI dipped south of $41.00/bbl in recent activity, while the US dollar index remained capped under 94.00.
Multi-timeframe analysis reveals structural action on the daily timeframe has support positioned at 1.3303, bringing forward an interesting history as support/resistance since early 2016.
Support, by way of the 2017 yearly opening level, from 1.3434 on the weekly timeframe exhibits strong signs of breakability. Below 1.3434, channel support, taken from the low 1.2061, can be viewed as the next potential floor. A USD/CAD bid, nevertheless, carries light to the 2016 yearly opening level at 1.3814 as resistance, with follow-through buying to try and tackle a dense block of supply between 1.4190/1.3912.
Areas of consideration:
Exploring territory beneath 1.3434 on the weekly timeframe reflects a bearish tone in this market. Against the backdrop of higher timeframe movement, a bullish reaction from daily support at 1.3303 could still be in the offing, joined with the 1.33 handle on the H4.
On the basis we were unable to get things above 1.34 off H4 Quasimodo support at 1.3343 yesterday, a break of the latter could be seen today, which may have intraday sellers take advantage of the space between the 1.3343 and 1.33.
USD/CHF:
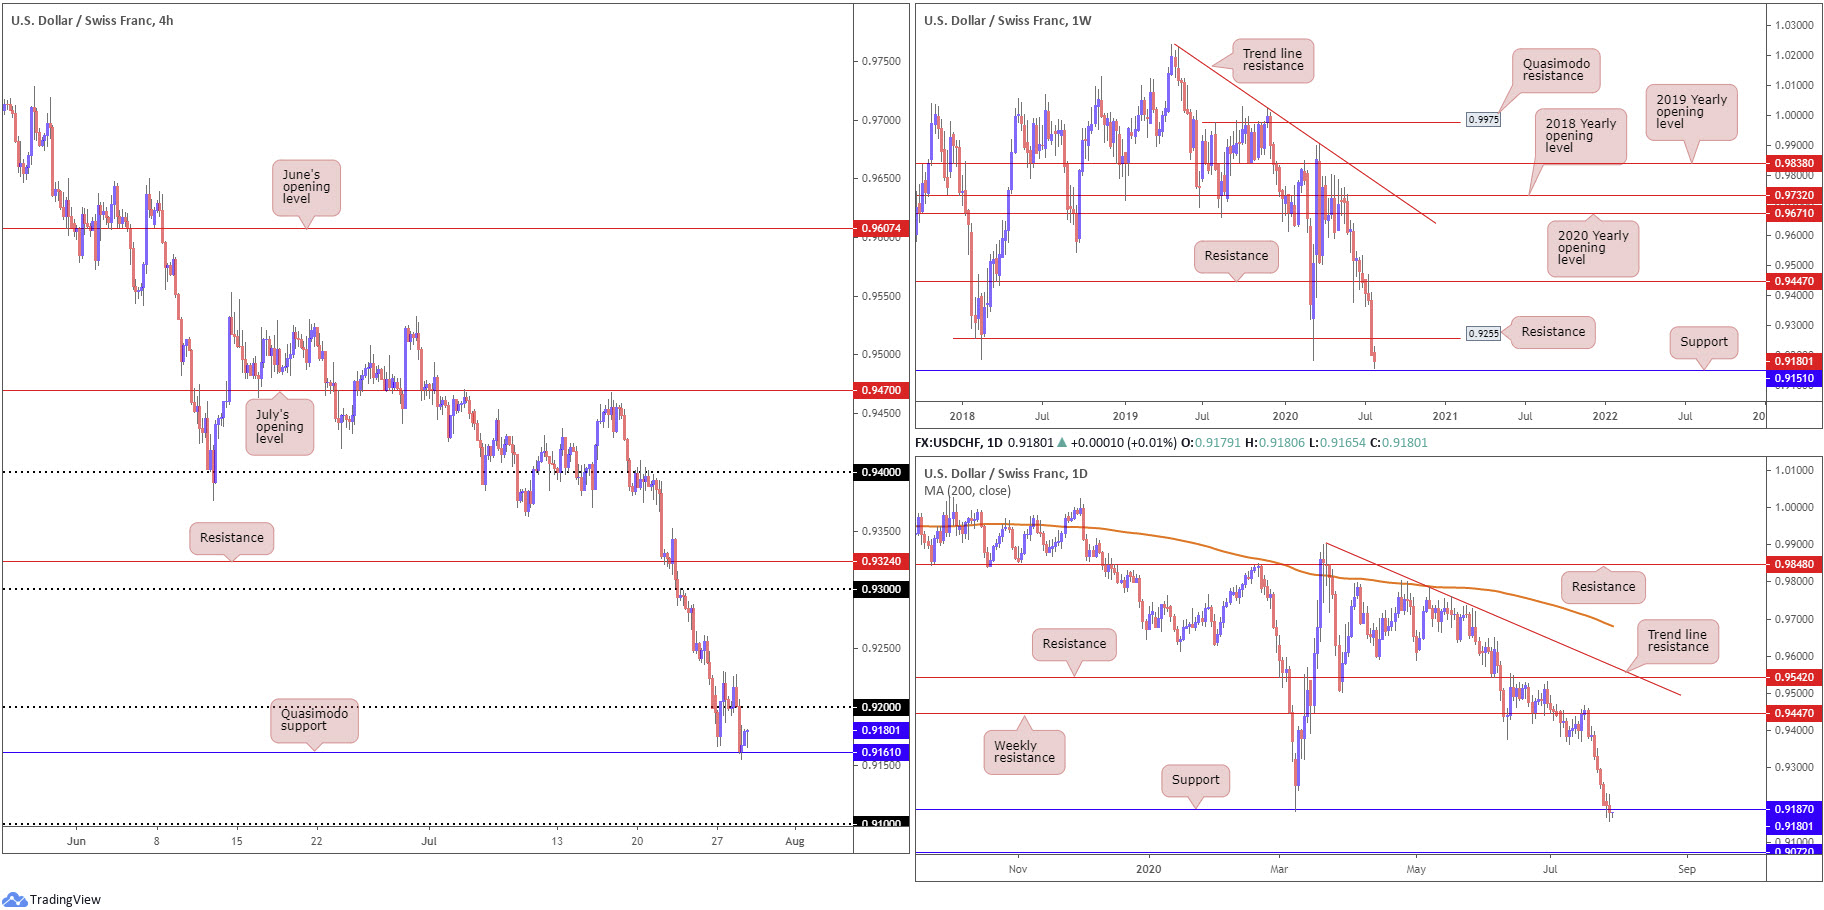
The US dollar failed to uphold position north of the 0.92 handle against the Swiss franc Tuesday, passionately dipping through 0.92 into London trade and colliding with H4 Quasimodo support at 0.9161 heading into US movement, which held into the closing bell. The 0.91 handle serves as the next downside target should a break of 0.9161 take shape.
The technical landscape on the weekly timeframe recently had price tunnel through Quasimodo support at 0.9255, which after taking 0.9187 (the low to the Quasimodo formation), became resistance. On top of this, support at 0.9151 is now firmly in the firing range. Interestingly, daily price modestly engulfed support at 0.9187 yesterday, drawing light to a possible approach to support coming in at 0.9027.
Areas of consideration:
H4 Quasimodo support at 0.9161, weekly support at 0.9151 and the daily support (albeit marginally breached yesterday) at 0.9187 is an interesting, and particularly formidable gathering of supports. This, therefore, is potentially an area active buyers may attempt to chalk up a recovery.
Dow Jones Industrial Average:
The Dow Jones Industrial Average shed 205.49 points, or 0.77%; the S&P 500 dropped 20.97 points, or 0.65%, and the tech-heavy Nasdaq 100 concluded lower by 141.87 points, or 1.33%.
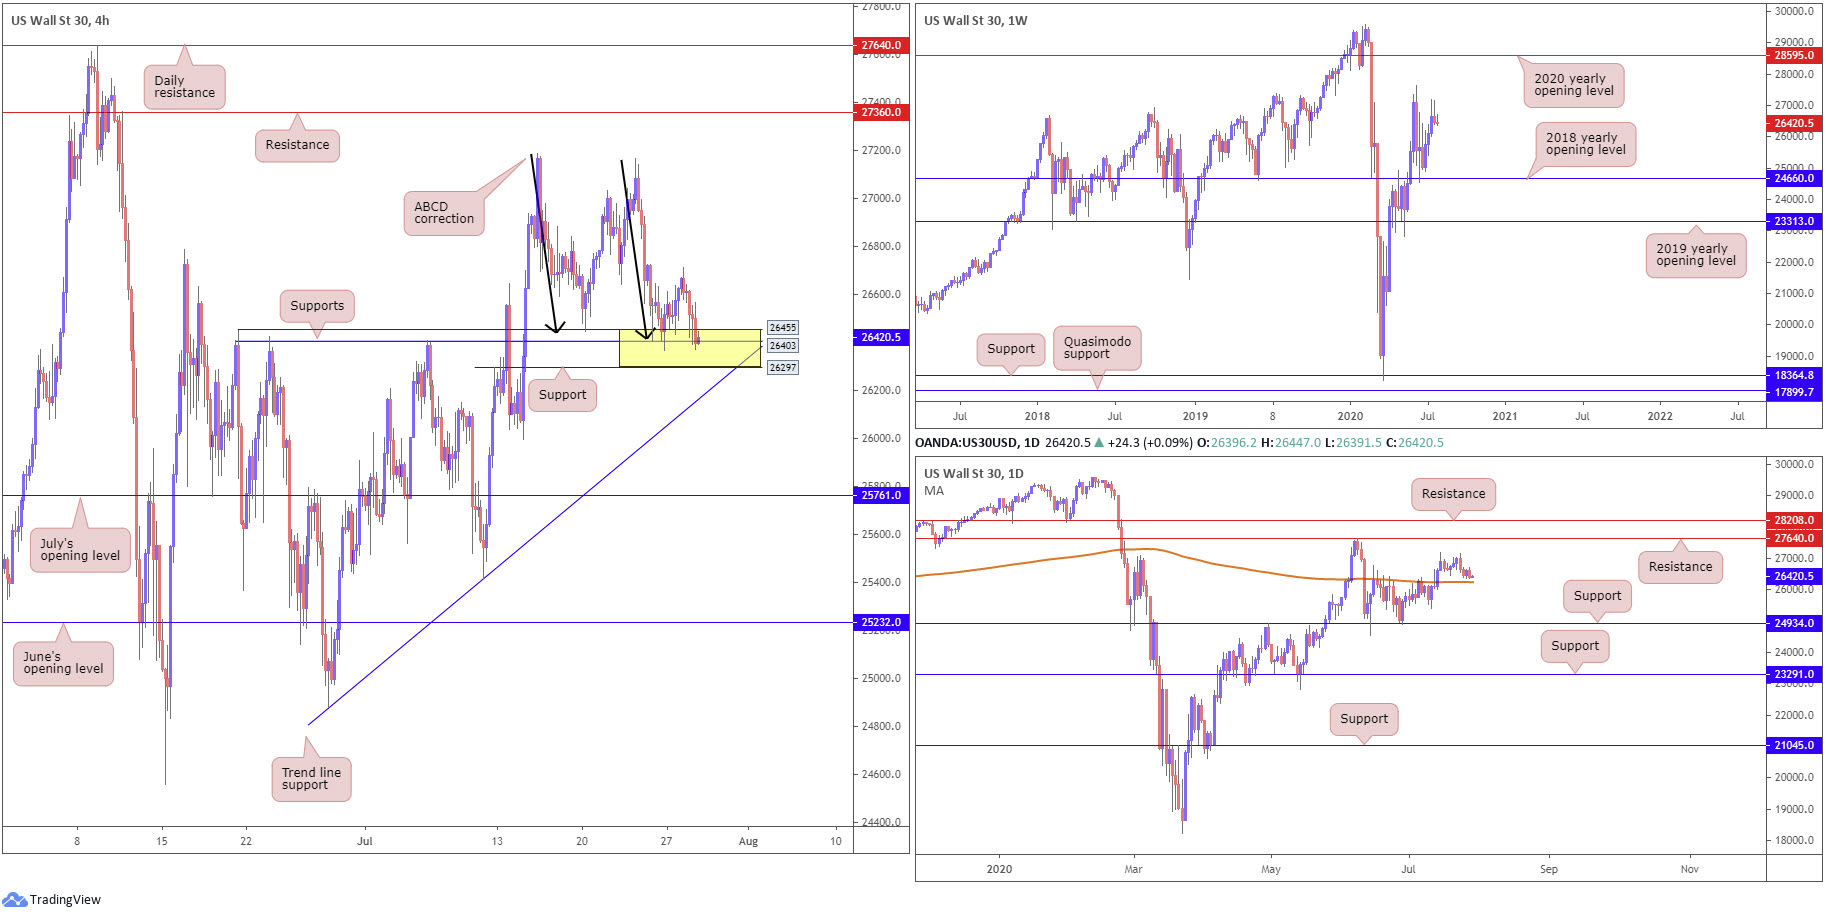
As can be seen from the H4 timeframe, the candles initially attempted to establish a bottom out of 26297/26455, joined with a H4 ABCD bullish correction (black arrows) at 26417. Things turned sour Tuesday, nonetheless, after fading 26712 in early movement, hauling the candles back into the walls of 26297/26455.
The 2018 yearly opening level at 24660 remains intact on the weekly timeframe and is an important base of support to keep eyes on. Traders are likely to eventually pull in the 27638 high, despite last week’s modest pullback snapping a three-week bullish phase, followed by a possible run to the 2020 yearly opening level at 28595.
Since climbing above the 200-day SMA (orange – 26246) on July 14, daily price has been trying to gain a toehold and approach resistance at 27640. As you can see, though, enthusiasm waned, with the candles poised to retest the SMA as support today.
Areas of consideration:
26297/26455 sends across a fragile vibe this morning, threatening the possibility of a breach to the 200-day SMA and H4 trend line support, taken from the low 24881.
Buyers will still likely keep a close eye on 26297/26455 for buying pressure today; a break of the area, however, will see buyers shift focus to H4 trend line support and 200-day SMA combination.
XAU/USD (GOLD):
Uncertainty caused by the COVID-19 pandemic and soft US dollar kept the yellow metal on the winning side of the table Tuesday (+0.85%).
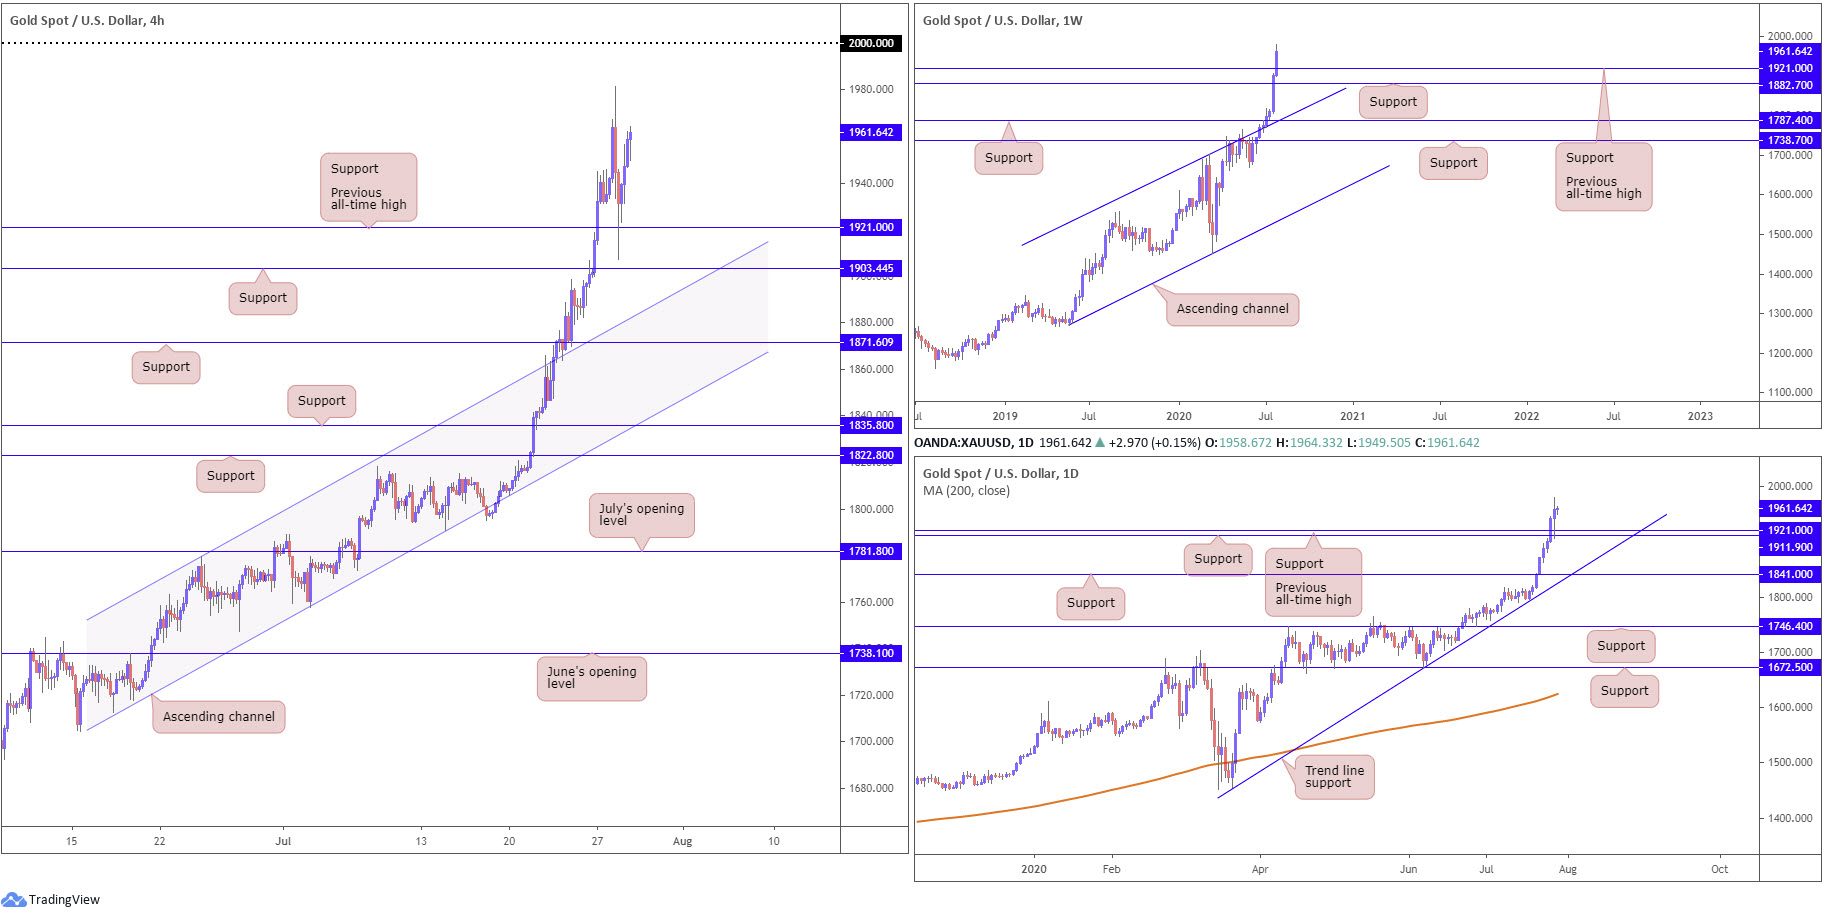
Technically, we can see the H4 candles retested the previous all-time high at 1921.0 yesterday, feeding traders a platform to execute dip-buying strategies. Notably, price also retested daily support at 1911.9 on Tuesday, missing H4 support at 1903.4 by a hair. Upside targets from current price has yesterday’s fresh all-time peak in view at 1981.3.
Areas of consideration:
Further buying is likely in this market, targeting 1981.3, followed by the 2000.0 widely watched level. Unless we pullback to 1921.0, or unless you’re comfortable drilling down to the lower timeframes in search of buying opportunities, the lack of nearby support on the H4 timeframe makes it a challenging market to buy, from a structural perspective.
The accuracy, completeness and timeliness of the information contained on this site cannot be guaranteed. IC Markets does not warranty, guarantee or make any representations, or assume any liability regarding financial results based on the use of the information in the site.
News, views, opinions, recommendations and other information obtained from sources outside of www.icmarkets.com.au, used in this site are believed to be reliable, but we cannot guarantee their accuracy or completeness. All such information is subject to change at any time without notice. IC Markets assumes no responsibility for the content of any linked site.
The fact that such links may exist does not indicate approval or endorsement of any material contained on any linked site. IC Markets is not liable for any harm caused by the transmission, through accessing the services or information on this site, of a computer virus, or other computer code or programming device that might be used to access, delete, damage, disable, disrupt or otherwise impede in any manner, the operation of the site or of any user’s software, hardware, data or property.


