
Key risk events today:
Australia CPI q/q and Trimmed Mean CPI q/q; Crude Oil Inventories; FOMC Statement, Federal Funds Rate and FOMC Press Conference.
(Italics represents previous analysis and outside sources).
EUR/USD:
Scoring highs of 98.16, the US dollar index continued to explore higher ground Tuesday, while on the data front we had mixed US durable goods before better-than-expected US consumer confidence.
According to the Census Bureau, new orders for manufactured durable goods in December increased $5.7 billion or 2.4 percent to $245.5 billion, the U.S. Census Bureau announced today. This increase, up two of the last three months, followed a 3.1 percent November decrease. Excluding transportation, new orders decreased 0.1 percent.
The Conference Board Consumer Confidence Index increased in January, following a moderate increase in December. The Index now stands at 131.6 (1985=100), up from 128.2 (an upward revision) in December.
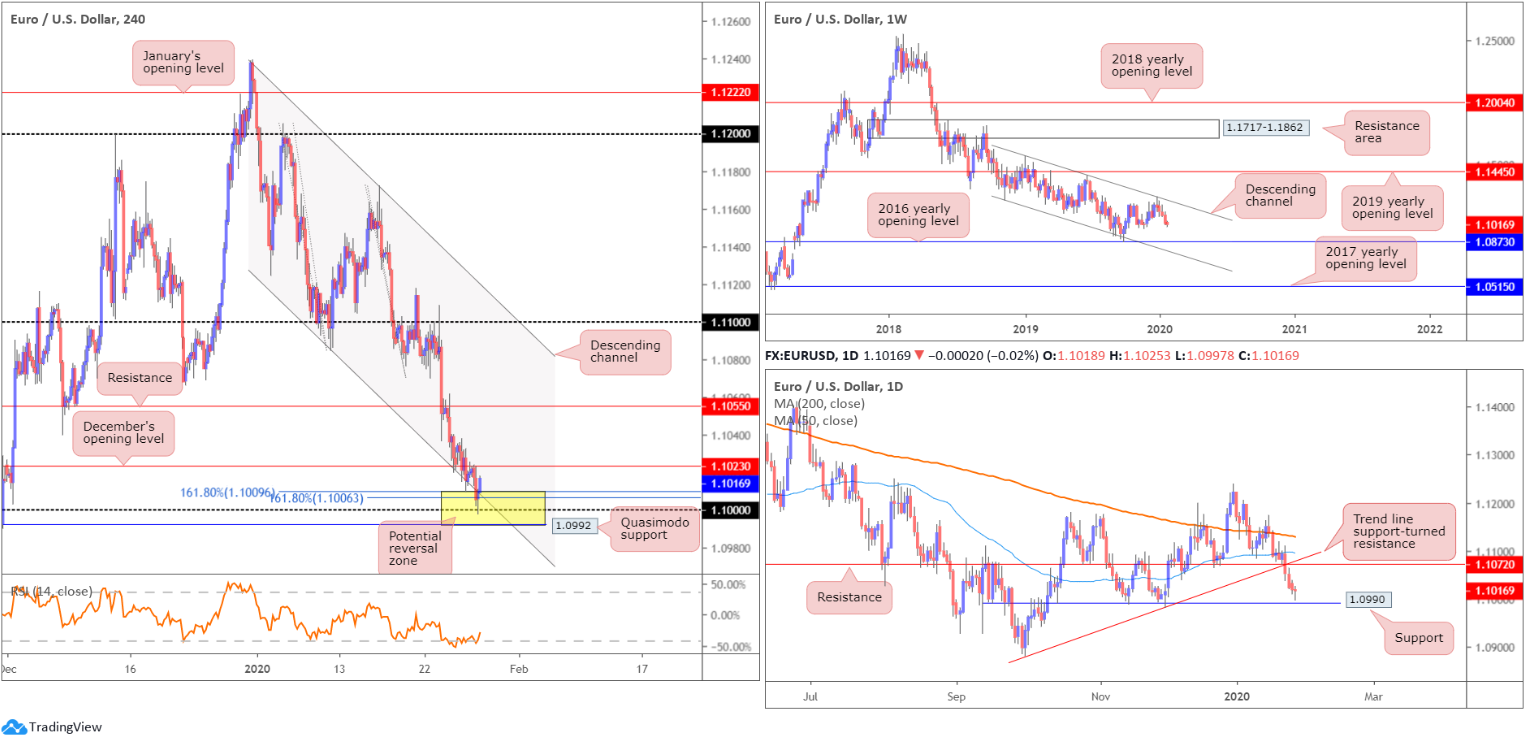
Technical research on EUR/USD saw H4 cross swords with the key figure 1.10 in recent hours and push higher. For those who read Tuesday’s report you may recall 1.10 boasts additional confluence in the shape of channel support, pencilled in from the low 1.1085, Quasimodo support at 1.0992 and two 161.8% Fibonacci extensions at 1.1006 and 1.1009 – yellow (1.0992/1.1009). Chart studies also show the relative strength index (RSI) testing oversold waters. It might also be worth noting daily support at 1.0990 is seen plotted just beneath the H4 zone.
Contrary to daily and H4 structure, the weekly timeframe exhibits scope to extend losses south of long-standing channel resistance, drawn from the high 1.1569. Assuming sellers remain in the driving seat this week, the 2016 yearly opening level at 1.0873 is feasible support followed by channel support, taken from the low 1.1109. Further supporting sellers is the primary trend, descending lower since topping in early 2018, at 1.2555.
Areas of consideration:
Well done to any traders long 1.0992/1.1009; this was a noted bullish reversal zone to keep an eye on. A H4 close above December’s opening level at 1.1023 is still likely on the radar for many before reducing risk. The next resistance targets beyond here rest at H4 resistance drawn from 1.1055, closely followed by daily resistance at 1.1072. Eyeing much higher than here is unlikely due to weekly price threatening lower moves.
GBP/USD:
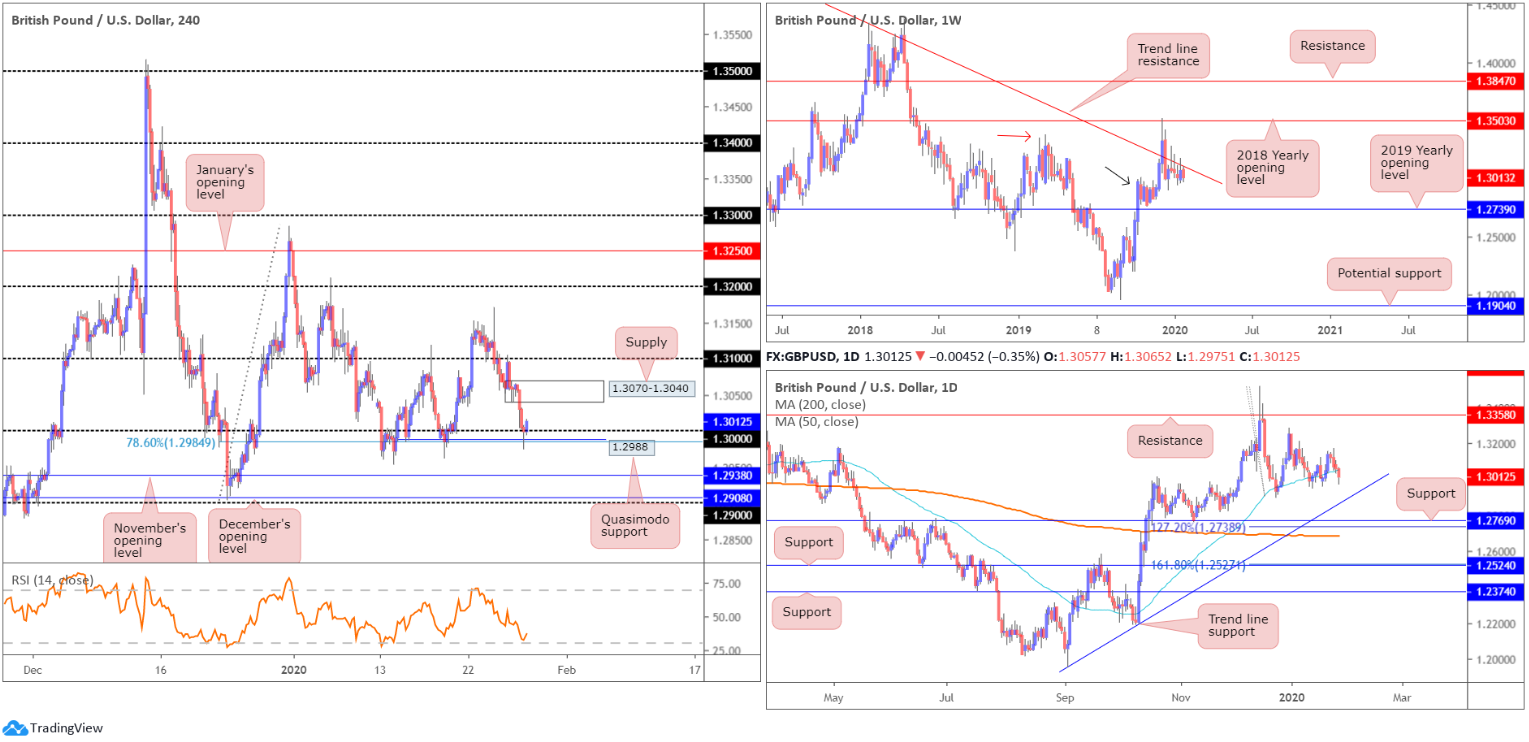
GBP/USD experienced limited respite Tuesday, consequently extending losses for a fourth successive session. With the US dollar index travelling north of 98.00, sterling whipsawed through the key figure 1.30 on the H4 timeframe and shook hands with Quasimodo support at 1.2988, as well as a 78.6% Fibonacci retracement at 1.2884. To the upside, supply rests relatively close by at 1.3070-1.3040, shadowed by the 1.31 handle. South of 1.30, however, we have November’s opening level at 1.2938 in sight, December’s opening level at 1.2908 and the 1.29 handle. Indicator-based traders might also note the relative strength index (RSI) hovering north of oversold territory.
Across the page on the daily timeframe, price pushed through the 50-day SMA (blue – 1.3050 yesterday, exposing trend line support, extended from the low 1.1958. Beyond here, support at 1.2769 and the 200-day SMA (orange – 1.2688) is seen. Note this SMA is in the process of flattening after drifting south since the beginning of July. With respect to resistance, the only levels of interest right now sit at the 1.3284 December 31st high and 1.3358, which capped upside since mid-June 2019.
Weekly price remains consolidating between long-standing trend line resistance, pencilled in from the high 1.5930, and demand around the 1.2939 region (black arrow), likely seduced by the recent break of the notable high at 1.3380 (red arrow). A break of the said trend line has the 2018 yearly opening level at 1.3503 to target, whereas a move south implies we might see a push to the 2019 yearly opening level at 1.2739, consequently tripping sell stops below the current demand zone.
Areas of consideration:
Traders short the 1.31 retest, a noted setup in previous analysis, reached the final take-profit level at 1.30. Well done to those who held ground.
Going forward, sell stops beneath 1.30 are largely filled, along with additional impetus derived from H4 Quasimodo support at 1.2988/78.6% Fibonacci retracement at 1.2984, which is possibly enough to draw in intraday buying towards H4 supply mentioned above at 1.3070-1.3040. Therefore, this space may be of interest to some readers this morning.
A decisive close south of 1.30 today, on the other hand, unlocks bearish scenarios to at least November’s opening level at 1.2938. Aggressive traders will look to trade the breakout candle’s close and position protective stop-loss orders accordingly, while conservative traders may opt to hold fire and wait for a retest at 1.30 to occur. This helps prevent getting taken out on a fakeout through 1.30, which is common viewing around psychological levels.
AUD/USD:
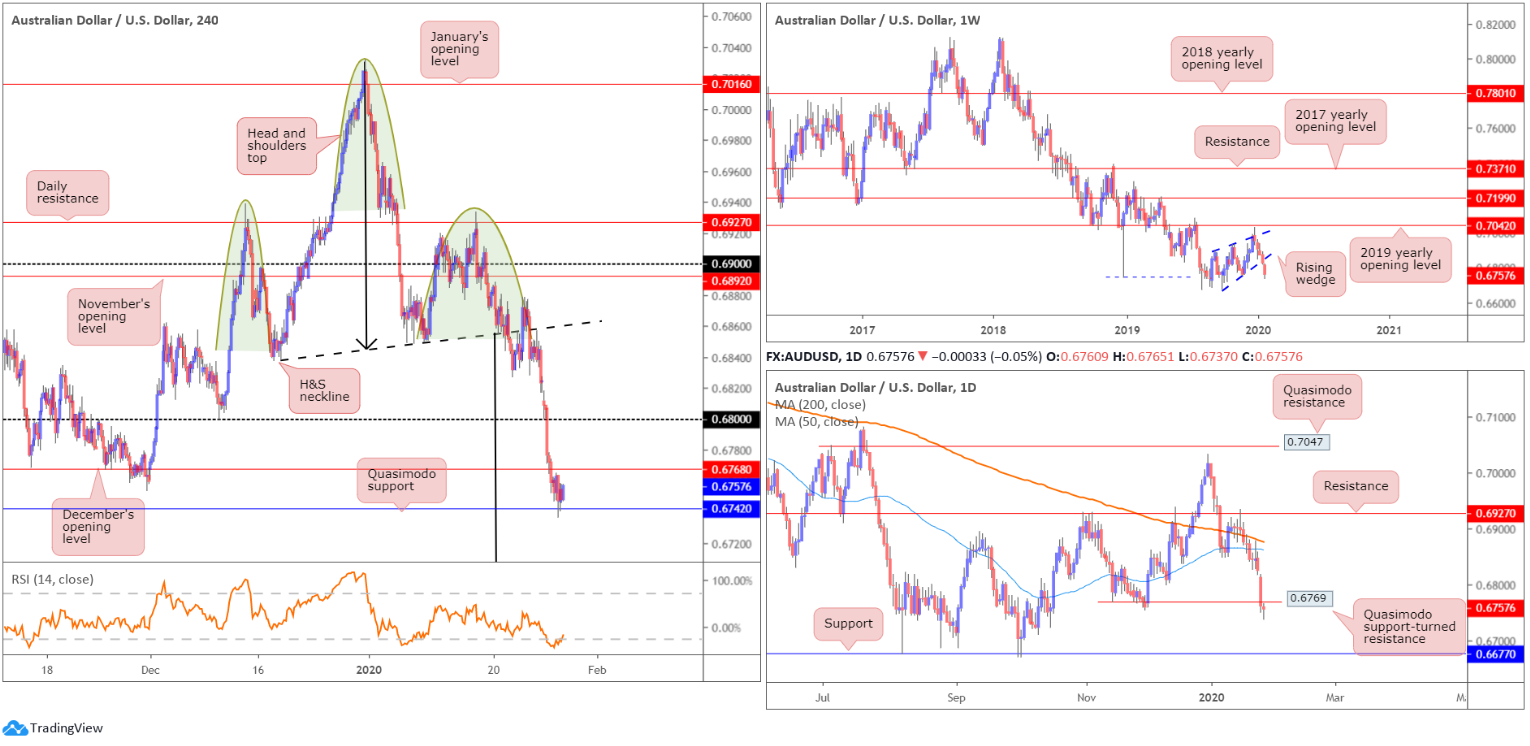
Overall, it was a relatively muted session Tuesday as price faded session lows off H4 Quasimodo support at 0.6742 into the closing hours. Monday witnessed H4 action give up 0.68-status and dethrone December’s opening level at 0.6768. The next port of call beyond 0.6742 is 0.67 (not visible on the screen). Also note the relative strength index (RSI) is seen attempting to climb out of oversold terrain.
Traders who read previous reports may also recall the following pieces (italics):
H4 price has been chalking up a head and shoulders top pattern since mid-December 2019 (left shoulder sports a top at 0.6938, right shoulder at 0.6933 and the head at 0.7031 – green). The neckline is drawn from the 0.6838 December 18 low and the 0.6850 January 9 low (black line).
H&S traders will be looking for 0.6671ish as a take-profit target (calculation from the head to neckline added to the breakout point – black arrows).
There will likely be traders short this market on last Tuesday’s H4 close south of the H&S neckline. In addition, as evident from the H4 chart, price retested the H&S neckline on Friday and rotated lower. This was another noted entry point.
Well done to any readers who remain short the H&S pattern.
On more of a broader perspective, the weekly timeframe, since registering a bottom in late September at 0.6670, has been carving out what appears to be a rising wedge formation, typically considered a continuation pattern. The past four weeks witnessed price decline back into the rising wedge and, thanks to recent selling, break the lower edge yesterday. With the primary downtrend having been in full force since topping at 0.8135, in early 2018, the recent close beyond the lower edge of the noted wedge formation may trigger weighty sell stops, both from lower-timeframe traders entering long the shorter-term correction and longer-term traders’ breakout sell orders.
Price action on the daily timeframe elbowed through Quasimodo support at 0.6769, testing lows of 0.6737 yesterday. With this level now likely to serve as resistance, limited support is seen on this timeframe until we reach support coming in at 0.6677.
Areas of consideration:
Well done to any readers short the H4 H&S formation, either on last Tuesday’s breakout or Friday’s neckline retest. With 0.68 and December’s opening level at 0.6768 cleared, H4 Quasimodo support at 0.6742 is next on tap to break. Beyond here, 0.67 is visible, with a violation presenting the H&S take-profit target around 0.6670ish.
Additional selling opportunities, based on a H4 retest at 0.6768, preferably in the shape of a H4 or H1 bearish candlestick pattern (entry and risk can be defined according to this configuration), may also be an option worthy of consideration today.
USD/JPY:
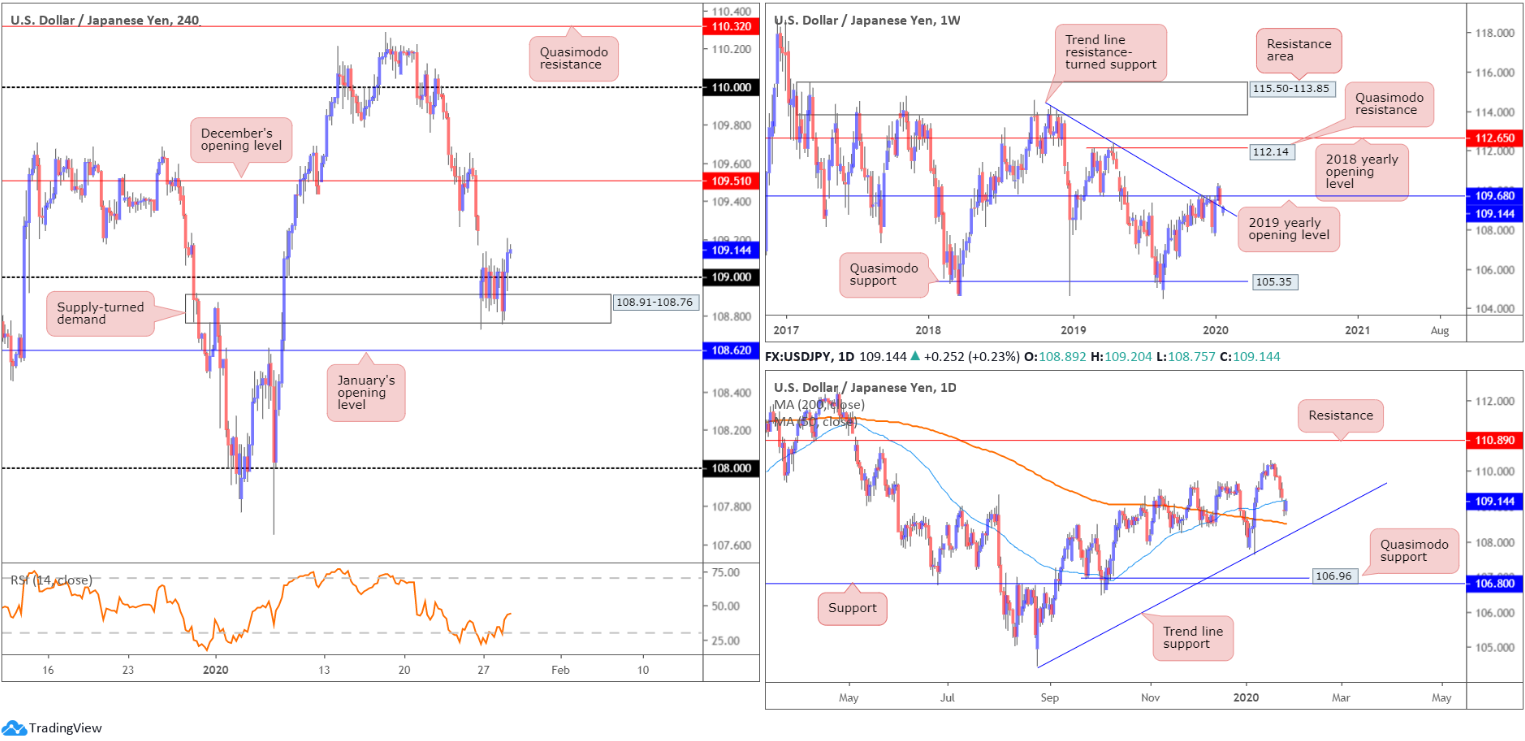
USD/JPY bulls entered an offensive phase Tuesday, amid reports of various vaccines for the Coronavirus that could be ready within months. Consequently, this weakened safe havens, with USD/JPY reclaiming 109+ status out of H4 supply-turned demand at 108.91-108.76.
Tuesday’s technical briefing reported the following:
The H4 supply-turned demand at 108.91-108.76 is in focus this morning, confirmed by the H4 relative strength index (RSI) testing oversold territory. A decisive close above 109 out of the said zone might be enough to fill the weekend gap and try for December’s opening level at 109.51.
The weekend’s gap, as you can see, was filled yesterday, though, as of current price, the unit appears uncertain to push higher – H4 price currently displays an indecision doji candle. This may have something to do with daily price testing the underside of its 50-day SMA (blue – 109.17).
The story on the weekly timeframe has price trading marginally beneath the 2019 yearly opening level at 109.68 and a touch north of trend line resistance-turned support, extended from the high 114.23. Buying from here may set the long-term stage for a run to Quasimodo resistance at 112.14 and the 2018 yearly opening level at 112.65, whereas moves lower underscores the 107.65 Jan 6 low.
The recent decline on the daily timeframe brought price through the 50-day SMA (blue – 109.17). Note the said SMA crossed above the 200-day SMA (orange – 108.50) mid-December, referred to as a ‘Golden Cross’. Trend line support, drawn from the low 104.44, may enter sight this week, in the event we continue exploring lower ground, while a push back above the said 50-day SMA has the 110.29 January 17 high to play for, with a break targeting resistance at 110.89.
Areas of consideration:
While yesterday’s decisive close above 109 likely enticed some buyers long into the market, conservative traders are likely honing in on a potential retest at 109, before pulling the trigger. A retest at 109, although open to a fakeout into 108.91-108.76, is the more conservative approach, having noted daily price testing the underside of the 50-day SMA.
As underlined above, the initial take-profit target north of 109 is December’s opening level at 109.51. This is an ideal location to reduce risk to breakeven and take partial profits off the table.
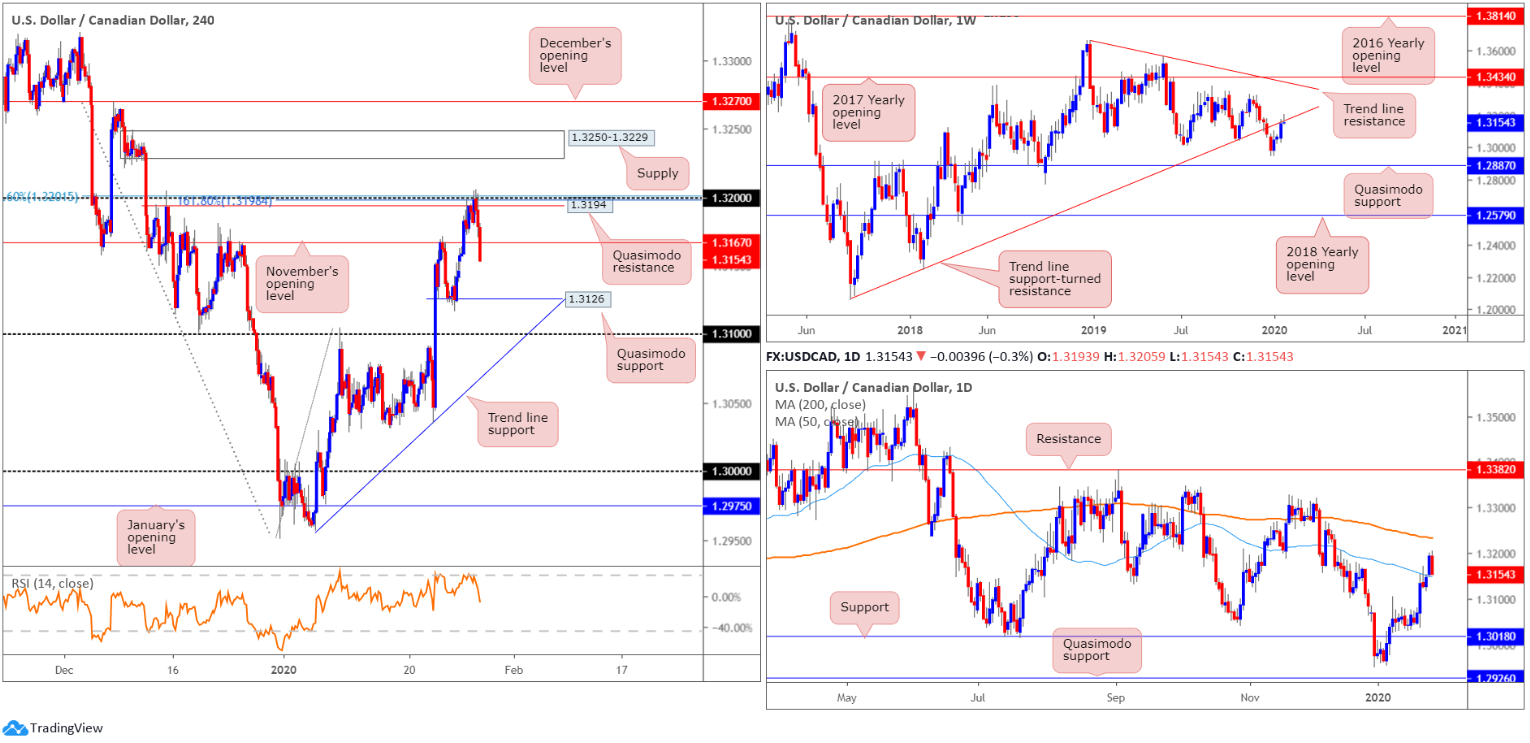
USD/CAD:
USD/CAD snapped a two-day winning streak Tuesday, as the Canadian dollar gleaned support from a rebound in oil prices – WTI closing in on $54.00/bbl. Mixed US durable goods orders and optimistic US consumer confidence failed to provide much impetus.
Traders who read Tuesday’s technical report may recall the following (italics):
Shorter-term flow on the H4 timeframe is fading an interesting spot of resistance around the 1.32 band. Comprised of a Quasimodo resistance level at 1.3194, the 1.32 handle, the 78.6% Fibonacci retracement at 1.3201, a 161.8% Fibonacci extension at 1.3198 and the relative strength index (RSI) testing overbought terrain, this combination is likely to force a retest at 1.3168, November’s opening level, and perhaps Quasimodo support at 1.3126.
Entry short at current price is an option, based on H4 reflecting a reasonably confluent area of resistance around 1.32. Protective stop-loss orders can be positioned above the Quasimodo apex at 1.3204, though this is trader dependent.
As evident from the H4 chart, price did indeed reject 1.32 yesterday, following through with a break of 1.3167 in recent hours and possibly clearing the pathway to 1.3126. Well done to those who sited stop-loss orders above 1.3204; the recent decline has presented mouth-watering risk/reward.
Weekly activity remains at the underside of trend line support-turned resistance, extended from the low 1.2061. Continued bidding from here could reach tops around 1.3317, closely followed by trend line resistance (1.3661) and the 2017 yearly opening level at 1.3434. A rejection lower, on the other hand, may prompt a selloff to the 1.2951 December 30 low, followed by a Quasimodo formation at 1.2887. The immediate trend has faced north since bottoming in September 2017; however, this move could also be considered a deep pullback in a larger downtrend from the 1.4689 peak in early January 2016.
A closer reading of price action on the daily timeframe saw the unit cross above the 50-day SMA (blue – 1.3149) Monday. While the breach unlocks the door for an approach towards the 200-day SMA (orange – 1.3233), a retest at the said 50-day SMA is now likely. Both SMAs currently point south.
Areas of consideration:
Well done to any readers short 1.32; the risk/reward, as stated above, is incredibly attractive, with H4 Quasimodo support at 1.3126 set as the next downside target.
A H4 close below 1.3167 is likely to generate additional downside, based on traders selling the breakout and targeting the said H4 Quasimodo support. Should the H4 candles retest 1.3167 and produce a bearish candlestick signal, this not only recognises seller intent, it provides entry and risk levels to work with as well.
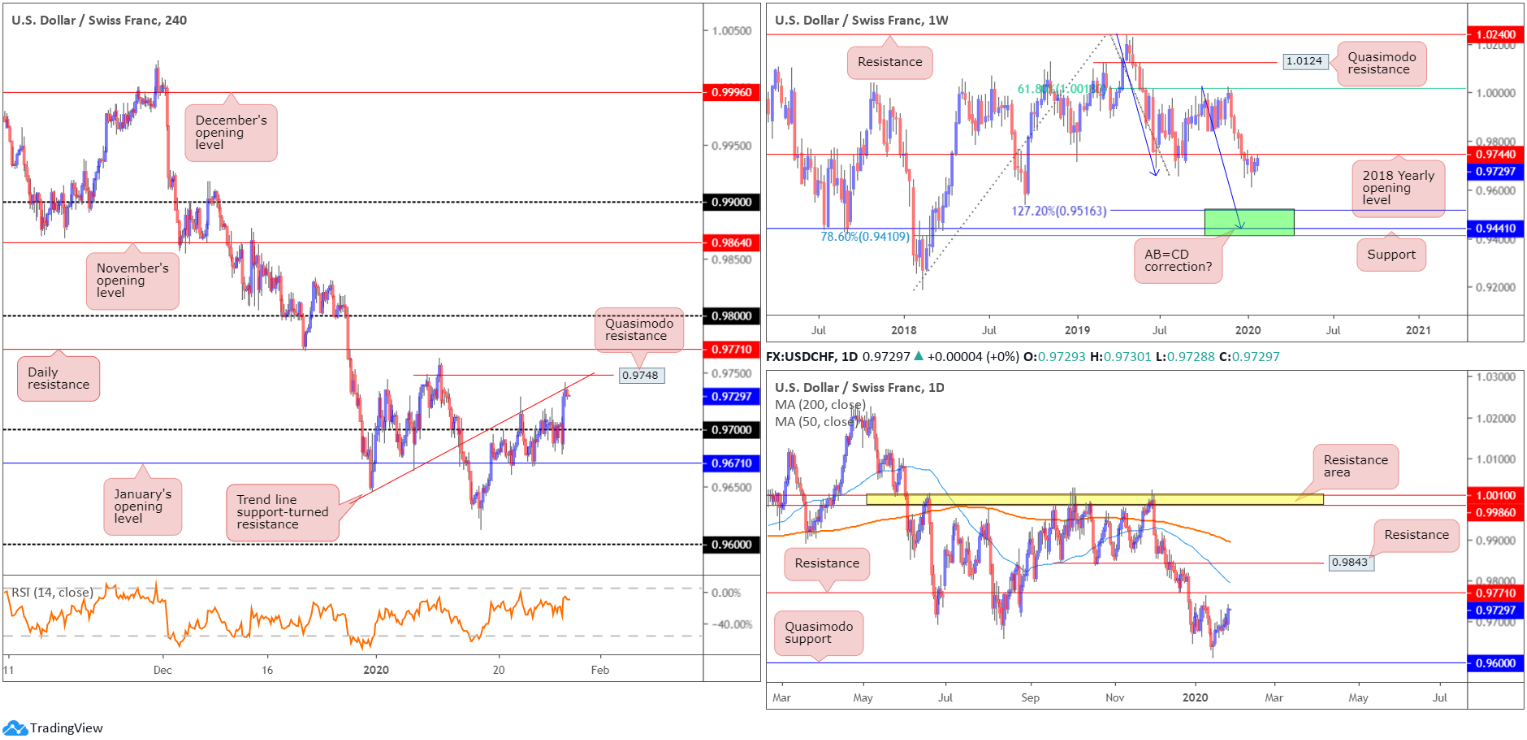
USD/CHF:
USD/CHF bulls stepped up the pace Tuesday, munching through 0.97 to the upside and crossing paths with trend line support-turned resistance on the H4, extended from the low 0.9646. Recovering market sentiment and broad-based USD strength seems to have helped the pair gain traction.
Reports suggesting the coronavirus outbreak could reach its peak in the next seven to ten days, as well as reports of various vaccines that could be ready within months, appears to be helping the market mood turn positive.
A touch above the noted trend line resistance rests Quasimodo resistance at 0.9748. Note this level also aligns closely with weekly resistance, formed in the shape of the 2018 yearly opening level, at 0.9744.
In terms of the weekly and daily timeframes, Monday’s report holds strong:
Holding south of the 2018 yearly opening level at 0.9744, the next downside target sits within 0.9410/0.9516, comprised of a 78.6% Fibonacci retracement at 0.9410, support at 0.9441 and a 127.2% AB=CD bullish correction (black arrows]) at 0.9516 – green. Overthrowing 0.9744, however, likely clears the river north back up to the 61.8% Fibonacci retracement at 1.0018, a level that’s capped upside since mid-June 2019.
According to structure on the daily timeframe, price could still swipe either way. Resistance is positioned at 0.9771 and support, shaped in the form of a Quasimodo formation, at 0.9600. It might also interest some traders to note the 200/50-day SMAs point southbound (0.9894/0.9795), with the spread between the two expanding since late December.
Areas of consideration:
Having noted weekly resistance plotted at 0.9744, which aligns closely with H4 Quasimodo resistance at 0.9748 and H4 trend line resistance, this area is a zone worthy of the watchlist for shorts (sells). However, waiting for additional H4 candlestick confirmation to form (entry and risk can be calculated based off this pattern) is still probably a good idea for traders threatened by a potential move to daily resistance at 0.9771.
The initial downside target off 0.9748/4 sits at the 0.97 level.
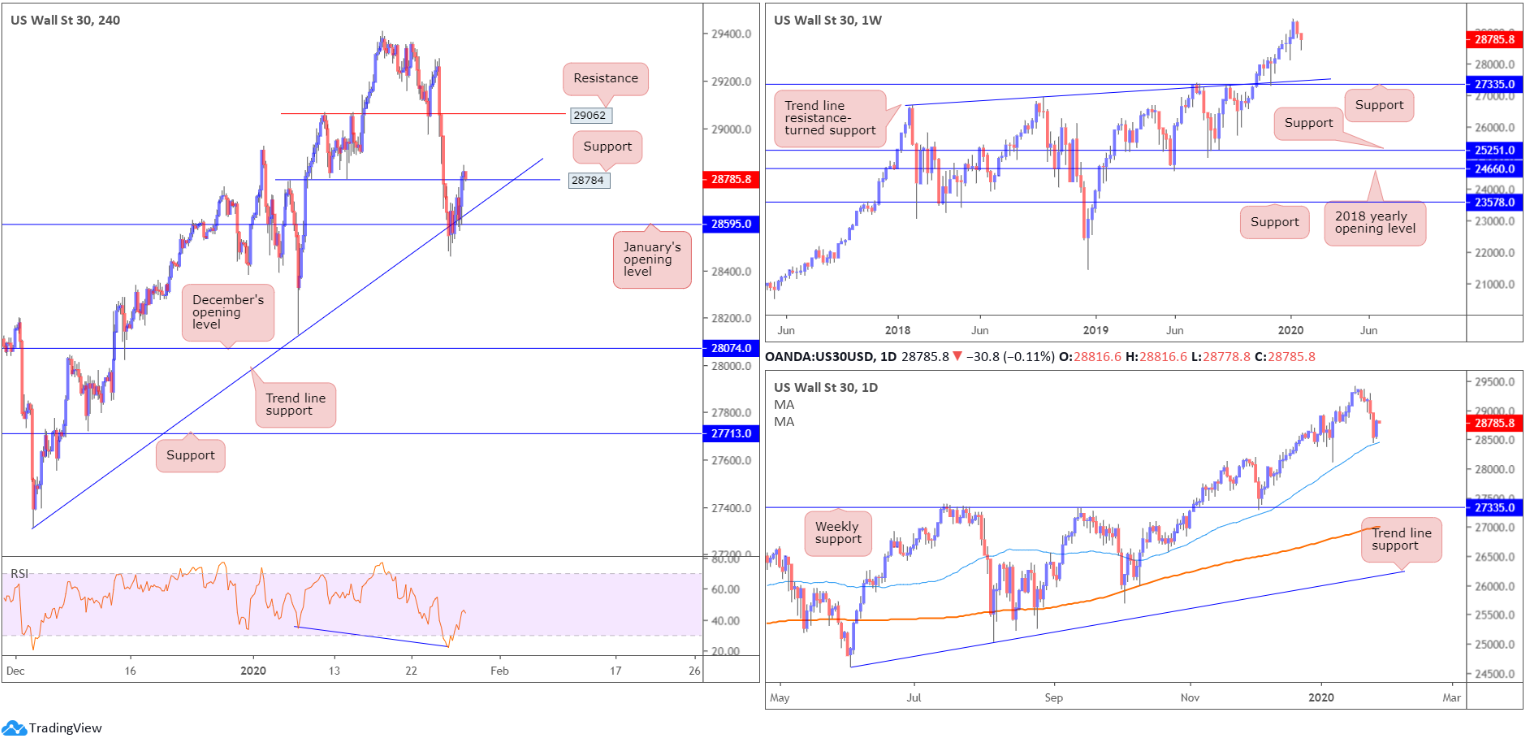
Dow Jones Industrial Average:
US equities firmed Tuesday, snapping a five-day bearish phase, following improving economic data and reports of various vaccines for the Coronavirus that could be ready within months. The Dow Jones Industrial Average added 187.05 points, or 0.66%%; the S&P 500 advanced 32.62 points, or 1.01% and the tech-heavy Nasdaq 100 ended higher by 138.75 points, or 1.55%.
Technical research, based on the H4 timeframe, demonstrates price action recovered from trend line support, extended from the low 27314, and January’s opening level at 28595, which was confirmed by the relative strength index (RSI) forming hidden bullish divergence within oversold territory (blue line). Well done to any readers who found a long from this angle as price recently cut through resistance at 28784 (now serving support); this was a noted reversal zone in Tuesday’s analysis.
Higher-timeframe action has daily price recovering a touch above its 50-day SMA (blue – 28453), while weekly price exhibits scope to push as far south as trend line resistance-turned support (26670), and support coming in at 27335.
Areas of consideration:
Traders long from the said H4 trend line have likely reduced risk to breakeven, based on the H4 close north of resistance 28784, and maybe even cashed in a portion of the position. The next upside target, from a technical standpoint, falls in at another layer of resistance drawn from 29062.
Those who missed the initial long may look at possible buying opportunities above 28784 today. Breakout buyers may already be long at 28671, though conservative players are likely seeking a retest setup, best if formed by way of a H4 bullish candlestick signal (can be used to structure entry and risk levels), before committing.
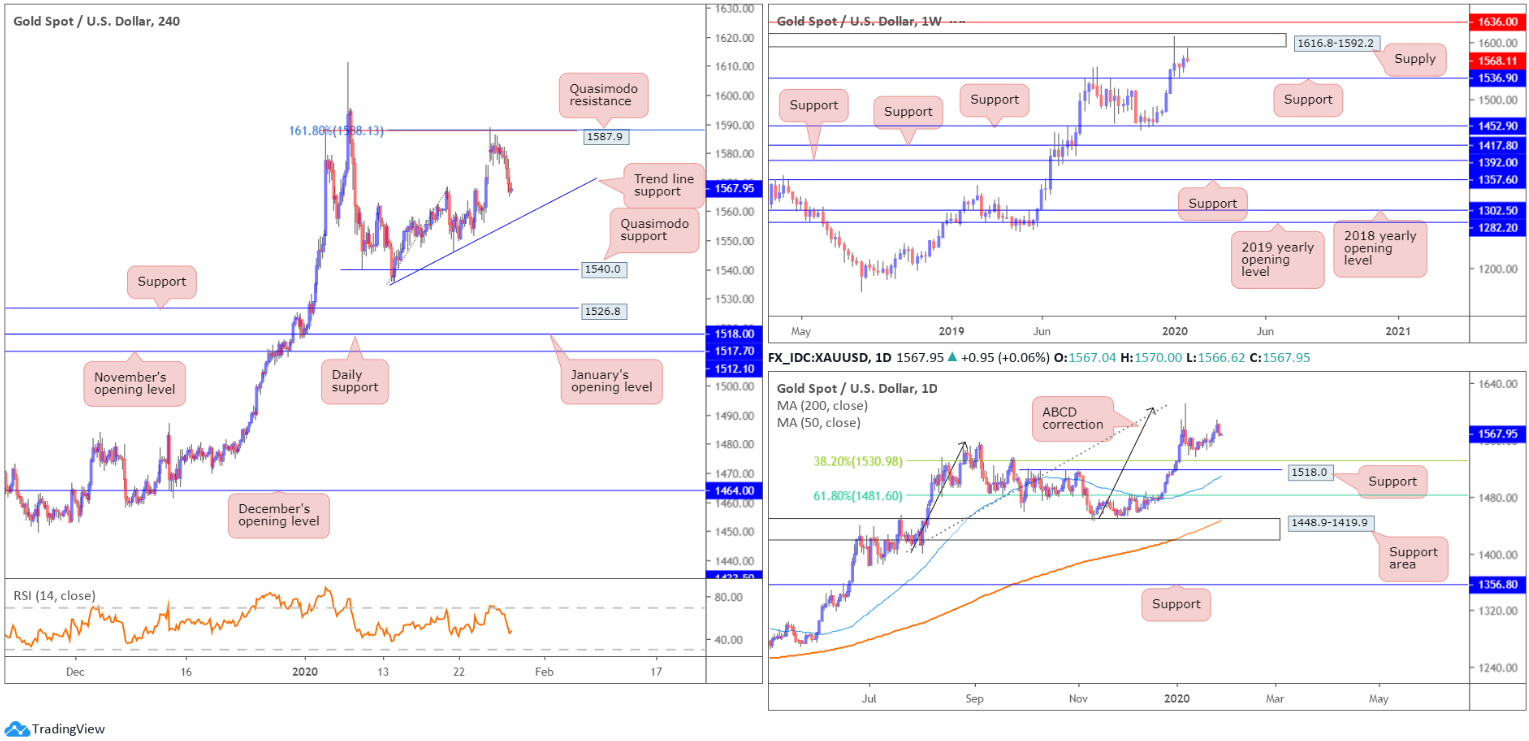
XAU/USD (GOLD):
Tuesday had bullion lower against its US counterpart, pressured on the back of improving market sentiment, a stronger dollar and recovering US Treasury yields. XAU/USD snapped a four-day bullish phase, filled the weekly opening gap and closed beneath Monday’s low 1571.2.
For traders who read Tuesday’s technical briefing you will likely recall the research team emphasising Monday’s action latched onto H4 Quasimodo resistance at 1587.9/the 161.8% Fibonacci extension at 1588.1. What was also interesting, from a technical perspective, is a few points north of the current H4 Quasimodo lies weekly supply drawn from 1616.8-1592.2.
Tuesday’s analysis also went on to report the following:
According to the daily chart, price action turned higher just ahead of the 38.2% Fibonacci retracement at 1530.9, closely followed by 1518.0. The former offers an initial take-profit target for traders short the ABCD bearish correction (black arrows) at 1608.0.
Given weekly supply lurks just north of the current H4 Quasimodo resistance level, further selling could be in store. However, seeing as there’s a risk of price action driving higher into the said weekly supply before turning lower, traders are urged to wait for at least additional candlestick confirmation before pulling the trigger. This helps identify seller intent and provides entry and risk levels to work with.
Areas of consideration:
As can be seen from the H4 chart this morning, price extended losses south of Quasimodo resistance. Well done to any readers who took advantage of this move, as a H4 outside bearish candlestick was seen prior to the decline. The next downside target from this point can be seen at trend line support, taken from the low 1536.0. A break of here potentially highlights Quasimodo support at 1540.0.
The accuracy, completeness and timeliness of the information contained on this site cannot be guaranteed. IC Markets does not warranty, guarantee or make any representations, or assume any liability regarding financial results based on the use of the information in the site.
News, views, opinions, recommendations and other information obtained from sources outside of www.icmarkets.com.au, used in this site are believed to be reliable, but we cannot guarantee their accuracy or completeness. All such information is subject to change at any time without notice. IC Markets assumes no responsibility for the content of any linked site.
The fact that such links may exist does not indicate approval or endorsement of any material contained on any linked site. IC Markets is not liable for any harm caused by the transmission, through accessing the services or information on this site, of a computer virus, or other computer code or programming device that might be used to access, delete, damage, disable, disrupt or otherwise impede in any manner, the operation of the site or of any user’s software, hardware, data or property.


