
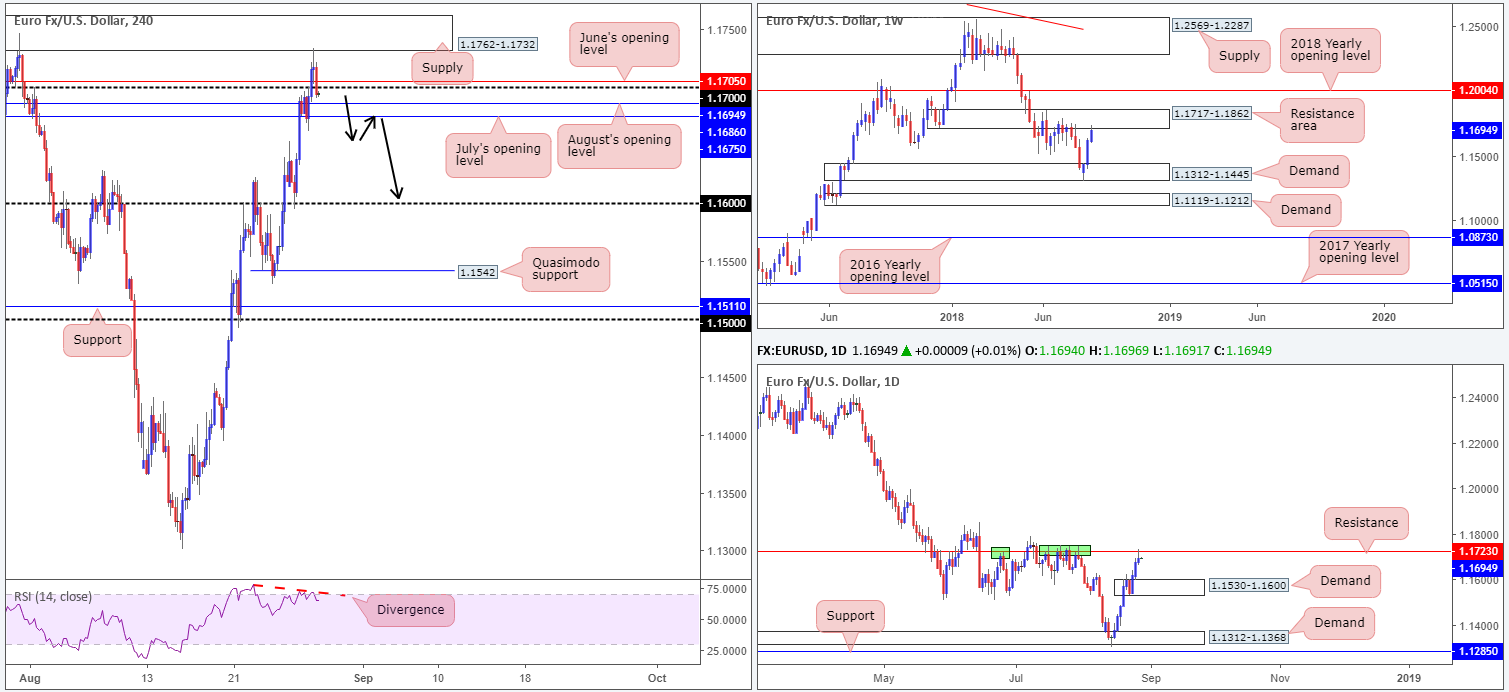
EUR/USD:
Entering US hours on Tuesday, H4 supply at 1.1762-1.1732, as you can see, elbowed its way into the spotlight. The H4 candles turned south from the underside of this base and closed beneath the nearby 1.17 handle. Before sellers can stretch their legs here, though, July’s opening level at 1.1675 and August’s opening level at 1.1686 will need to be consumed. The next area of support seen beyond these monthly opening levels falls in at the 1.16 handle.
For those who read Tuesday’s report you may recall the team highlighting the current H4 supply zone as a potential sell – well done to any of our readers who managed to take advantage of this move. The reasons behind selecting this zone (aside from the H4 supply already being a proven area) came down to weekly movement displaying a resistance area at 1.1717-1.1862, along with a daily resistance level positioned at 1.1723. Further adding to this, H4 RSI divergence was clearly evident.
Areas of consideration:
Folks who missed the opportunity to sell from the aforementioned H4 supply zone yesterday may be offered a second chance to jump aboard this possible bearish train today. Knowing we’re coming from strong higher-timeframe resistances, a H4 close below July’s opening level mentioned above at 1.1675 is likely in store. This – coupled with a retest of 1.1675 as resistance in the shape of a full or near-full-bodied H4 bearish candle – would likely be sufficient enough to begin considering shorts, targeting the 1.16 handle, which also actually represents the top edge of a daily demand zone at 1.1530-1.1600 (the next downside target on the daily timeframe).
Today’s data points: US prelim GDP q/q.
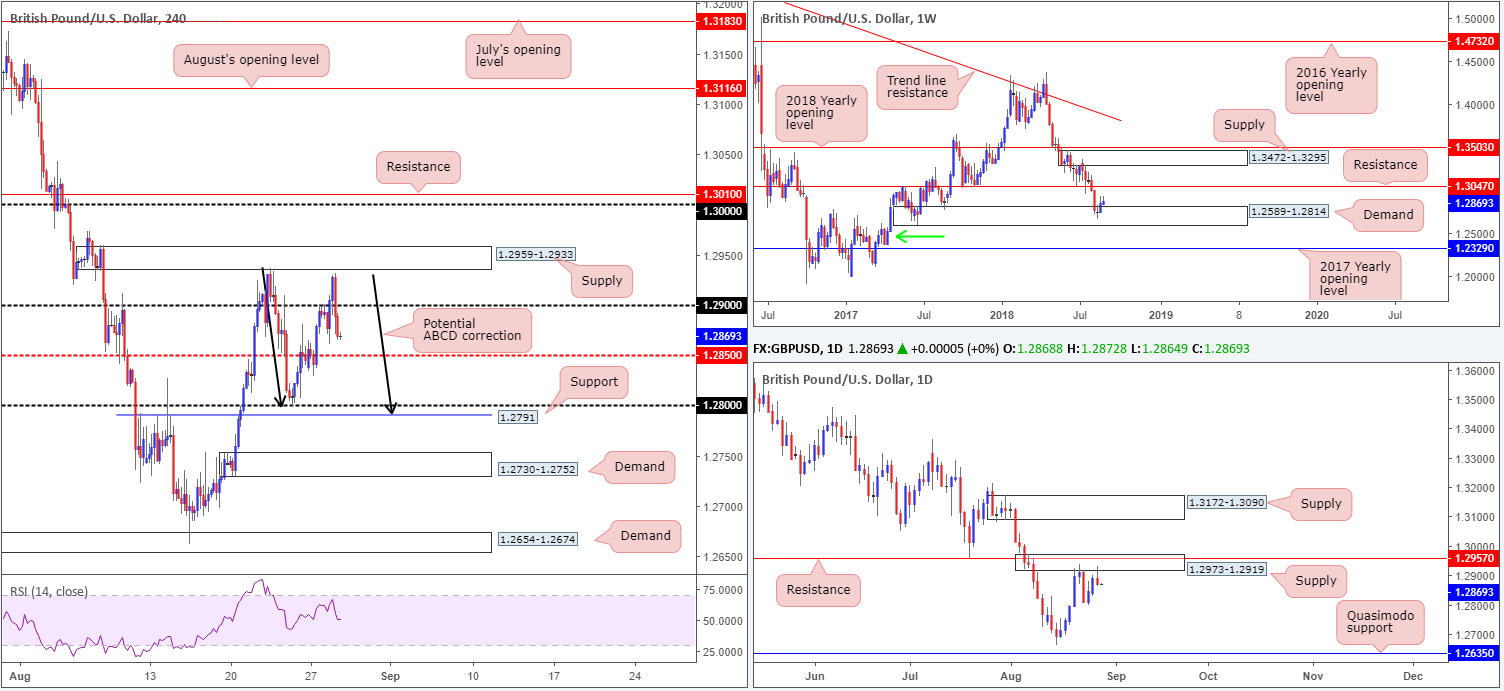
GBP/USD:
Persistent USD weakness lifted sterling to weekly highs of 1.2931 during London’s morning session on Tuesday, though swiftly recoiled amid US hours just south of a H4 supply zone coming in at 1.2959-1.2933, trimming earlier gains. As is evident from the H4 timeframe, the pair reclaimed the 1.29 handle and is currently seen hovering just ahead of mid-level support at 1.2850.
In the event the H4 chart continues to print bearish candles, traders could potentially observe a 1:1 (ABCD) move take shape (black arrows) that marginally eclipses 1.28 and challenges nearby support at 1.2791. What’s also interesting from a technical standpoint is daily supply at 1.2973-1.2919 – brought into the fight during yesterday’s movement in the shape of a bearish pin-bar formation. In terms of weekly activity, on the other hand, demand 1.2589-1.2814 continues to support this market, though has yet to generate much follow-through buying.
Areas of consideration:
While we do have an attractive supply area in play on the daily timeframe, along with a particularly appealing bearish candlestick signal, the mid-level H4 support mentioned above at 1.2850 may hinder downside today. A H4 close beneath 1.2850 would likely set the stage for a run down to 1.28, which as we already know is where a possible 1:1 H4 completion may take place.
For folks interested in selling this market, although high probability according to daily structure, does have you playing against possible H4 and weekly buyers! Therefore, trade with caution.
Today’s data points: US prelim GDP q/q.
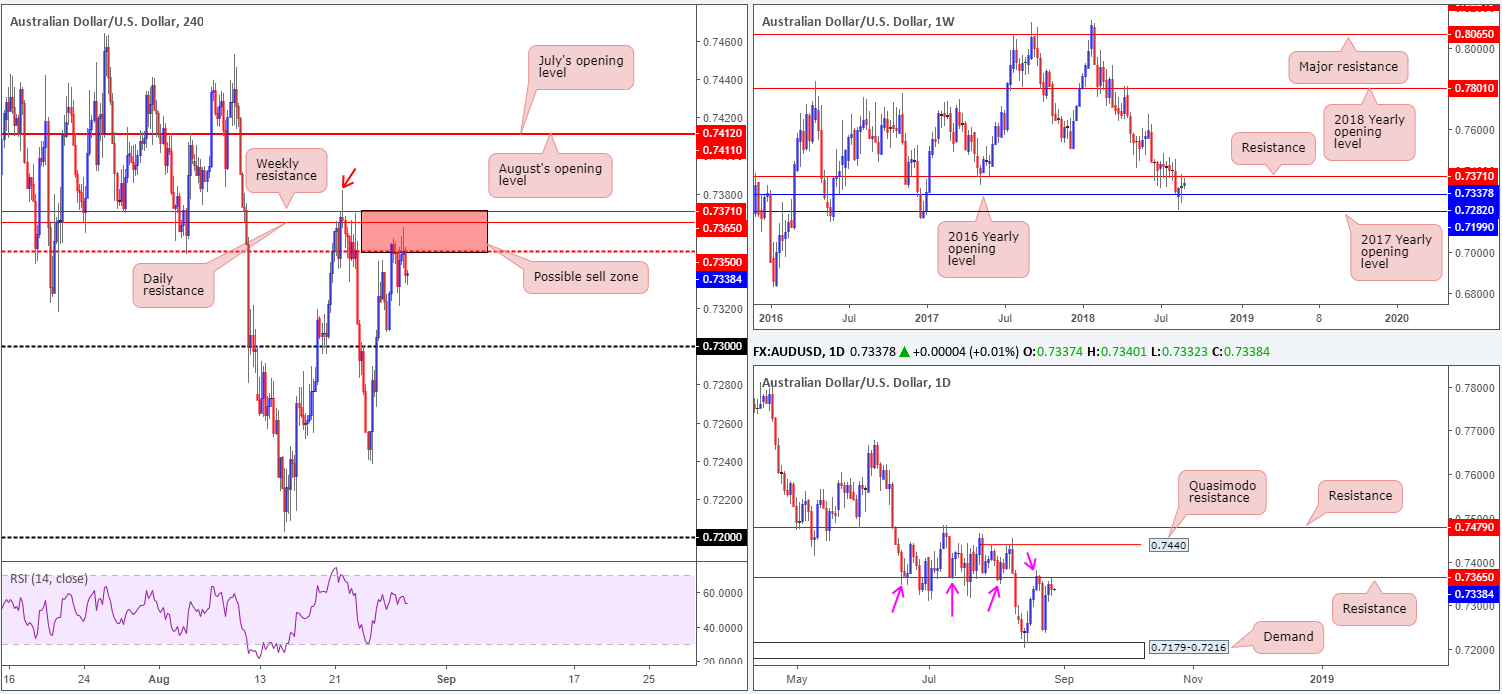
AUD/USD:
AUD/USD prices are effectively unchanged this morning. Price action was confined to a tight range around the H4 mid-level resistance at 0.7350 during Tuesday’s sessions. In view of this lackluster performance, much of the following piece will echo thoughts put forward in yesterday’s report.
Weekly price action is seen poised to challenge weekly resistance at 0.7371, following last week’s clear-cut indecision candle. This base, as can be seen on the H4 chart, is positioned above the H4 mid-level resistance mentioned above at 0.7350. Supporting the weekly level is also a daily resistance hurdle seen just below it at 0.7365. Note this barrier acted firmly as support not too long ago and also held ground as resistance on Monday last week (pink arrows).
Areas of consideration:
The red H4 zone seen at 0.7371/0.7350 (comprised of the noted weekly and daily resistance levels as well as the H4 mid-level resistance) is certainly somewhere active sellers likely have their eye on this morning.
Technically speaking, though, waiting for price to touch gloves with the daily resistance level at 0.7365 before pressing the sell button may be the better path to take. Not only will this offer traders more of a favorable risk/reward, it’ll also mean you trade from key higher-timeframe resistance. As you can see, price came within inches of testing this level yesterday.
Aggressive traders may opt to go in full throttle at market from 0.7365, with stop-loss orders positioned above 0.7381 (August 21 high – red arrow), whereas conservative traders will likely look for additional H4 candle confirmation before pulling the trigger, and place stops according to those candlestick signals – think bearish pin-bar formations here etc.
Today’s data points: US prelim GDP q/q.
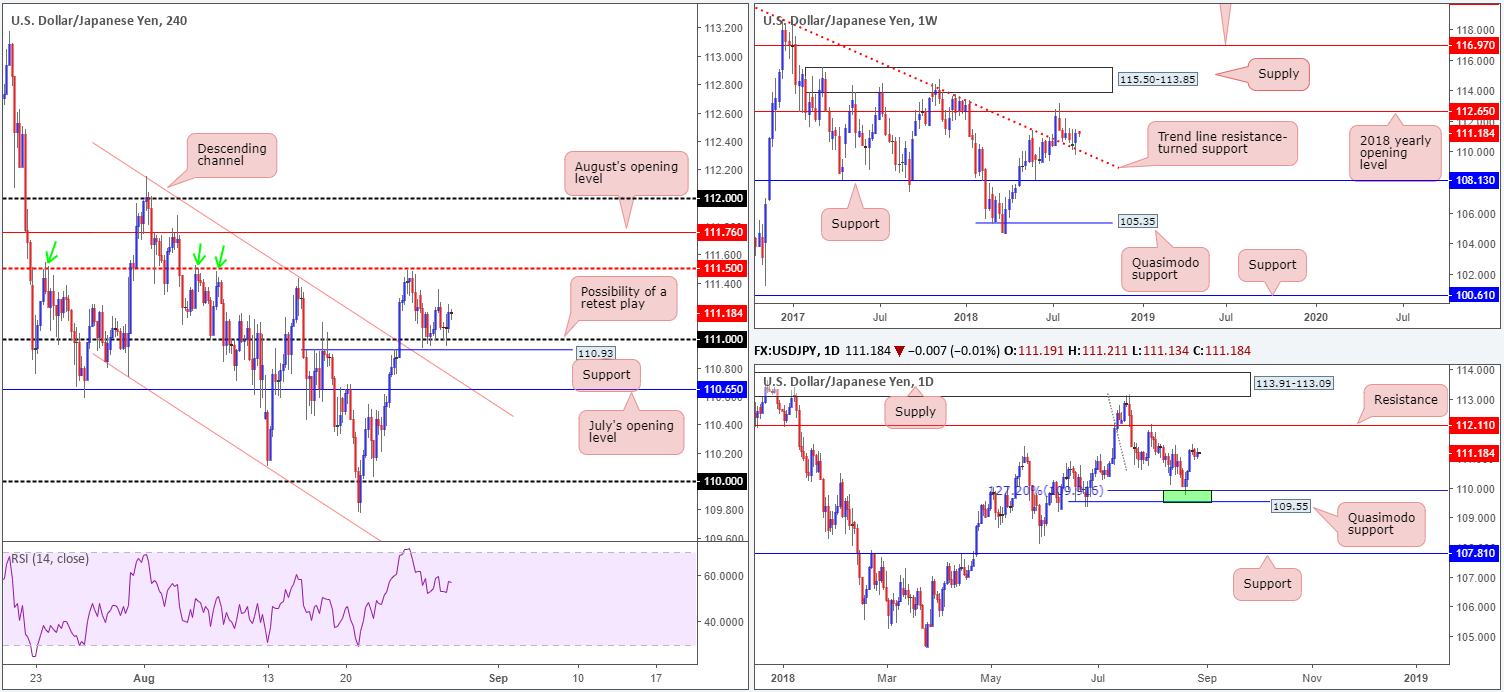
USD/JPY:
Since the beginning of the week, USD/JPY movement has somewhat stagnated. Likely brought on by the USD trading broadly lower and US equities advancing higher, the H4 candles are seen confined to a 40-pip range off of the 111 handle, shadowed closely by a minor H4 support at 110.93.
Despite the recent consolidation phase, higher prices are still likely on the cards, according to the overall technical picture. Weekly movement, as you can see, retested a trend line resistance-turned support (taken from the high 123.57) last week in the form of a strong bullish candle. Having seen this line hold firm as resistance on a number of occasions in the past, it’s likely to remain a defensive barrier going forward. Further buying from current price has the 2018 yearly opening level at 112.65 to target. In terms of the daily timeframe, the next obvious upside target on this scale does not come into view until resistance at 112.11.
Areas of consideration:
Those who entered long off the 111 handle without additional candlestick confirmation (this was a possible buy level highlighted in previous reports), well done for hanging in there.
As of yet, conservative traders are almost certainly still waiting for additional candlestick confirmation to be seen before pulling the trigger off 111.
Upside targets from 111 remain fixed at 111.50, August’s opening level at 111.76, the 112 handle, followed closely by daily resistance mentioned above at 112.11.
Today’s data points: US prelim GDP q/q.
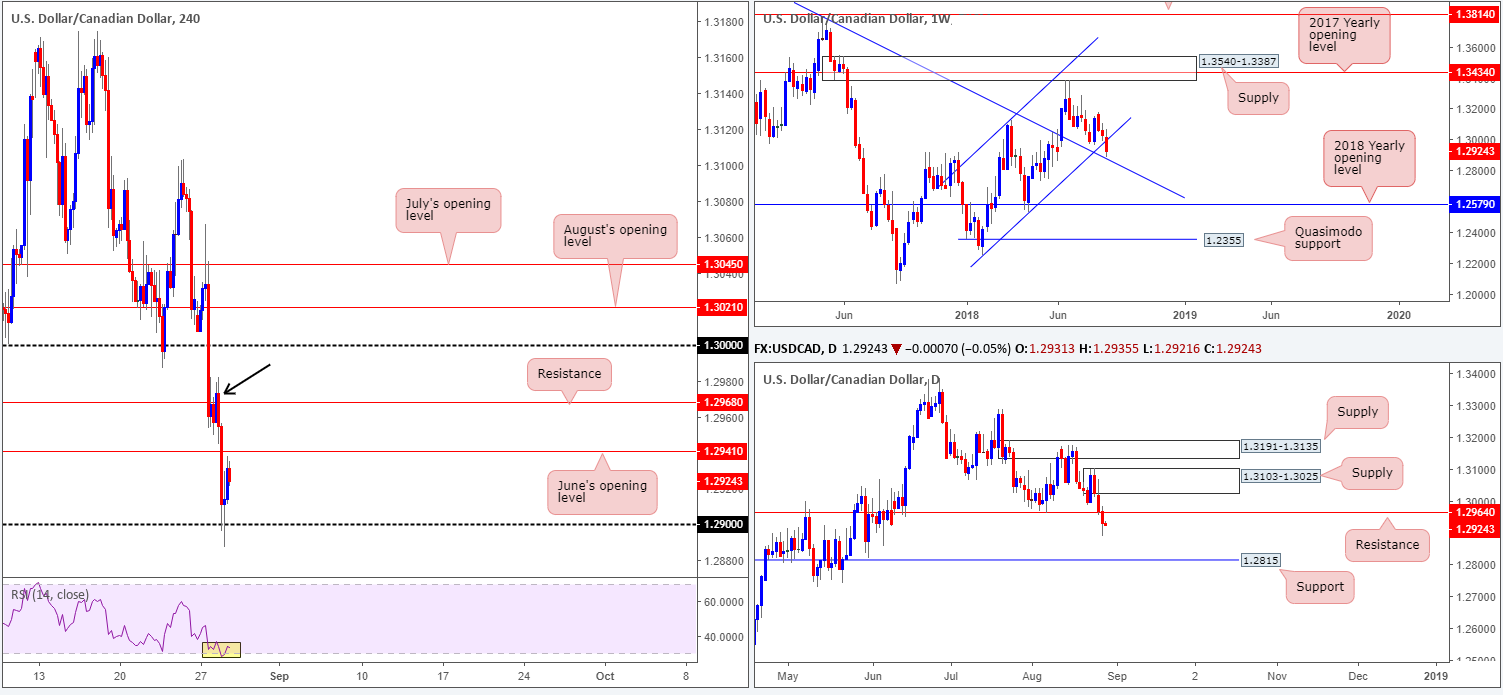
USD/CAD:
Persistent USD weakness, along with NAFTA optimism, continues to favor the Canadian dollar this week. USD/CAD’s H4 candles crunched their way through June’s opening level at 1.2941 on Tuesday, permitting a test of the 1.29 handle, which, as you can see, held and mildly pared losses into the closing bell. While the response from 1.29 was strong, upside is limited by not only June’s opening level, but also a H4 resistance at 1.2968 and its eclipsing H4 supply marked with a black arrow at 1.2982-1.2954.
What’s also notable from a technical standpoint is daily price broke beneath support at 1.2964 (now acting resistance), potentially clearing the river south towards support penciled in at 1.2815. In addition to this, traders may have also noticed weekly price came within shouting distance of a trend line resistance-turned support (etched from the high 1.4689).
Areas of consideration:
As weekly price has yet to cross swords with the aforementioned trend line resistance-turned support, additional downside may be on the cards today. This weekly trend line is considered, at least according to our read that is, the ultimate take-profit target for shorts in this market at the moment.
Possible sell zones fall in at June’s opening level on the H4 timeframe at 1.2941 and the H4 resistance seen above it at 1.2968. Note 1.2968 also fuses nicely with daily resistance mentioned above at 1.2964, and is therefore, the more favored sell zone. Stop-loss placement beyond 1.2968 is likely best positioned above the H4 supply seen encasing the level at 1.2982-1.2954.
Today’s data points: US prelim GDP q/q; CAD current account; Crude oil inventories.
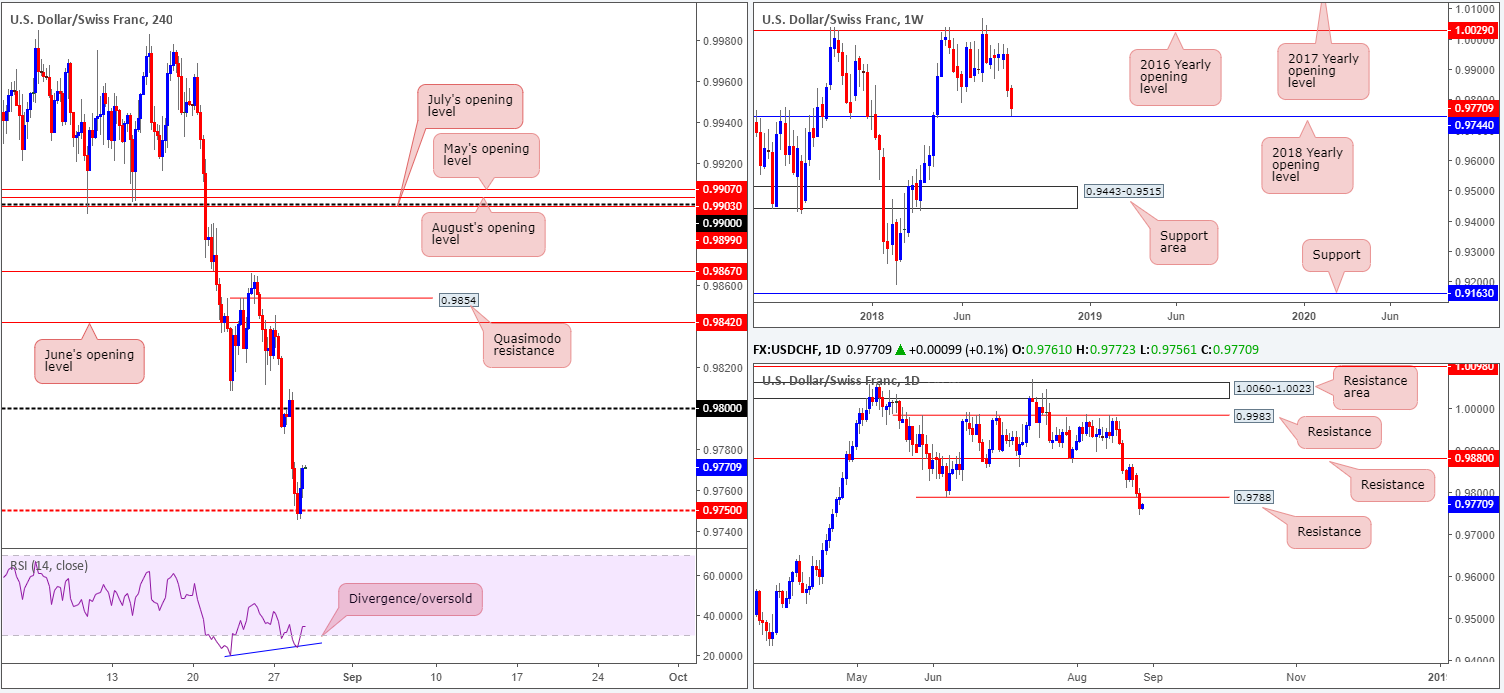
USD/CHF:
The US dollar continued to sag against its Swiss counterpart on Tuesday, registering its third consecutive daily loss. Although price action closed in the red, however, the unit did manage to establish support off the H4 mid-level number 0.9750 going into US trade, mildly paring earlier losses. Also worthy of note is the H4 RSI indicator displaying divergence out of oversold territory. Continued buying from this point has the underside of 0.98 to target on the H4 scale. Before reaching 0.98, though, traders might want to take into account 0.9788: a daily support-turned resistance.
In terms of weekly structure, the unit came within striking distance of the 2018 yearly opening level at 0.9744 yesterday. Price literally missed it by all of 2 pips before turning northbound. Upside pressure from this level could be enough to offer the US dollar some respite.
Areas of consideration:
As of now, we do not see a lot to hang our hat on. Although weekly price suggests higher prices may be in order, daily price is seen nearing resistance, which given the overall weakness of the US dollar of late, could hold price lower. Couple this with the H4 candles not really showing much in terms of confluence, opting to remain on the sidelines may be the better path to take today.
Today’s data points: US prelim GDP q/q.
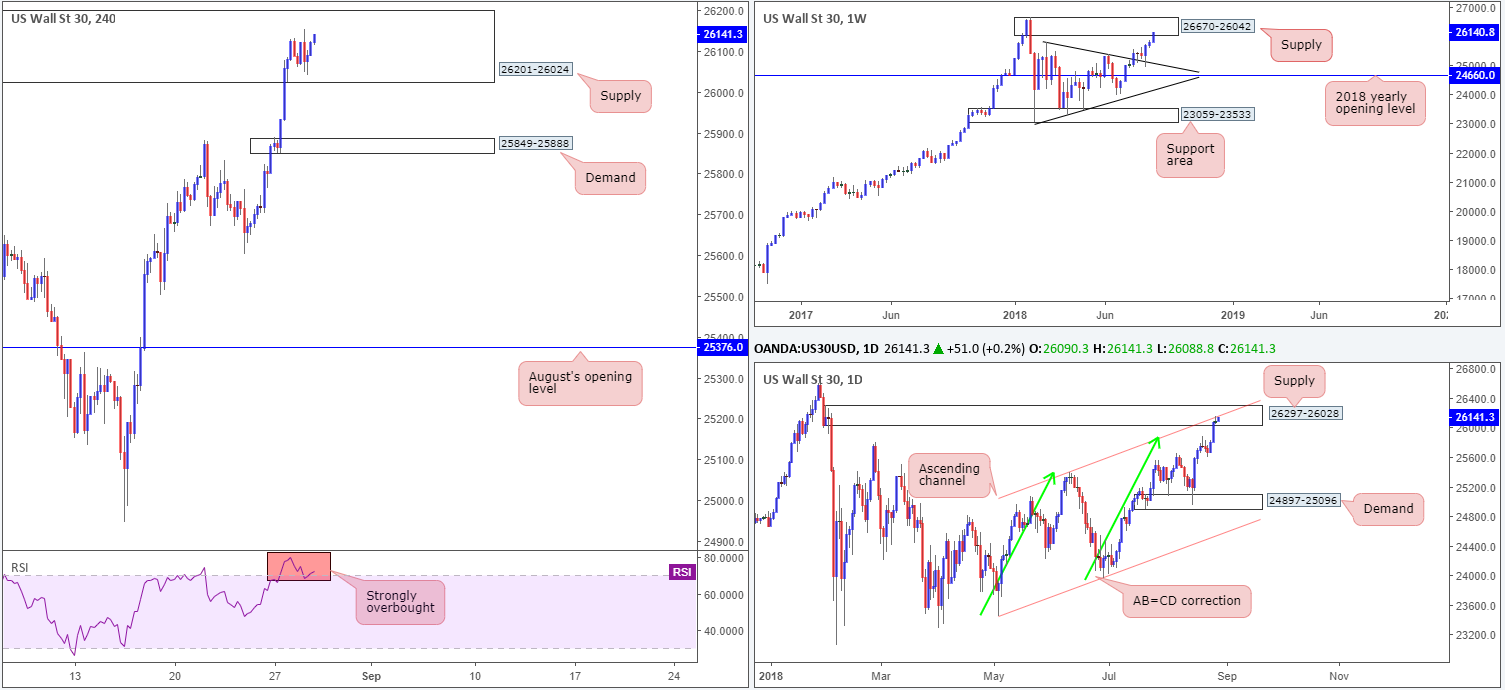
Dow Jones Industrial Average:
Despite eking out a marginal gain on Tuesday, US equities stabilized within the walls of a H4 supply zone coming in at 26201-26024. Also worth remembering is the H4 RSI is seen displaying strong overbought conditions at the moment.
In addition to the current H4 supply, weekly and daily action also exhibit strong supply in play at the moment. Weekly price recently engaged with the lower edge of a supply at 26670-26042, following a strong retest off a trend line resistance-turned support (etched from the high 25807) the week prior. In terms of the daily supply seen at 26297-26028, not only does this zone intersect with a daily channel resistance (taken from the high 25399), it is also glued to the underside of the aforesaid weekly supply area.
Areas of consideration:
In light of the strong emphasis on supply from each timeframe, a pullback, or bout of profit taking, may be on the cards today/this week.
Should traders initiate short positions within the current H4 supply, waiting for H4 candle confirmation in the shape of a full or near-full-bodied bear candle before pulling the trigger is advised. Stops can be positioned beyond the rejection candle’s wick or beyond the H4 supply area, with the first area of concern likely to reside around the H4 demand area seen at 25849-25888.
Today’s data points: US prelim GDP q/q.
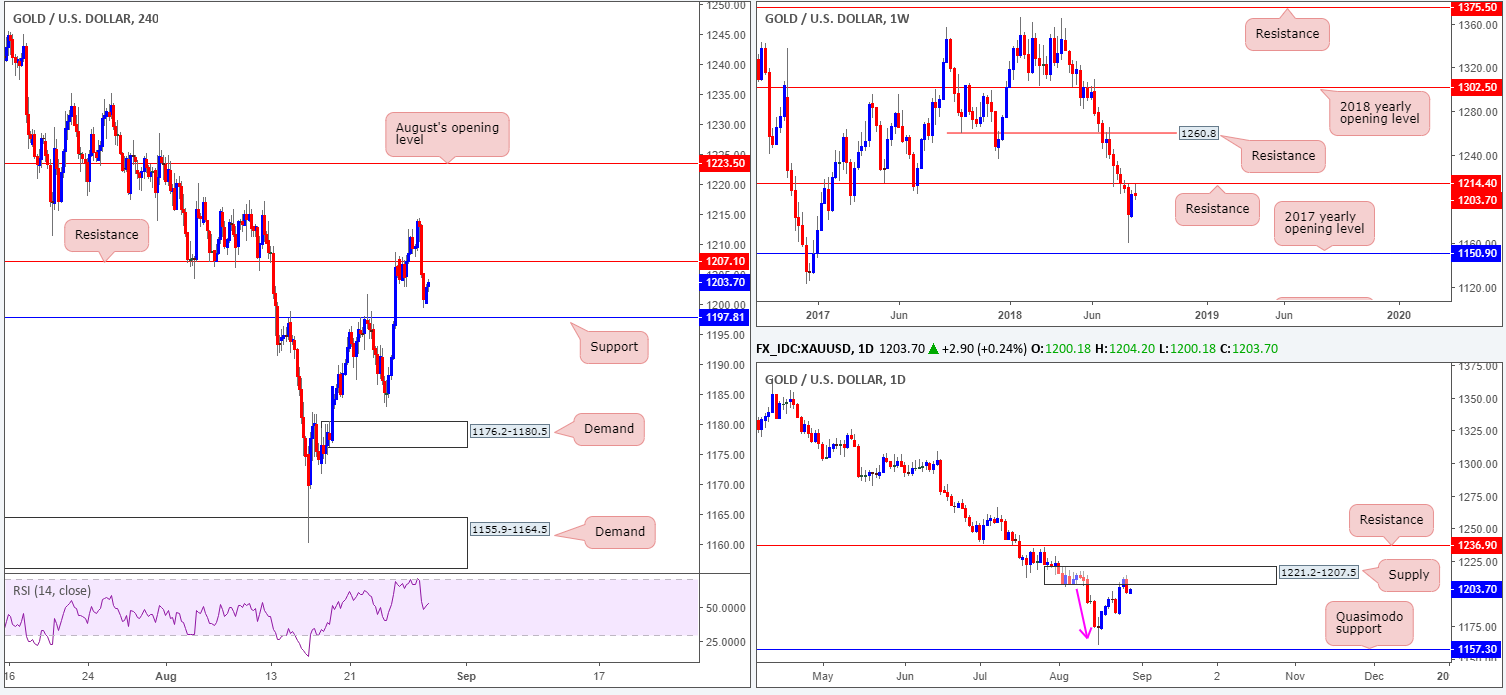
XAU/USD (Gold)
Coming in from the top this morning, weekly action recently retested the underside of resistance at 1214.4 and sold off nicely. On this timeframe, the current candlestick is portraying a reasonably nice-looking bearish pin-bar formation. Couple this with daily price trading from supply at 1221.2-1207.5 in the shape of a bearish engulfing pattern, and we have ourselves some strong sellers in the mix we believe.
Tuesday’s selloff on the H4 scale, as you can see, saw the candles retake support at 1207.1 (now acting resistance) and bottom just ahead of support coming in at 1197.8. A break of 1197.8, as the higher timeframes suggest, could lead to a move seen towards August 24 low at 1182.9, followed closely by demand at 1176.2-1180.5.
Areas of consideration:
Although the market continues to emphasize a bearish USD tone at the moment, which tends to push the price of gold higher, bullion’s higher-timeframe technical picture is pointing to further downside.
Keeping it simple this morning, shorts are appealing:
- A retest to the underside of H4 resistance at 1207.1 that holds in the shape of a reasonably solid bearish candle could be something to consider, targeting H4 support at 1197.8 as the initial take-profit zone (stop-loss orders best placed beyond the rejecting candle’s wick).
- Beneath H4 support at 1197.8. A H4 close below here follow up with a successful retest would, according to the overall picture, likely be sufficient enough to warrant shorts (stops best positioned beyond the retesting candle’s wick), targeting August 24 low at 1182.9, followed closely by H4 demand at 1176.2-1180.5.
The use of the site is agreement that the site is for informational and educational purposes only and does not constitute advice in any form in the furtherance of any trade or trading decisions.
The accuracy, completeness and timeliness of the information contained on this site cannot be guaranteed. IC Markets does not warranty, guarantee or make any representations, or assume any liability with regard to financial results based on the use of the information in the site.
News, views, opinions, recommendations and other information obtained from sources outside of www.icmarkets.com.au, used in this site are believed to be reliable, but we cannot guarantee their accuracy or completeness. All such information is subject to change at any time without notice. IC Markets assumes no responsibility for the content of any linked site. The fact that such links may exist does not indicate approval or endorsement of any material contained on any linked site.
IC Markets is not liable for any harm caused by the transmission, through accessing the services or information on this site, of a computer virus, or other computer code or programming device that might be used to access, delete, damage, disable, disrupt or otherwise impede in any manner, the operation of the site or of any user’s software, hardware, data or property.


