
Key risk events today:
Australia Inflation q/q; US Advance GDP q/q and Advance GDP Price Index q/q; US Pending Home Sales m/m; FOMC Statement, Federal Funds Rate and Press Conference.
(Previous analysis as well as outside sources – italics).
EUR/USD:
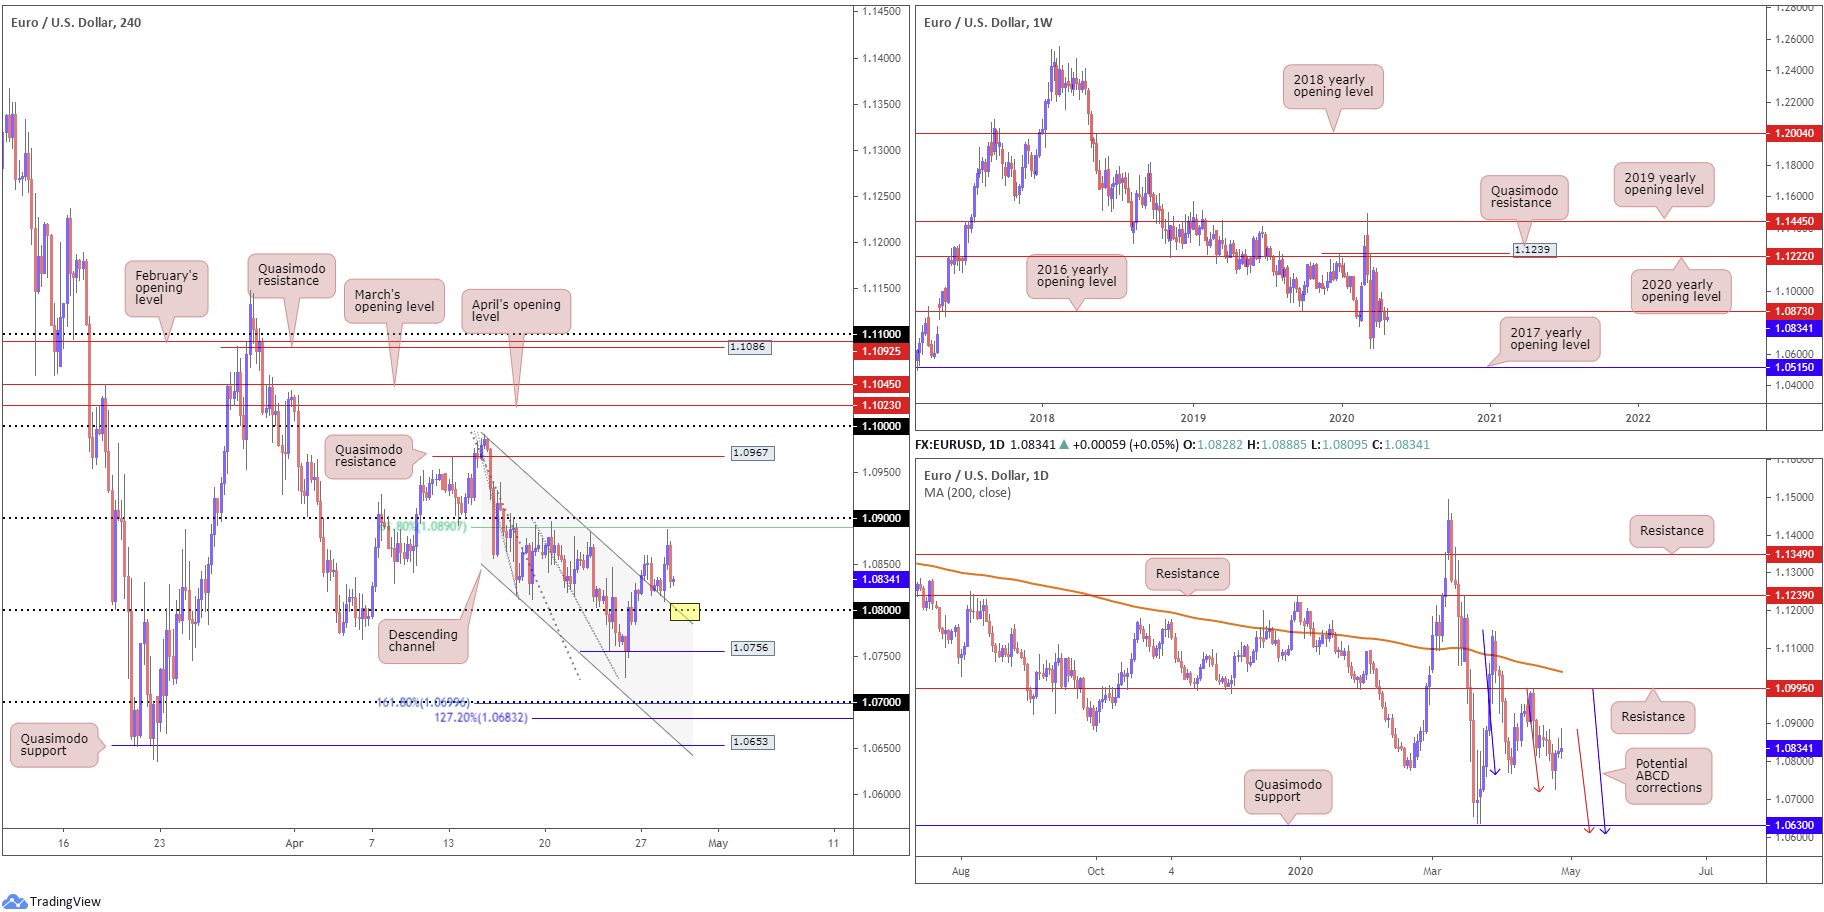
Transitioning into London hours Tuesday, we saw Europe’s single currency advance vs. the US dollar, aided by a decline in the dollar index off 100.21 and better-than-expected Spanish unemployment data. Further adding to the bullish vibe, intraday technical buyers were likely involved, rebounding from a H4 channel resistance-turned support, taken from the high 1.0990, sited just ahead of 1.08.
H4 action, as you can see, levelled off heading into US hours, a few pips ahead of a 61.8% Fibonacci retracement at 1.0890, closely shadowed by the 1.09 handle. In similar fashion to Monday, the pair reclaimed earlier gains and wrapped up the session mostly unmoved, with eyes back on 1.08.
Further afield, weekly price took hold of the 2016 yearly opening level at 1.0873 and has so far held ground as potential resistance. Multi-year lows at 1.0635 are in view as viable support from here, with follow-through moves shining the spotlight on the 2017 yearly opening level at 1.0515.
The daily timeframe still demonstrates the possibility of further downside, targeting Quasimodo support at 1.0630, closely followed by two potential ABCD corrections (blue/red arrows) at 1.0597ish.
Areas of consideration:
The point at which 1.08 and the H4 channel resistance-turned support intersect (yellow) may be on the radar today for an intraday reaction. Failure to hold, however, could spark intraday selling towards H4 Quasimodo support at 1.0756 and, with a little oomph, towards support at 1.07 which merges closely with a 161.8% Fibonacci extension at 1.0699 and a 127.2% Fibonacci extension at 1.0683.
Traders are urged to tread cautiously concerning longs in this market right now. Not only do we remain entrenched within a downtrend, we’re also coming off the underside of the 2016 yearly opening level at 1.0873 on the weekly timeframe as resistance.
GBP/USD:
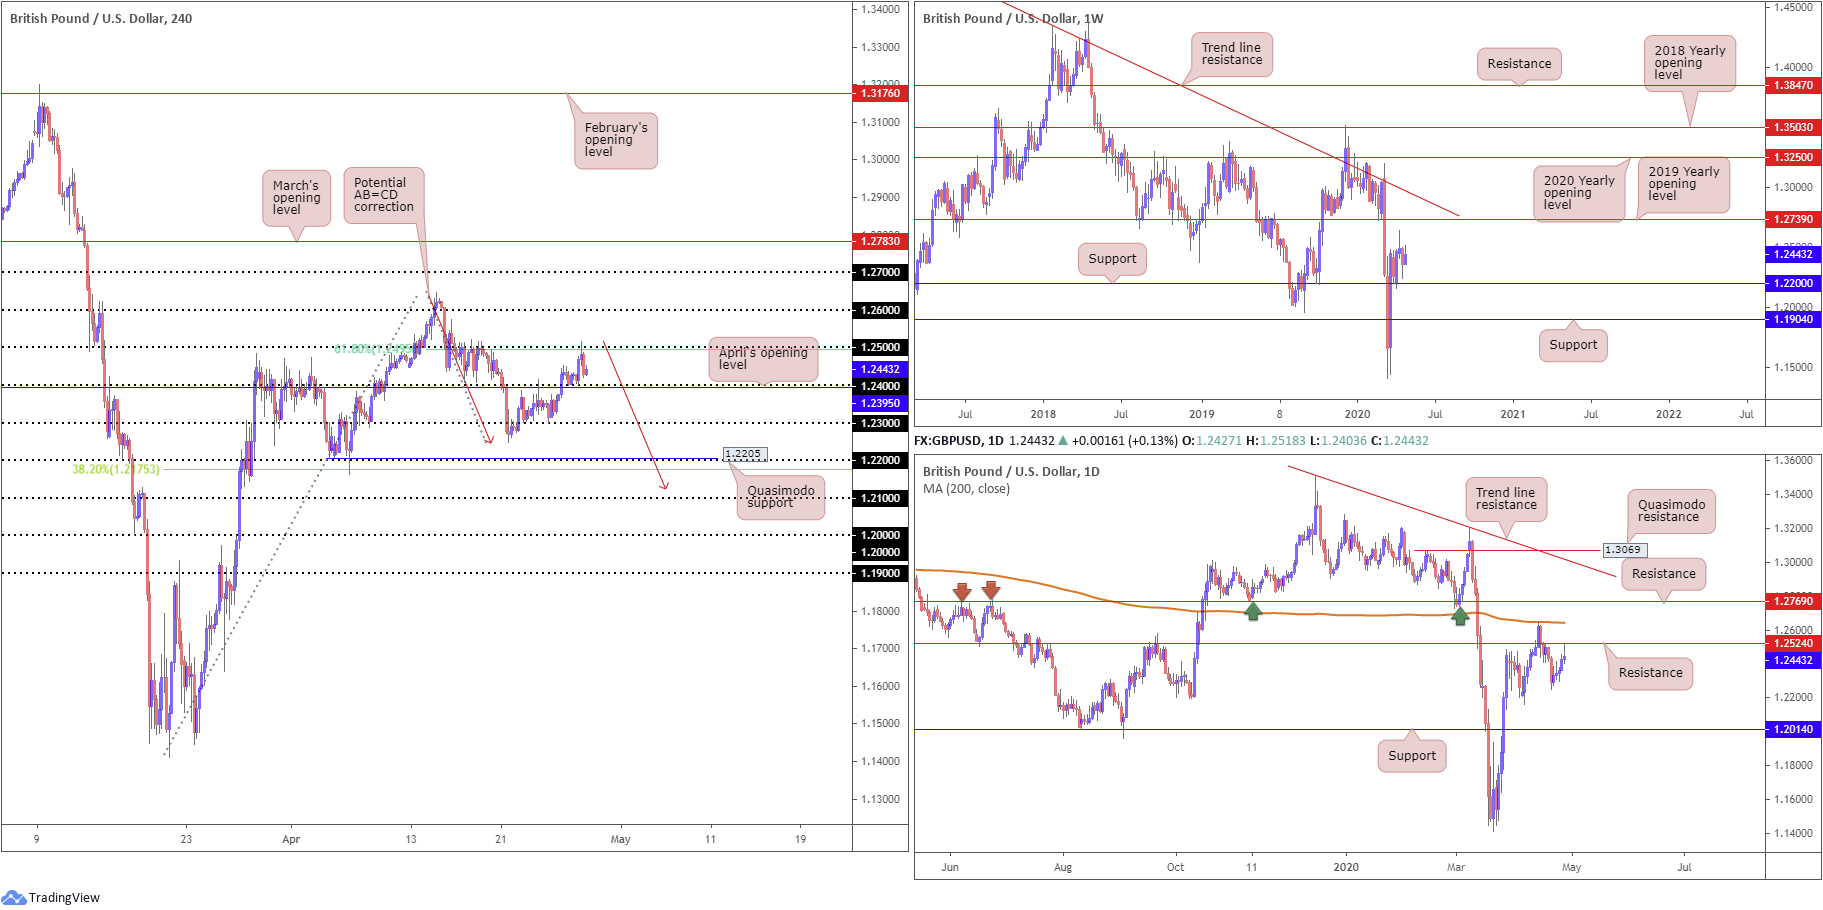
Following a near-to-the-pip retest at 1.24 Monday, Tuesday, heading into London, gathered traction and eventually touched gloves with 1.25, a familiar resistance that not only capped upside on a number of occasions in mid-April but also comes together with a 61.8% Fibonacci retracement at 1.2495. The retreat from 1.25 has landed the H4 candles back within striking distance of 1.24, aligning closely with April’s opening level at 1.2395. Continued downside from here could eventually form the D-leg to an AB=CD bullish correction (red arrows), which, as of current structure, terminates around the 1.2123ish neighbourhood.
Meanwhile, on the bigger picture, the weekly timeframe has support plotted at 1.2200. Elbowing through the 1.2647 April 14 high, nevertheless, could land the candles within striking distance of the 2019 yearly opening level at 1.2739, with a break exposing a long-standing trend line resistance, taken from the high 1.5930.
Over on the daily timeframe, yesterday’s candle climbed to highs of 1.2518, missing resistance by six pips at 1.2524. As support/resistance levels are often viewed as zones rather than definitive price points, sellers have already potentially jumped on board here.
Areas of consideration:
Entering long from 1.24 may unsettle some traders, knowing we’re coming from daily resistance.
To confirm downside pressure in this market, though, tunnelling through the 1.24 handle on the H4 timeframe is likely required. This perhaps paves the way south to 1.23 and offers intraday sellers an opportunity to engage.
The daily head and shoulder’s top would likely become a feature following a H4 close south of 1.23, breaking the pattern’s neckline (not yet applied to the chart).
AUD/USD:
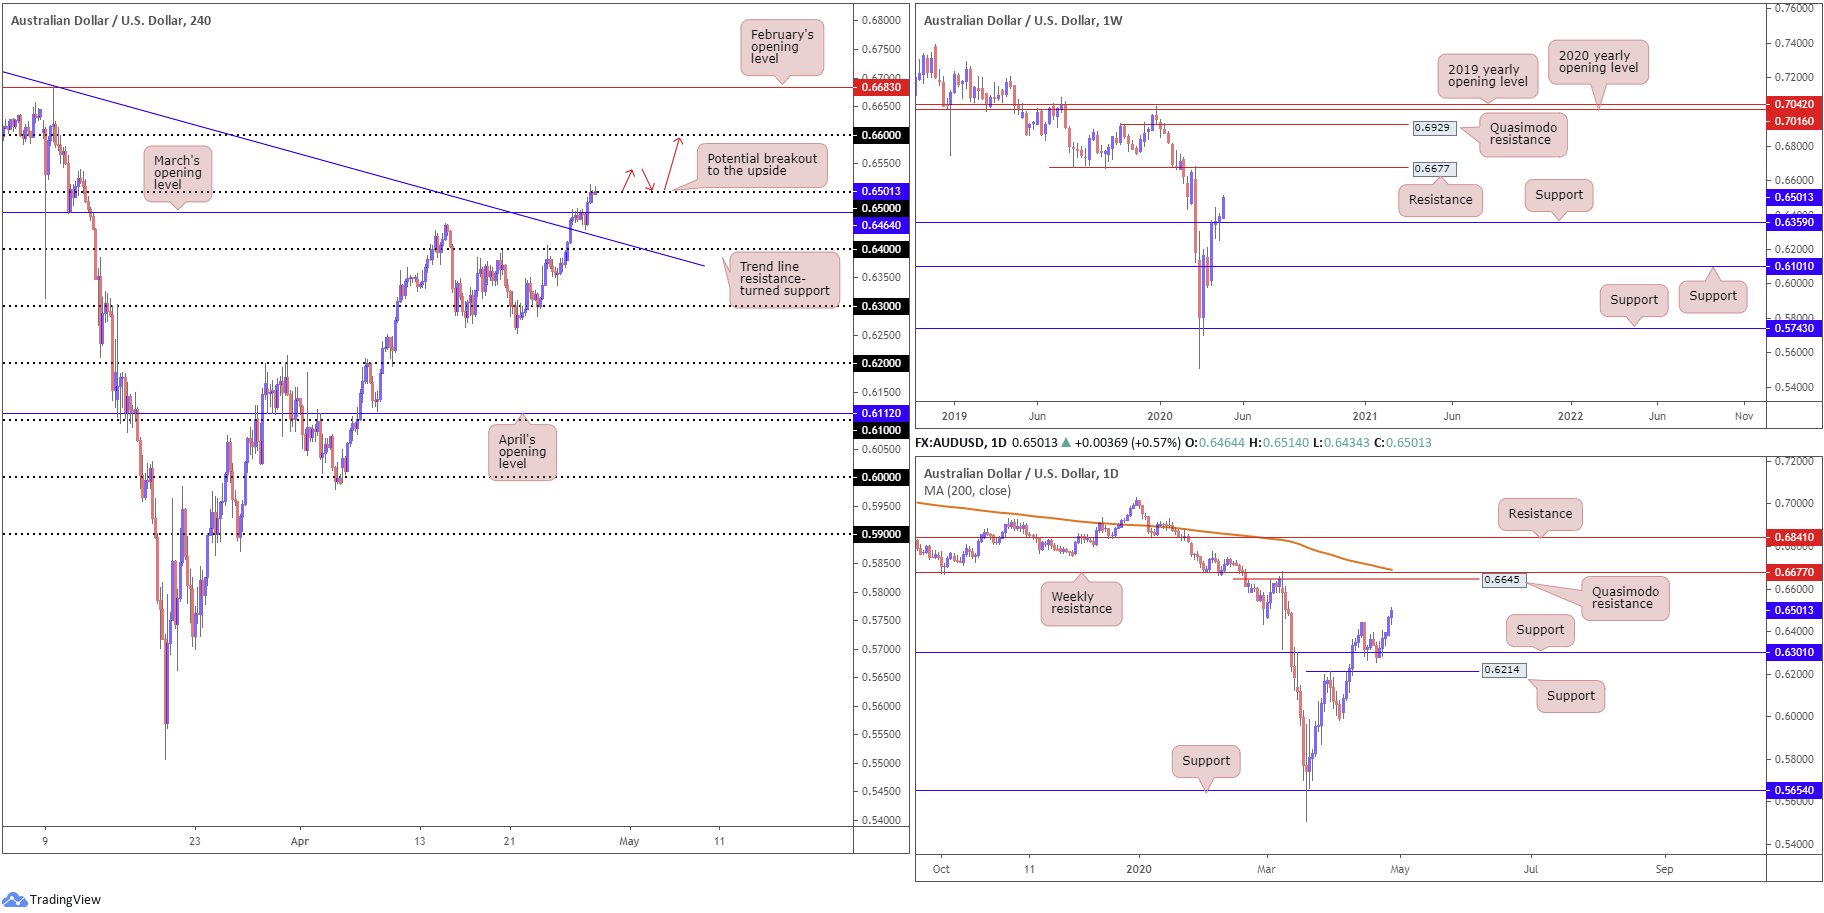
AUD/USD extended recovery gains Tuesday, adding more than 30 points, or 0.50%. The US dollar index sliding beneath its 100.00 handle along with upbeat market sentiment appears to have been the main drivers behind yesterday’s advance.
Technicians based on the H4 timeframe will note we eventually dethroned March’s opening level at 0.6464 and crossed swords with the 0.65 handle. As of recent movement, sellers have yet to demonstrate much in the way of meaning to the downside from here, therefore threatening the possibility of additional moves higher today.
Weekly support is seen at 0.6359 and remains a dominant fixture in this market, with scope to approach resistance based at 0.6677. Similarly, daily action remains on firm footing north of support at 0.6301, also displaying room to navigate higher ground to at least Quasimodo resistance at 0.6645, parked just ahead of the weekly resistance level mentioned above at 0.6677 and the 200-day SMA (orange – 0.6690).
Areas of consideration:
Having identified clear-cut higher-timeframe support in play, with room to climb, selling the 0.65 handle on the H4 timeframe may understandably unnerve some traders. While a H4 close above 0.65 is expected, traders are still urged to pencil in the possibility of a retest forming at March’s opening level from 0.6464 before buyers step in.
Conservative traders are also unlikely to avoid entering long based on a H4 candle close above 0.65; most will seek a retest off 0.65 as support before pulling the trigger.
USD/JPY:
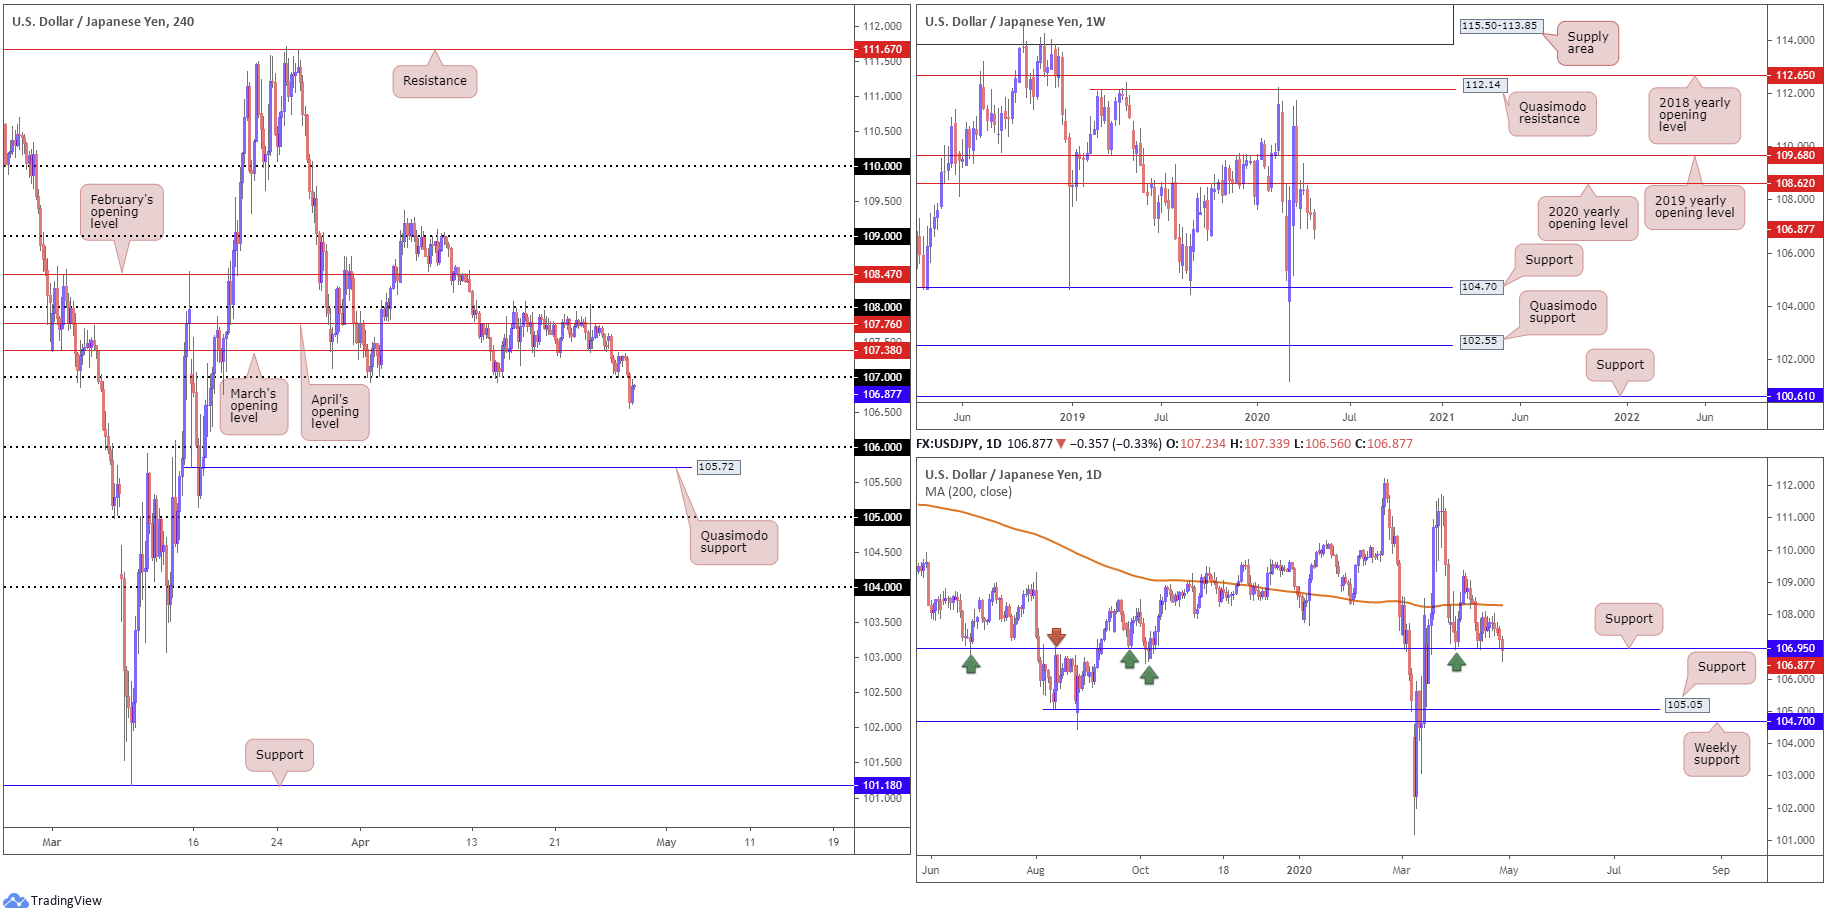
Registering its fifth consecutive daily loss Tuesday had the H4 candles overrun 107 in dominant fashion, scoring lows at 106.56 and potentially clearing the river south to 106 and a nearby Quasimodo support at 105.72. As of current price, we are poised to retest 107 as potential resistance.
Should we retest 107 and hold, preferably in the shape of a bearish candlestick configuration, this suggests daily support at 106.95 may be fragile. South of 106.95 could see an approach form to support at 105.05. In terms of the weekly timeframe, nevertheless, the chart continues to emphasise a bearish tone. Price action recently produced a clear-cut shooting star candlestick configuration off the 2020 yearly opening level at 108.62, with a strong follow-through move to the downside to lows of 106.92 seen thereafter. This week, as you can see, is extending space sub 108.62, with support not expected to emerge until reaching 104.70.
Areas of consideration:
Having noted room to explore lower ground on the weekly chart, and daily support at 106.95 offering little when it comes to bullish intent, a retest at the underside of 107 on the H4 timeframe may offer sellers a platform to drive lower today. Downside targets from 107 fall in at 106 and then H4 Quasimodo support at 105.72.
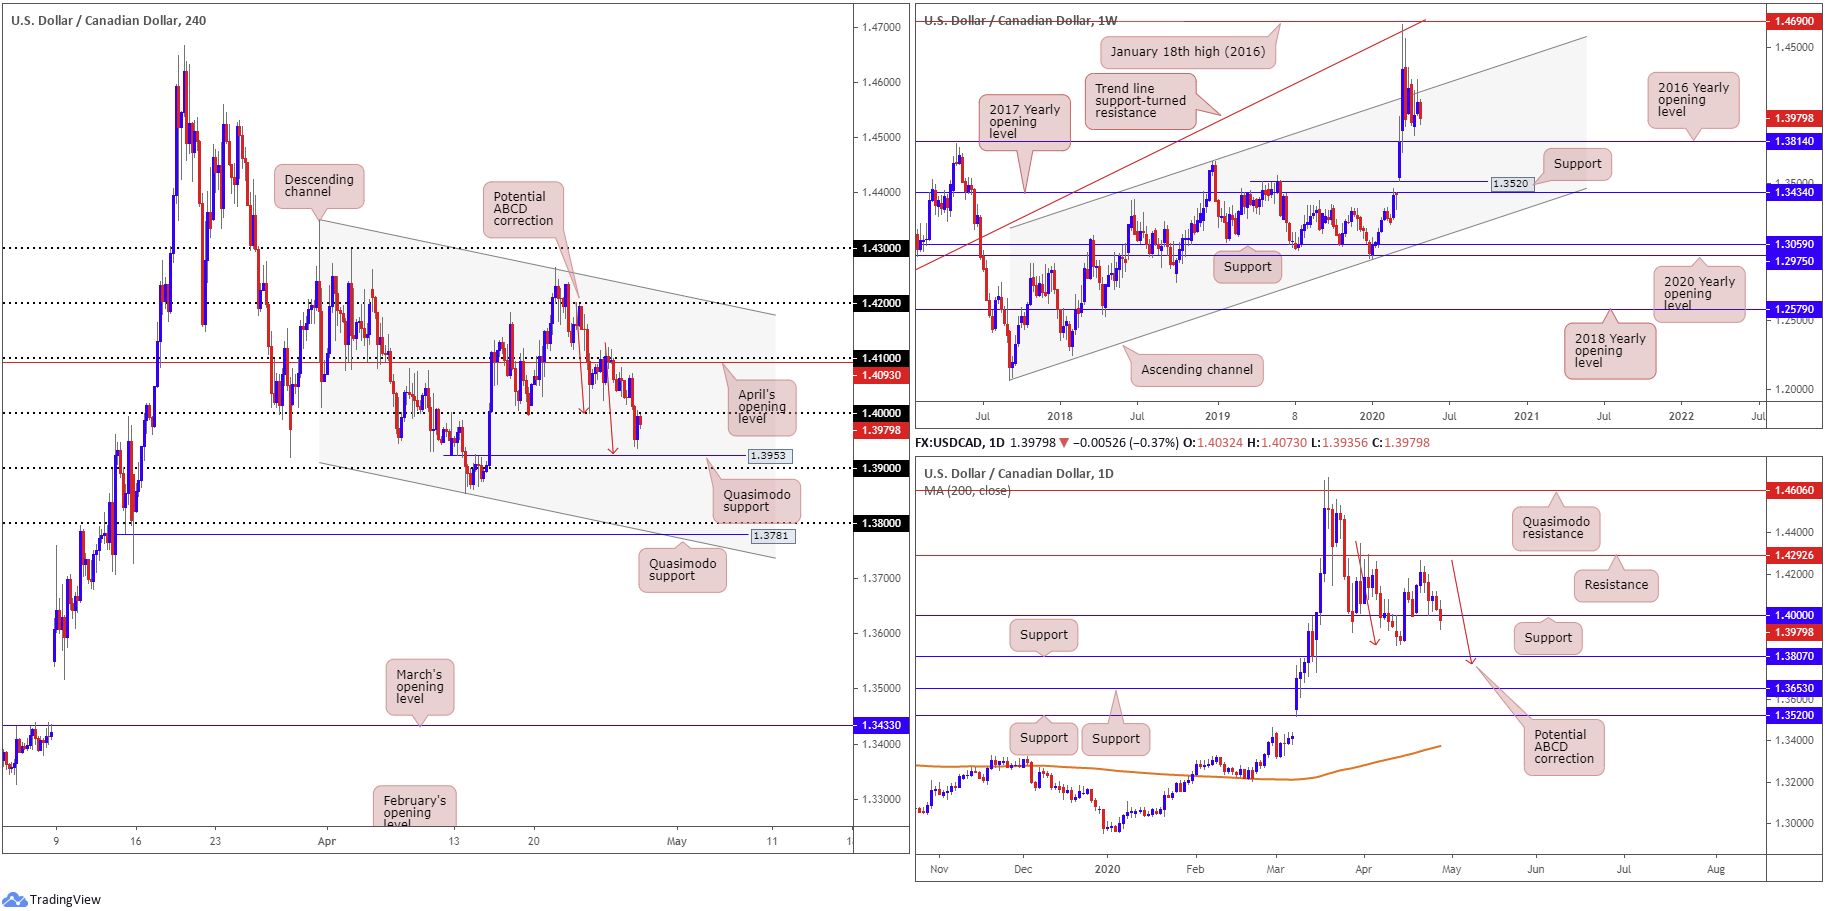
USD/CAD:
In recent sessions, the US dollar gave up half a percent against the Canadian dollar, consequently extending Monday’s downside move off 1.4117. WTI prices slumped to lows just ahead of $10.00/bbl, though pencilled in a recovery phase into US hours. In addition to this, the US dollar index cranked through 100.00, engaging with lows at 99.45.
From the H4 timeframe, we can see price action engulfed the key figure 1.40 to the downside in strong fashion, uncovering Quasimodo support at 1.3953 and 1.39. Note we also see a potential ABCD bullish correction (red arrows) aligning closely with the current Quasimodo support.
Elsewhere, on the weekly timeframe longer-term traders will note the unit recently crossed swords with channel resistance, extended from the high 1.3661. The retest, shaped by way of a shooting star candlestick pattern, along with recent downside, could be sufficient to entice moves back to 1.3814, the 2016 yearly opening level.
From the daily timeframe, support at 1.4000 was recently overrun, perhaps shifting the spotlight to the 1.3855 April 13 low and support coming in at 1.3807.
Areas of consideration:
For those who read Tuesday’s technical briefing you may recall the following pieces (italics):
Clearly weekly sellers remain in the driving seat at the moment.
1.40 may see buyers attempt to make a show, given the number also signifies daily support. However, with weekly price pointing to lower levels, a break beneath 1.40 is equally likely.
Breaking 1.40 to the downside may be interpreted as a bearish signal, with scope to approach H4 Quasimodo support at 1.3953 as an initial target. Conservative traders, of course, may opt to wait for a retest at 1.40 before committing.
1.40 is, as we write, being retested as resistance, therefore may entice additional selling into the market today, owing to higher-timeframe action pointing to lower levels. Downside targets can be seen at 1.39, which joins closely with a H4 Quasimodo support at 1.3953 and ABCD correction.
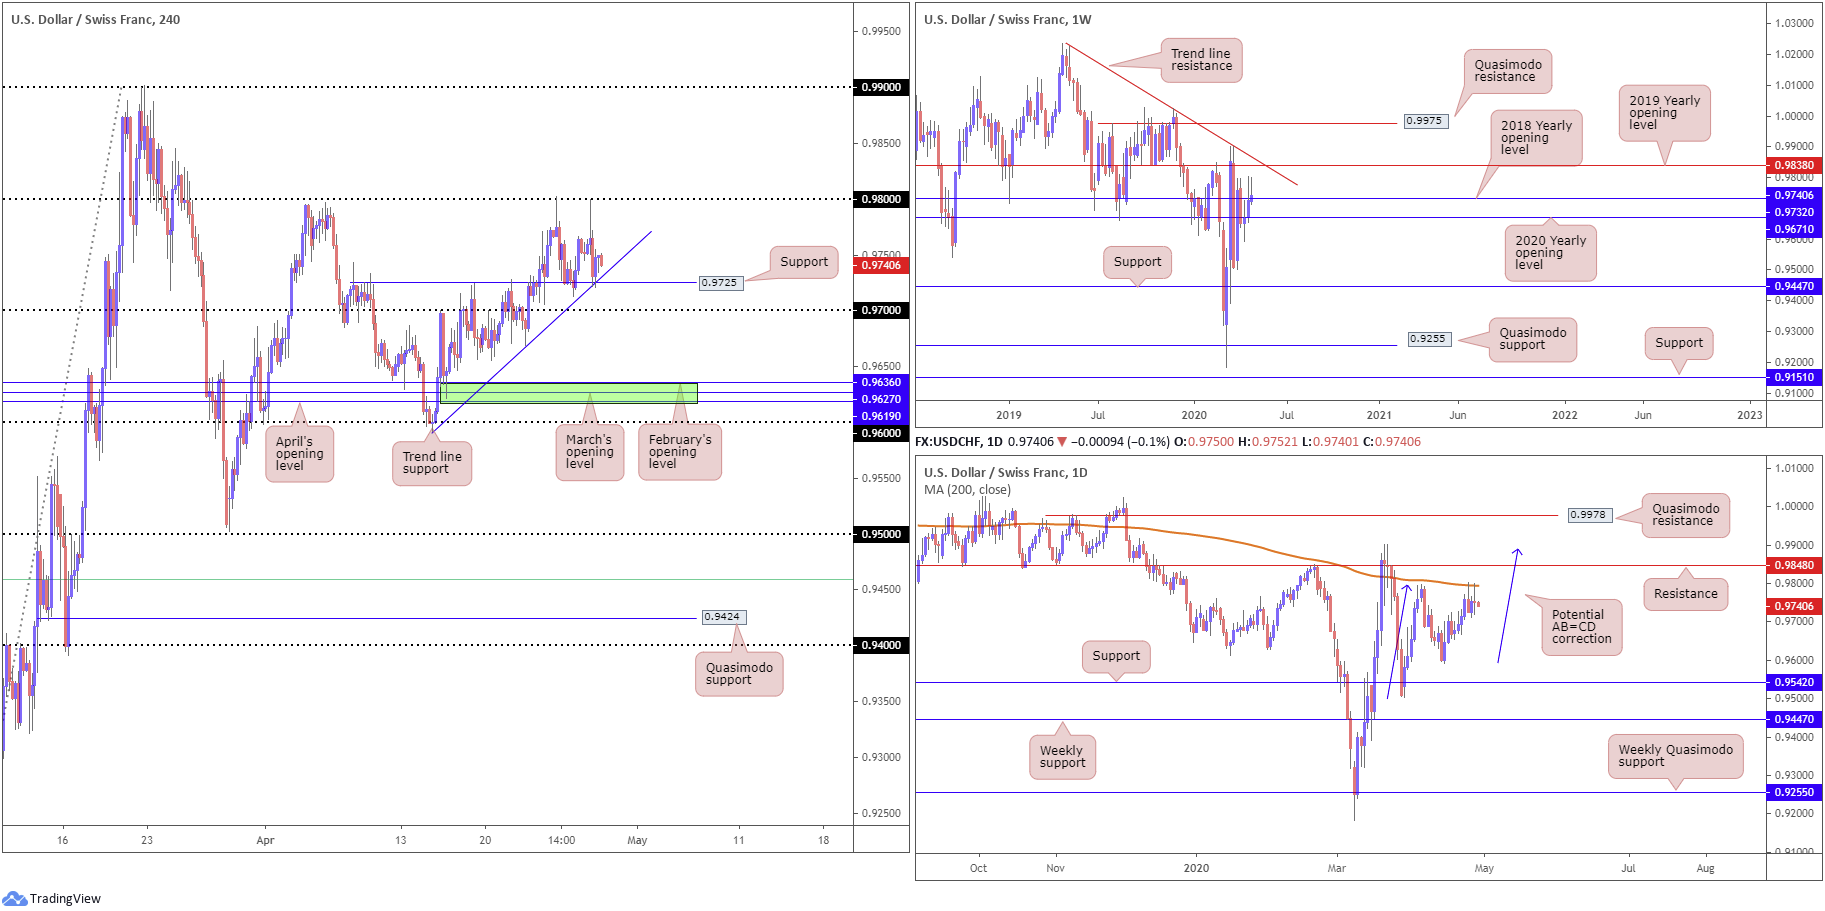
USD/CHF:
USD/CHF failed to capitalise on Monday’s modest recovery, capped by the 0.98 handle and 200-day SMA (orange – 0.9794). Broad-based USD selling weighed on the pair, though downside was limited on the back of upbeat market sentiment, which likely helped H4 support at 0.9725 and the intersecting trend line support, taken from the low 0.9592, hold ground.
Meanwhile, on the weekly timeframe, current action is attempting to make headway above the 2018 yearly opening level at 0.9732. The move higher has unmasked the 2019 yearly opening level at 0.9838 and trend line resistance, taken from the high 1.0226, but is struggling to reach the said levels.
Price action on the daily timeframe, however, shows Tuesday launched itself into the 200-day SMA (orange – 0.9794) in the same manner as Friday, finishing the session by way of a doji indecision candle. Despite the recent rejection, traders are urged to pencil in resistance at 0.9848 and a potential AB=CD correction (blue arrows) at 0.9886 in case of moves higher. Lower on the curve, aside from the 0.9592 April 15 low, we have support priced in at 0.9542, situated just ahead of weekly support at 0.9447.
Areas of consideration:
Buyers off the H4 support level at 0.9725 may be hindered by the 200-day SMA at 0.9794 as well as weekly price struggling to hold above 0.9732.
This may lead to price clearing 0.9725 and 0.97 coming under fire. A break of 0.97 would be interesting. This could unlock the door for bearish scenarios as beneath this base we see limited demand until reaching 0.9619/0.9636 (green), an area made up of April, March and February’s opening levels.
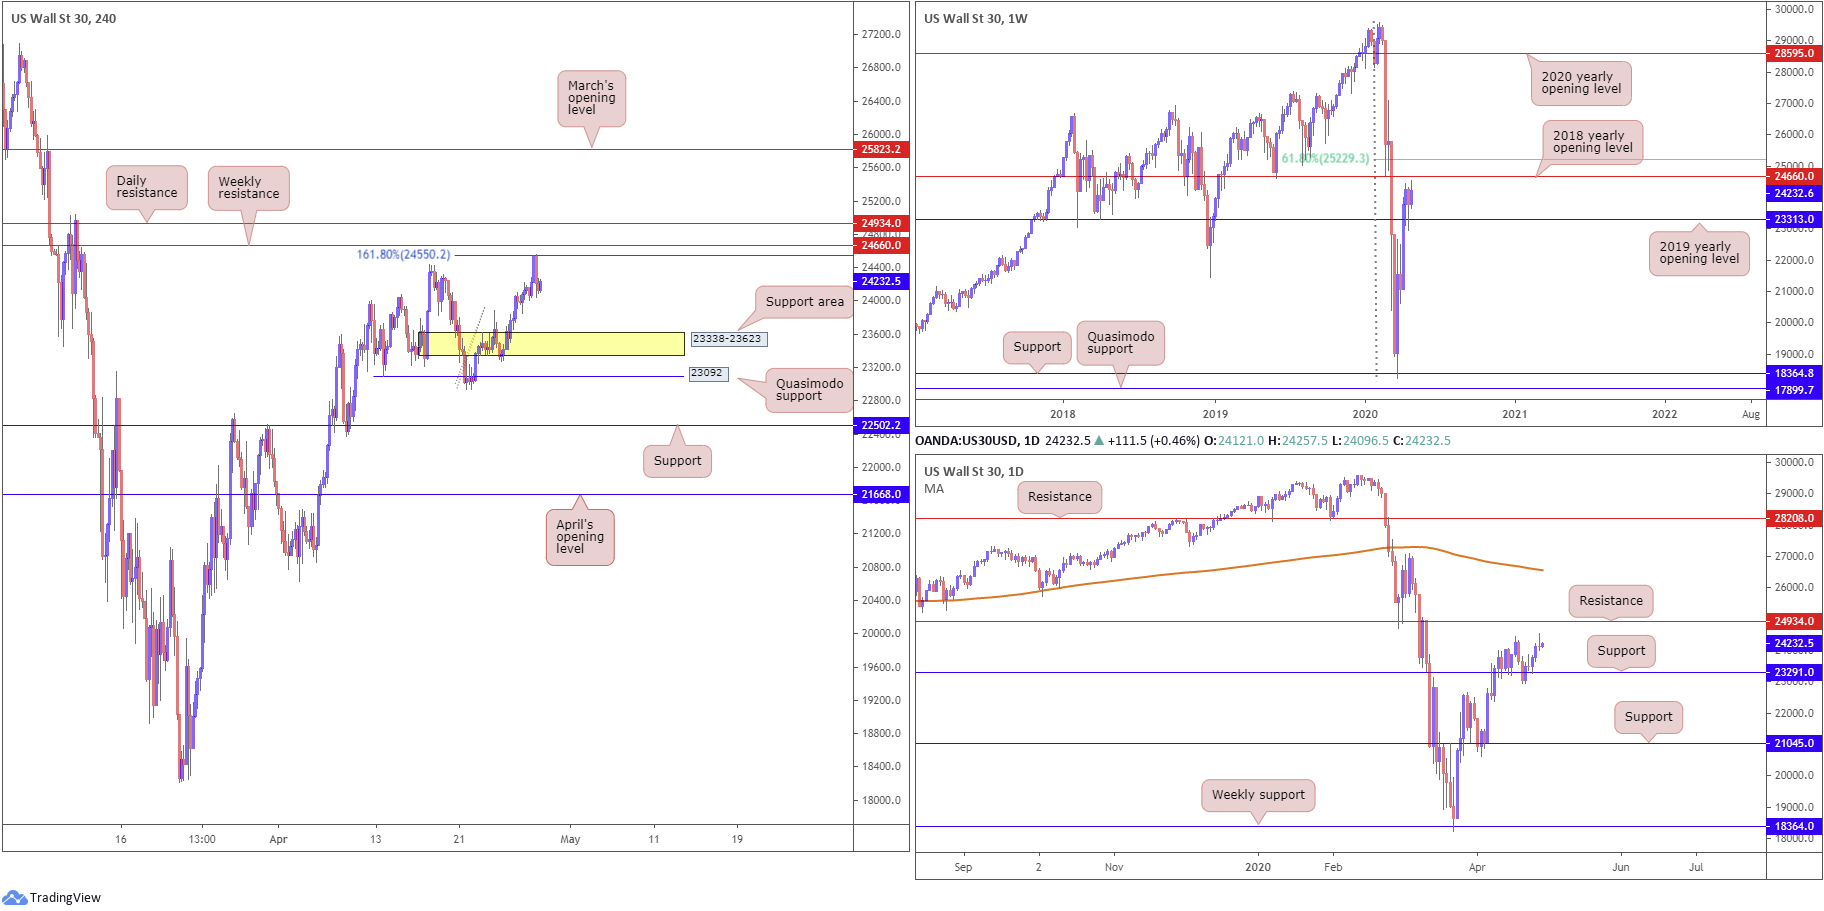
Dow Jones Industrial Average:
US equities wrapped up Tuesday lower across the board as investors digested moves to reopen the economy in the coming weeks. The Dow Jones Industrial Average erased 32.33 points, or 0.13%; the S&P 500 lost 15.09 points, or 0.52%, and the tech-heavy Nasdaq 100 concluded lower by 160.06 points, or 1.81%.
On the technical front, H4 price shook hands with a 161.8% Fibonacci extension level at 24550 yesterday, a level located just south of weekly resistance at 24660 (the 2018 yearly opening level) and daily resistance coming in from 24934. The response from 24550 has likely stoked interest, with the possibility of extending losses to a H4 support area seen at 23338-23623 and H4 Quasimodo support at 23092. What’s also notable from a technical view is daily support at 23291 and weekly support at 23313 (the 2019 yearly opening level) resides in between the two aforesaid H4 support areas.
Areas of consideration:
While there is a chance we could experience further downside off the 161.8% Fibonacci extension at 24550, active sellers likely reside at the higher-timeframe resistances mentioned above in bold. Therefore, a move higher to bring in the said levels before pushing lower should not come as a surprise. So, between 24934/24660 offers a tight reversal zone today.
As for support zones, traders may find the area between H4 Quasimodo support at 23092 and 23338-23623 of interest, given daily and weekly support inhabiting this region at 23291 and 23313, respectively.
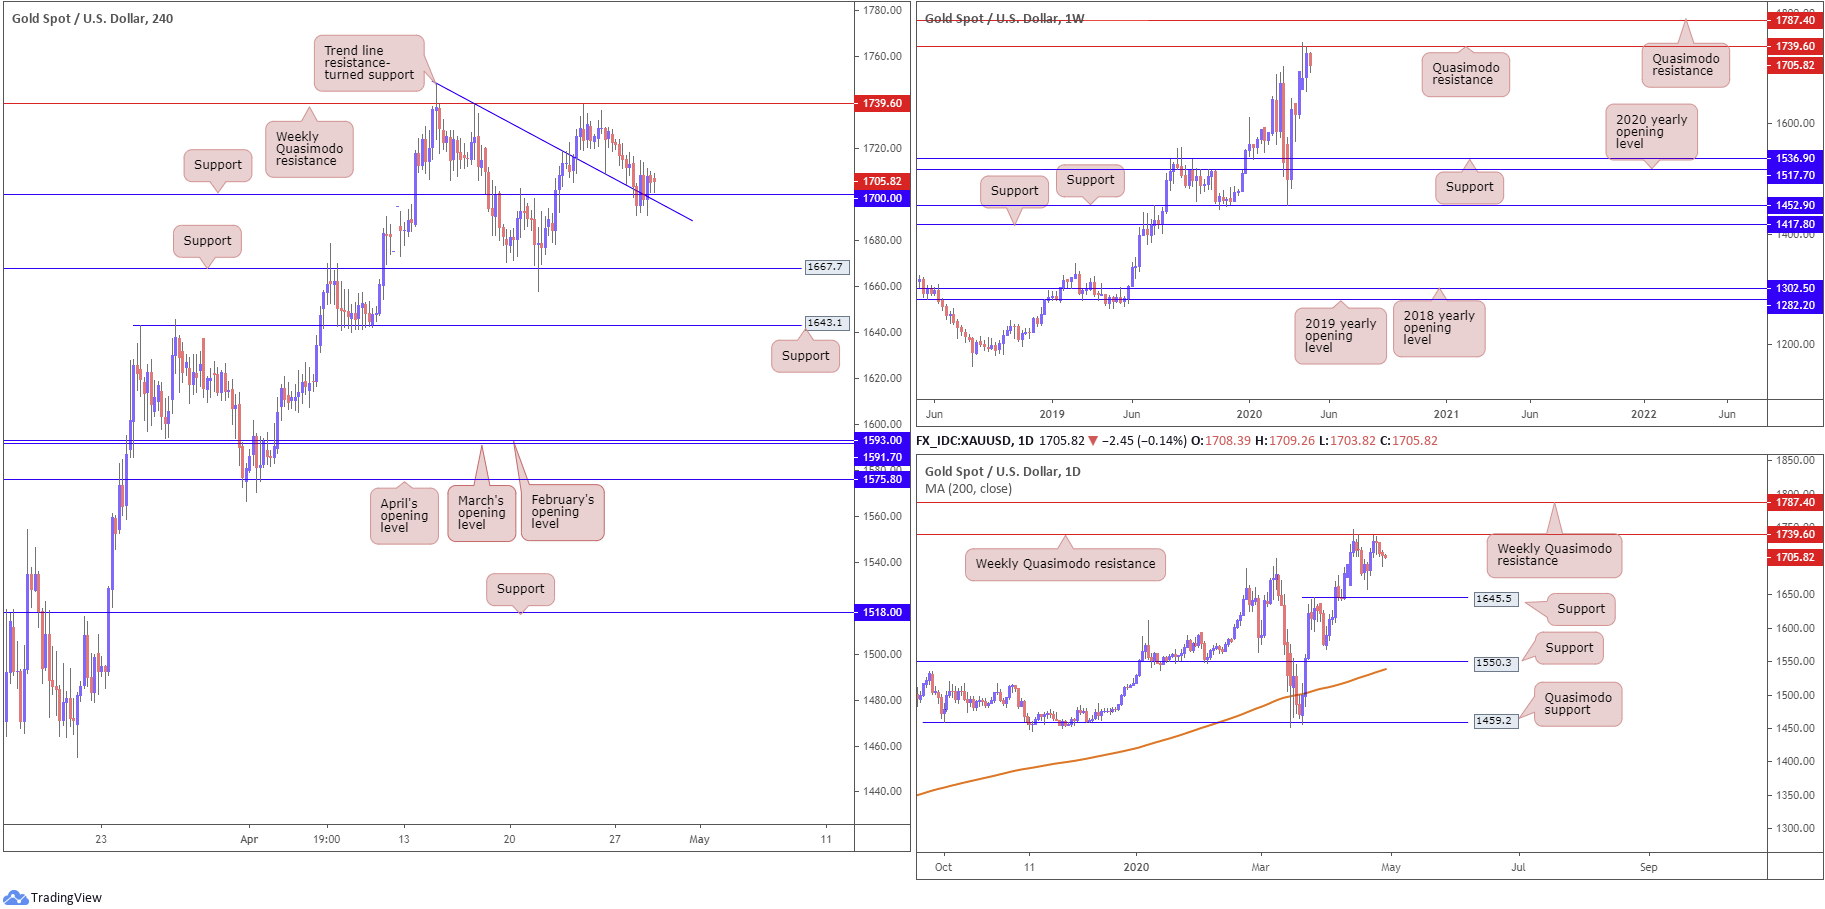
XAU/USD (GOLD):
Over the course of Tuesday’s movement, the price of gold, in $ terms, experienced a mild decline, wrapping up on the backfoot for a third straight session.
In recent hours, XAU/USD boarded support on the H4 timeframe at 1700.0, which joins closely with a trend line resistance-turned support, taken from the high 1747.7. Any upside off the said support is currently capped by 1708.6 – not really what buyers want to see. This could have something to do with the fact we recently crossed swords with a weekly Quasimodo resistance at 1739.6.
Clearing the current H4 support may see price tunnel towards support at 1667.7 and 1643.1. From the daily timeframe, we can see that the reaction off the weekly Quasimodo resistance mentioned above at 1739.6 has daily support at 1645.5 to target. Should price conquer the said weekly Quasimodo, however, focus will likely rest on another layer of weekly Quasimodo resistance coming in at 1787.4.
Areas of consideration:
With H4 support recently coming under fire and buyers so far failing to step up, the pendulum looks to be swinging in favour of further selling today. As a result, any H4 close seen sub 1700.0 may be interpreted as a bearish signal, with technical eyes focused on H4 support at 1667.7 as the initial target, followed by daily support at 1645.5 and then H4 support at 1643.1.
The accuracy, completeness and timeliness of the information contained on this site cannot be guaranteed. IC Markets does not warranty, guarantee or make any representations, or assume any liability regarding financial results based on the use of the information in the site.
News, views, opinions, recommendations and other information obtained from sources outside of www.icmarkets.com.au, used in this site are believed to be reliable, but we cannot guarantee their accuracy or completeness. All such information is subject to change at any time without notice. IC Markets assumes no responsibility for the content of any linked site.
The fact that such links may exist does not indicate approval or endorsement of any material contained on any linked site. IC Markets is not liable for any harm caused by the transmission, through accessing the services or information on this site, of a computer virus, or other computer code or programming device that might be used to access, delete, damage, disable, disrupt or otherwise impede in any manner, the operation of the site or of any user’s software, hardware, data or property.


