
Key risk events today:
ECB President Lagarde Speaks.
Previous analysis as well as outside sources is denoted by way of italics.
EUR/USD:
Following Monday’s indecisive wrap, the euro, as a function of a softer buck, held onto a healthy bid Tuesday, adding more than 0.7% by the close.
On the data front, US consumer confidence ticked up from a previously revised 85.7 (prev. 86.9) to 86.6, albeit missing consensus for a rise to 87.1.
The Conference Board noted:
The Conference Board Consumer Confidence Index held steady in May, following a sharp decline in April. The Index now stands at 86.6 (1985=100), up from 85.7 in April. The Present Situation Index – based on consumers’ assessment of current business and labour market conditions – declined from 73.0 to 71.1. However, the Expectations Index – based on consumers’ short-term outlook for income, business and labour market conditions – improved from 94.3 in April to 96.9 this month.
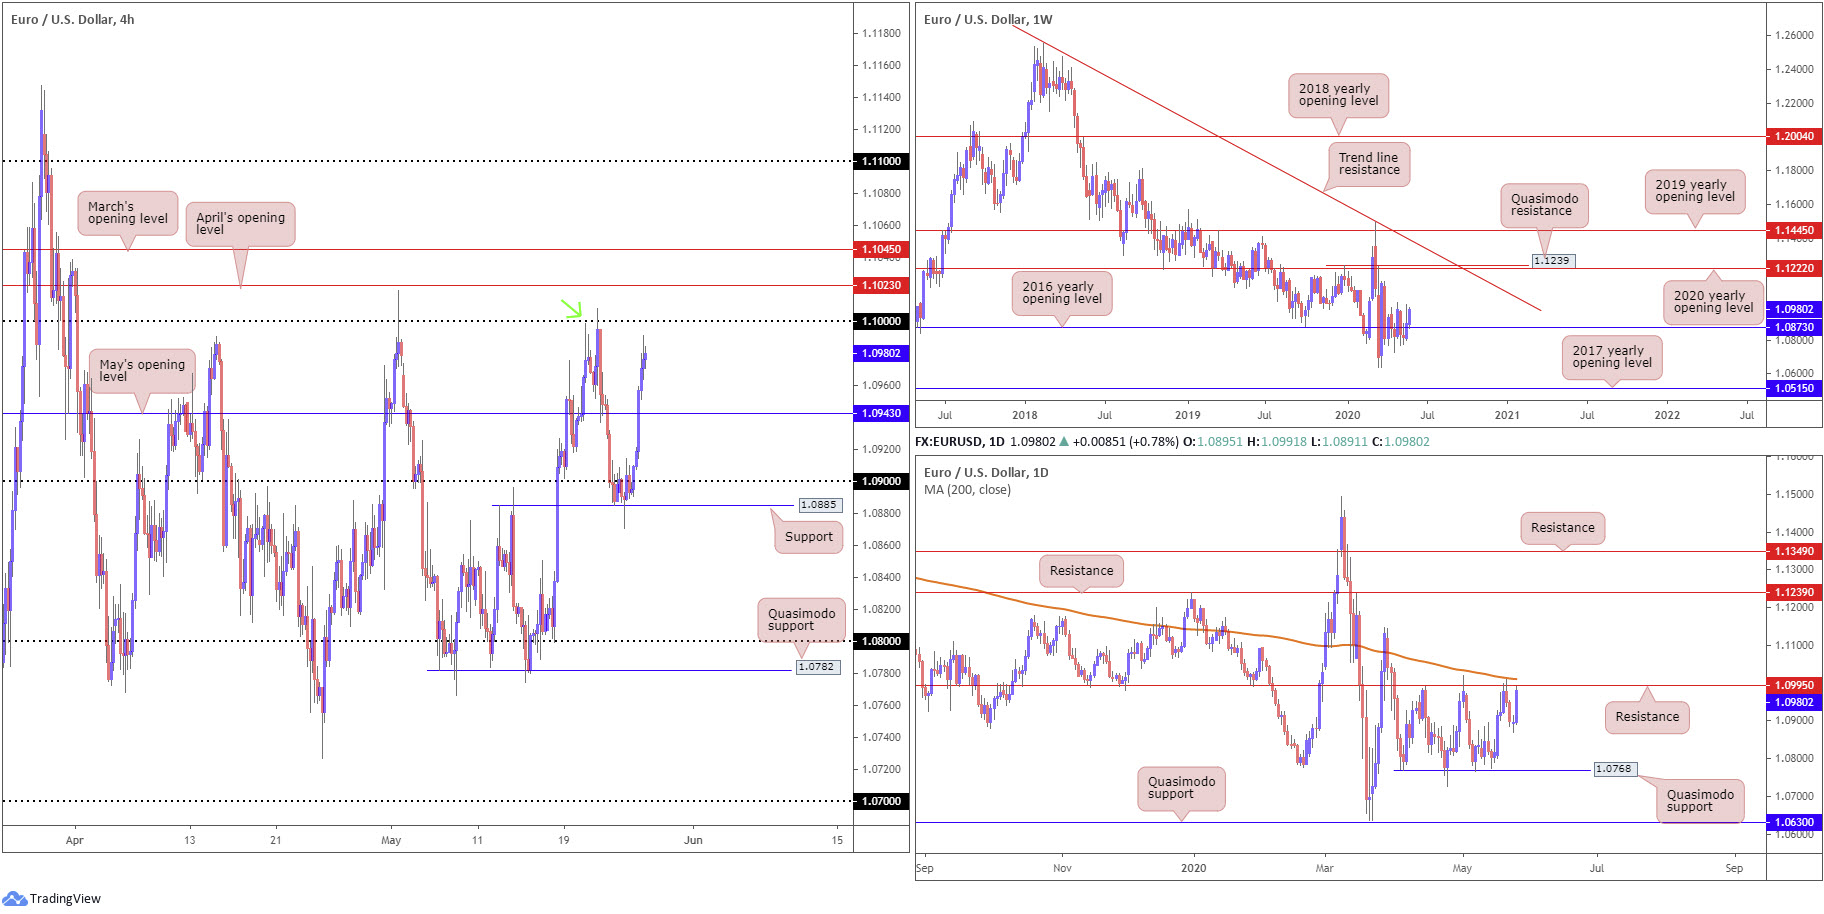
With the US dollar index travelling through 99.50 and touching gloves with 99.00, EUR/USD H4 price is seen seeking additional bidders for a push to nearby 1.10, a key figure widely watched in this market. Also appealing at 1.10 is Quasimodo resistance (green arrow). Above the round number, traders face April’s opening level at 1.1023 and March’s opening level at 1.1045, while to the downside support rests at May’s opening level from 1.0943.
Further afield, weekly price is showing some enthusiasm north of the 2016 yearly opening level at 1.0873. Major resistance is not expected to show itself until the 2020 yearly opening level at 1.1222, closely followed by Quasimodo resistance at 1.1239. A bump lower from here, on the other hand, could face multi-year lows at 1.0635. With respect to the long-term trend, the pair has remained under weight since topping in early 2018.
Daily resistance at 1.0995, placed nearby the 200-day SMA (orange – 1.1010), is in sight, thanks to yesterday’s vigorous advance. Above, we do not really see much to get excited about until reaching resistance at 1.1239 (essentially the same base as weekly QM); downside, however, may eventually collide with Quasimodo support at 1.0768.
Areas of consideration:
Technical elements support a rejection from the 1.10 region; it joins with a H4 Quasimodo resistance level and comes with a daily resistance base at 1.0995, along with the 200-day SMA at 1.1010. Although sufficient to hamper upside, traders are urged to pencil in the possibility of a fakeout to April’s opening level at 1.1023 before sellers step in.
Conservative sellers from 1.10 may favour positioning protective stop-loss orders above March’s opening level at 1.1045, with an initial take-profit target fixed at May’s opening level from 1.0943.
GBP/USD:
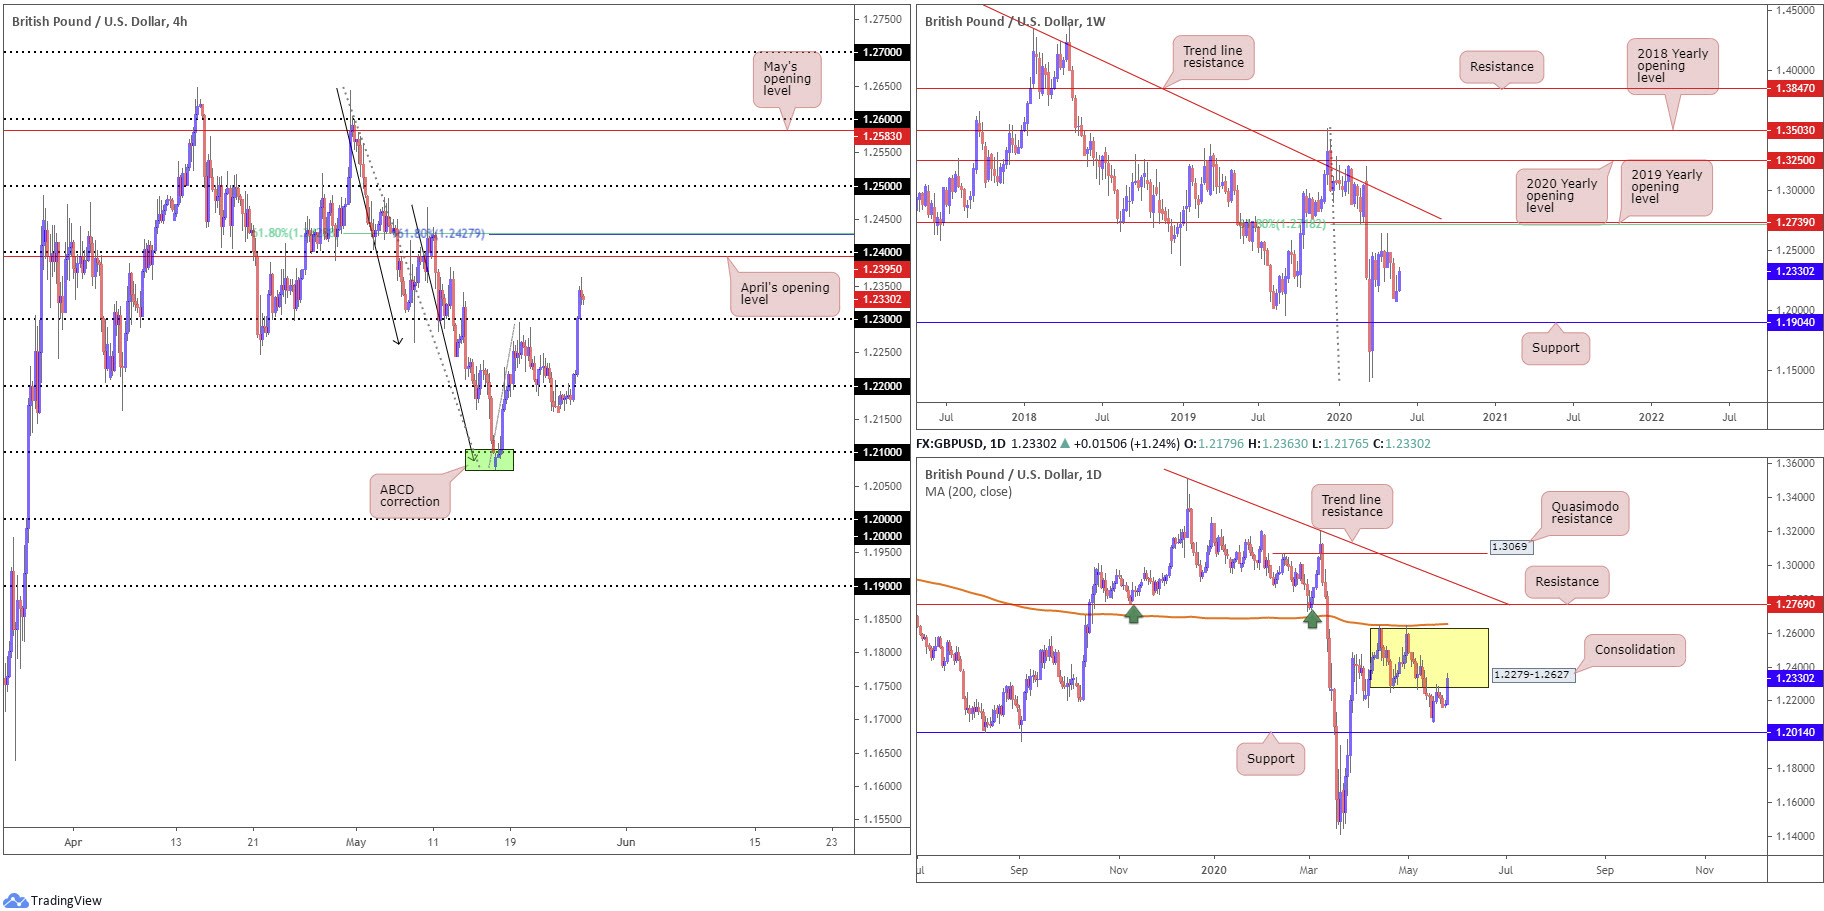
Tuesday came in strong, conquering two round numbers on the H4 timeframe and shining the spotlight on April’s opening level at 1.2395, followed by 1.24 and a 61.8% Fibonacci retracement ratio at 1.2429 as well as a 161.8% Fibonacci extension point at 1.2427. Before reaching 1.24, however, traders need to consider the possibility of a retest forming at 1.23. Interestingly, the 61.8% retracement marks the final take-profit target out of the recently completed H4 ABCD (black arrows) bullish pattern from 1.2085.
Support on the weekly timeframe positions itself at 1.1904. Resistance, on the other hand, falls in at 1.2739, the 2019 yearly opening level, and a 61.8% Fibonacci retracement ratio at 1.2718, sited close by a trend line resistance, extended from the high 1.5930.
The daily window observed sellers give way off range lows at around 1.2279 yesterday. This may, assuming continued bidding, see the unit attack range tops around 1.2627, along with the 200-day SMA at 1.2654.
Areas of consideration:
A retest scenario off 1.23 is something to keep an eye out for today, particularly appealing for those looking to jump on the recent bullish momentum. A rejection off this base, preferably in the shape of a H4 bullish candlestick pattern, could appeal to buyers seeking the 1.24ish neighbourhood.
April’s opening level at 1.2395 on the H4, followed by 1.24 and a 61.8% Fibonacci retracement ratio at 1.2429 as well as a 161.8% Fibonacci extension point at 1.2427 provides a possible ceiling to contend with today. While lacking in higher-timeframe confluence, H4 structure is likely enough to cause a stir.
AUD/USD:
Global equities rallied Tuesday, lifting risk-sensitive currencies higher, including the Australian dollar.
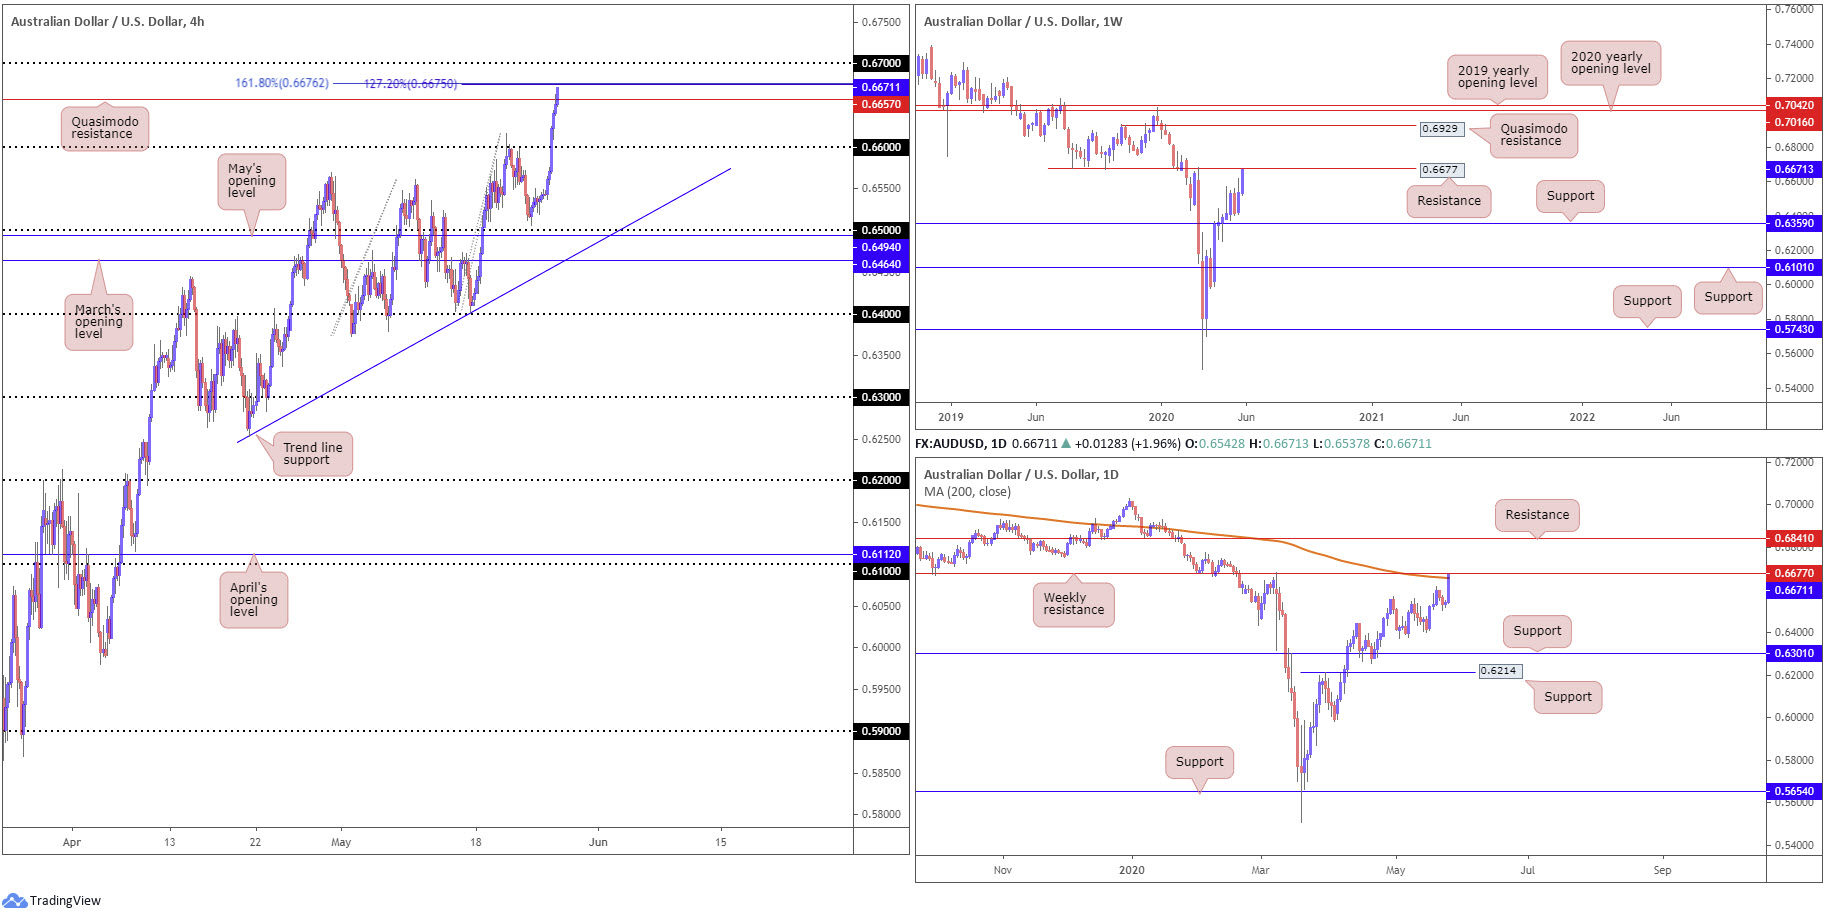
From the weekly timeframe, AUD/USD came within close proximity of resistance at 0.6677, thanks to recent bidding, with a break exposing Quasimodo resistance at 0.6929.
The story on the daily timeframe has price action shaking hands with its 200-day SMA (orange – 0.6656), closely shadowed by the weekly resistance highlighted above at 0.6677.
After crossing Quasimodo resistance at 0.6657 on the H4 timeframe, intraday traders face possible resistance comprised of a 161.8% Fibonacci extension point at 0.6676 and a 127.2% Fibonacci extension point at 0.6675. Note a break of these Fibonacci levels could deliver 0.67 into the fight.
Areas of consideration:
Technically, with weekly resistance at 0.6677 close by, along with a tasty Fibonacci area of resistance on the H4 between 0.6676/75 and the 200-day SMA at 0.6656, a pullback could be on the cards today. However, do account for the possibility of a move to 0.67 before sellers make an appearance.
Conservative sellers may seek a H4 close back beneath H4 Quasimodo resistance at 0.6657 before pulling the trigger.
USD/JPY:
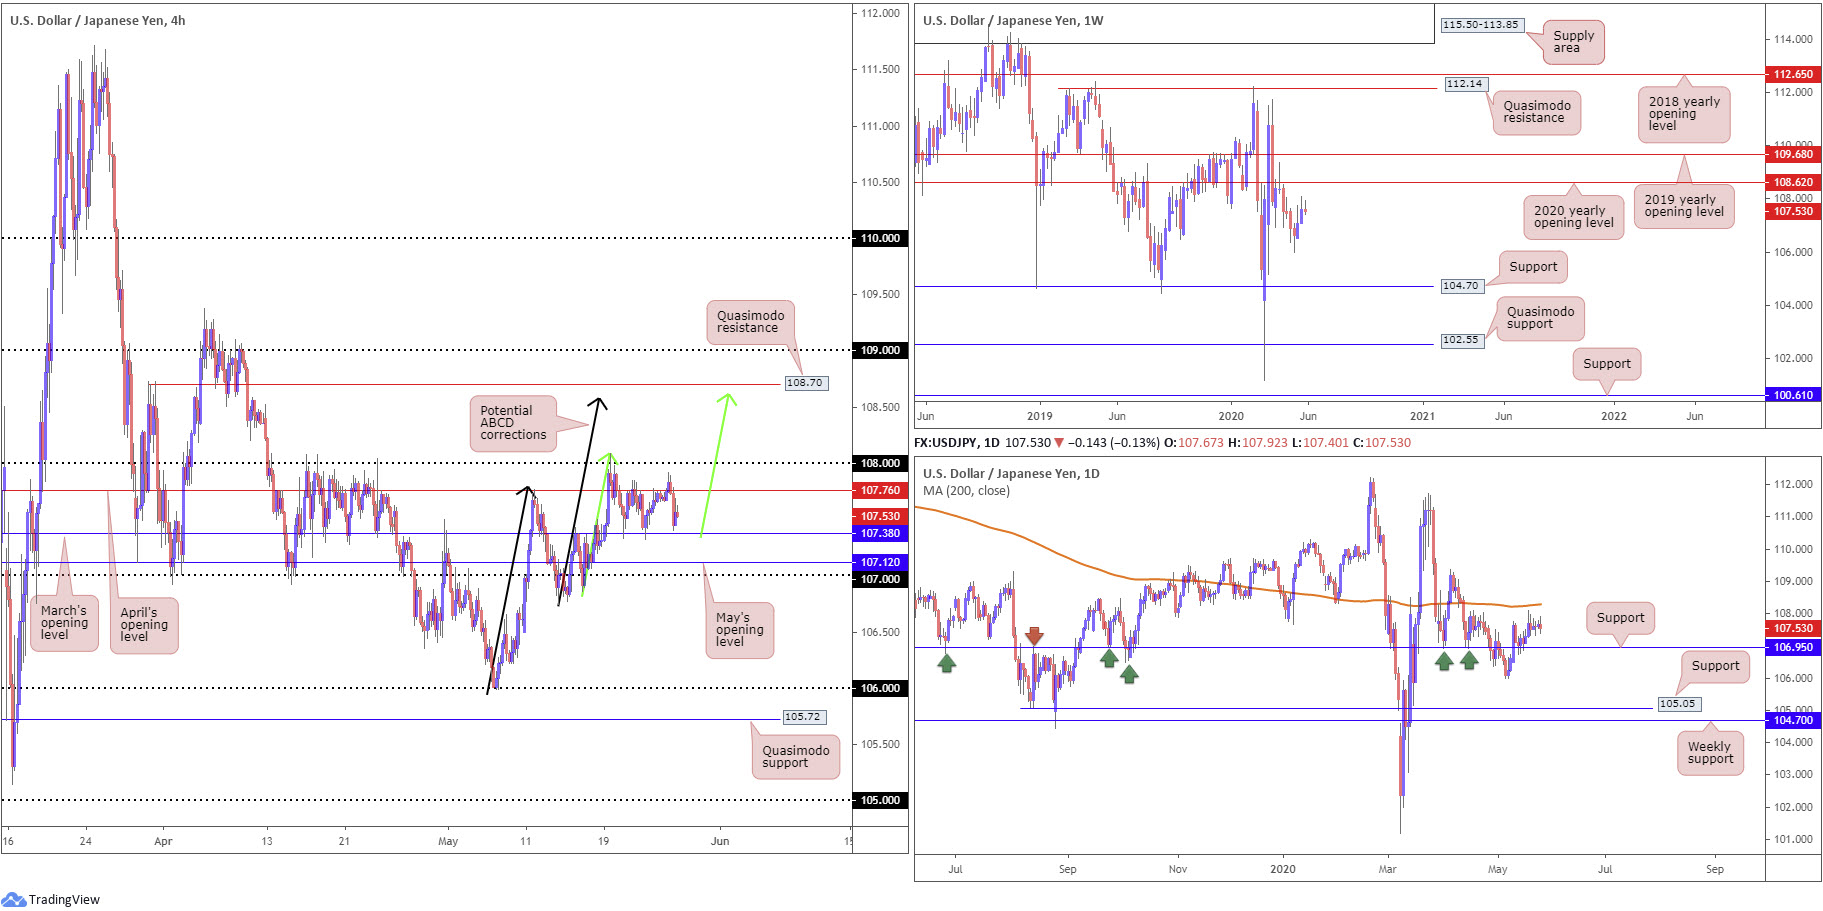
Since last Wednesday, the H4 candles have been encased inside March’s opening level at 107.38 and April’s opening level at 107.76. A break above the upper boundary of the aforementioned range exposes 108. Also of interest, above 1.08 we have two ABCD bearish patterns (black/green arrows) merging around 108.60ish, sited just south of Quasimodo resistance at 108.70. Space beneath the range, however, has May’s opening level at 107.12 to target.
Technical action on the weekly timeframe, following two consecutive weeks of gains, concluded within striking distance of the 2020 yearly opening level at 108.62. Continued bidding, moves that overthrow sellers at 108.62, nudges the 2019 yearly opening level at 109.68 into sight. A rotation to the downside from current price, nevertheless, has support at 104.70 in view.
On the daily timeframe, we can see price recently shook hands with support at 106.95, after dipping from three-week tops at 107.76. Since then, price has been kicking its heels within striking distance of the 200-day SMA (orange – 108.28), with a break exposing the 109.38 April 6 high.
Areas of consideration:
Lower-timeframe players may find use in noting the H4 range between 107.76/107.38 as potential levels to consider today.
A fakeout through 108 into the 200-day SMA at 108.28 is a potential scenario possibly interesting sellers. Buy-stops contained above 108 may provide enough fuel to sell. Conservative traders, however, may seek a H4 close beneath 108 before committing.
The H4 ABCD corrections at 108.60 also marks an interesting reversal zone, an area boasting a close relationship with H4 Quasimodo resistance at 108.70 and weekly resistance at 108.62 (the 2020 yearly opening level).
USD/CAD:
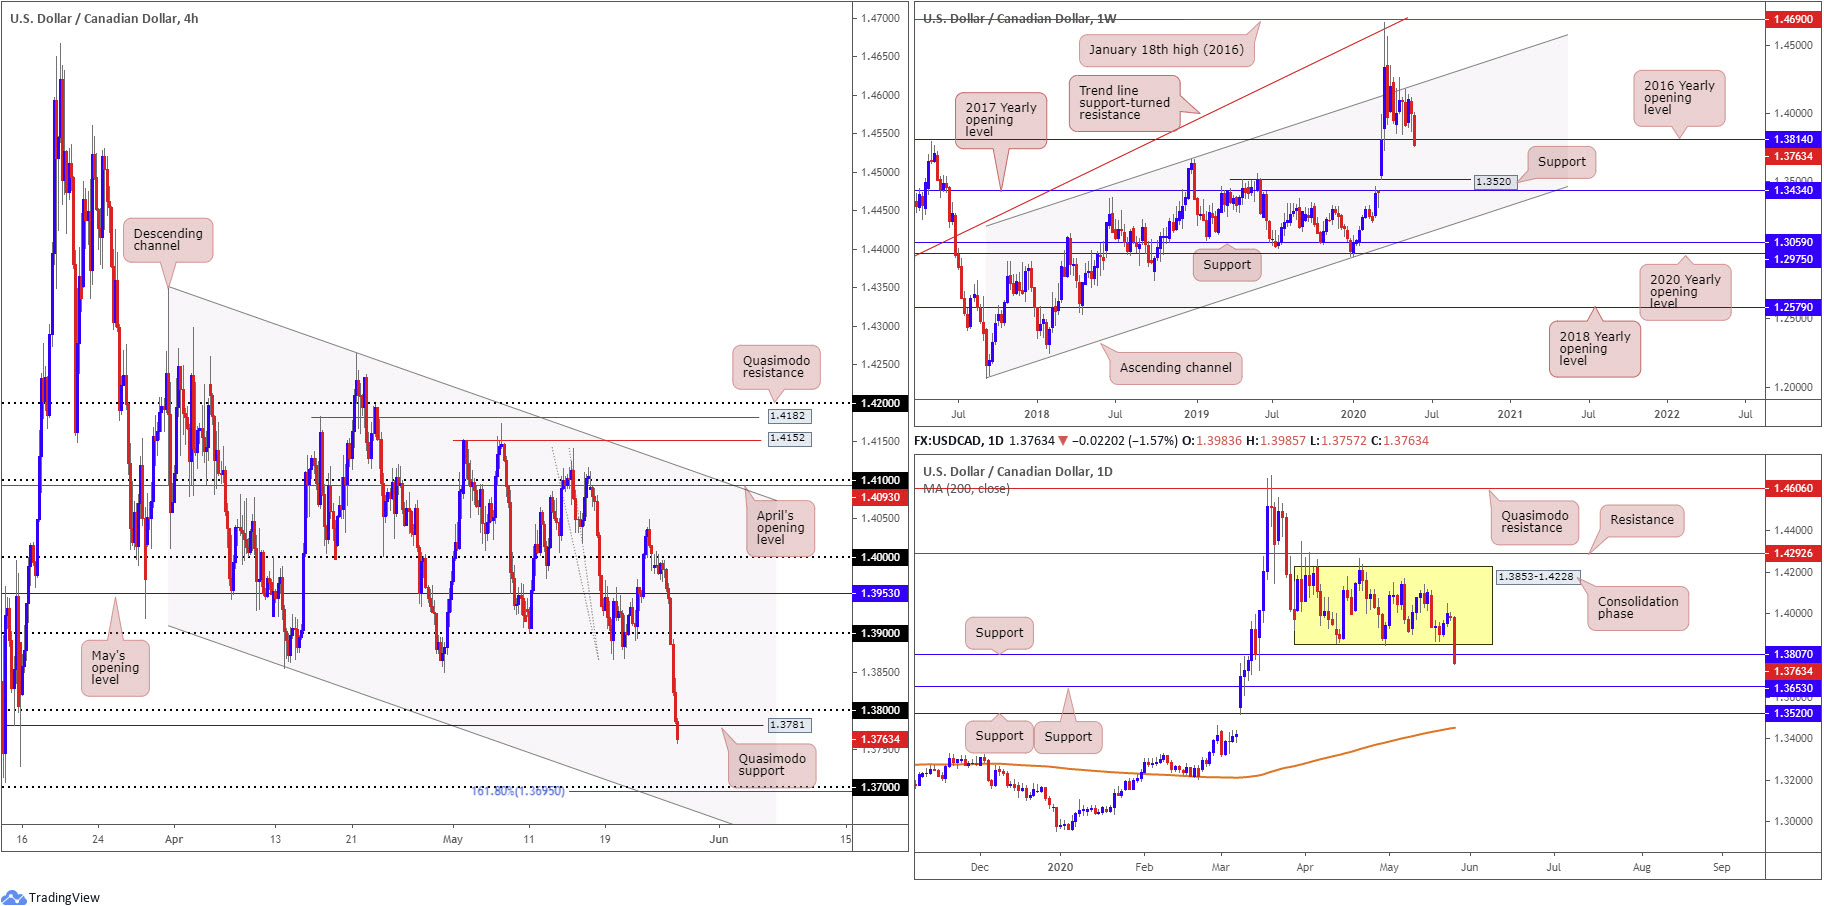
Unable to maintain an upside presence north of the key figure 1.40, Monday dipped through the base and retested the underside as resistance. Tuesday witnessed the US dollar dive 1.5% lower against the Canadian dollar amid a broad USD selloff, involving the DXY touching gloves with 99.00.
The steep intraday fall was also likely sponsored by breakout sellers under May’s opening level at 1.3953 and the 1.39 and 1.38 handles on the H4 timeframe. As evident from the H4 chart, we also recently overthrew Quasimodo support at 1.3781, turning the spotlight to 1.37, and a 161.8% Fibonacci extension point at 1.3695 as well as channel support, taken from the low 1.3937.
Further out on the weekly timeframe, support, in the shape of the 2016 yearly opening level, at 1.3814, had its legs pulled out from under it yesterday, perhaps setting the stage for a run to support at 1.3520 (a prior Quasimodo resistance level).
Since April, price action on the daily timeframe has been carving out a consolidation between 1.3853-1.4228. In the form of a near-full-bodied bearish candle, yesterday tunnelled through the lower edge of the current range and also took on nearby support coming in at 1.3807. The next port of call on the daily chart can be found at support from 1.3653.
Areas of consideration:
Sellers late to the party will likely be looking to get involved today. Printing a H4 close below 1.38 is, by most technicians, considered a bearish indicator. Though clearing H4 Quasimodo support at 1.3781 possibly unlocks downside to 1.37ish. As a result, intraday traders may already be short; others, however, may seek a retest at 1.38/1.3781 before taking action.
Either way, technically, we appear clear south of 1.3781 for further losses.
USD/CHF:
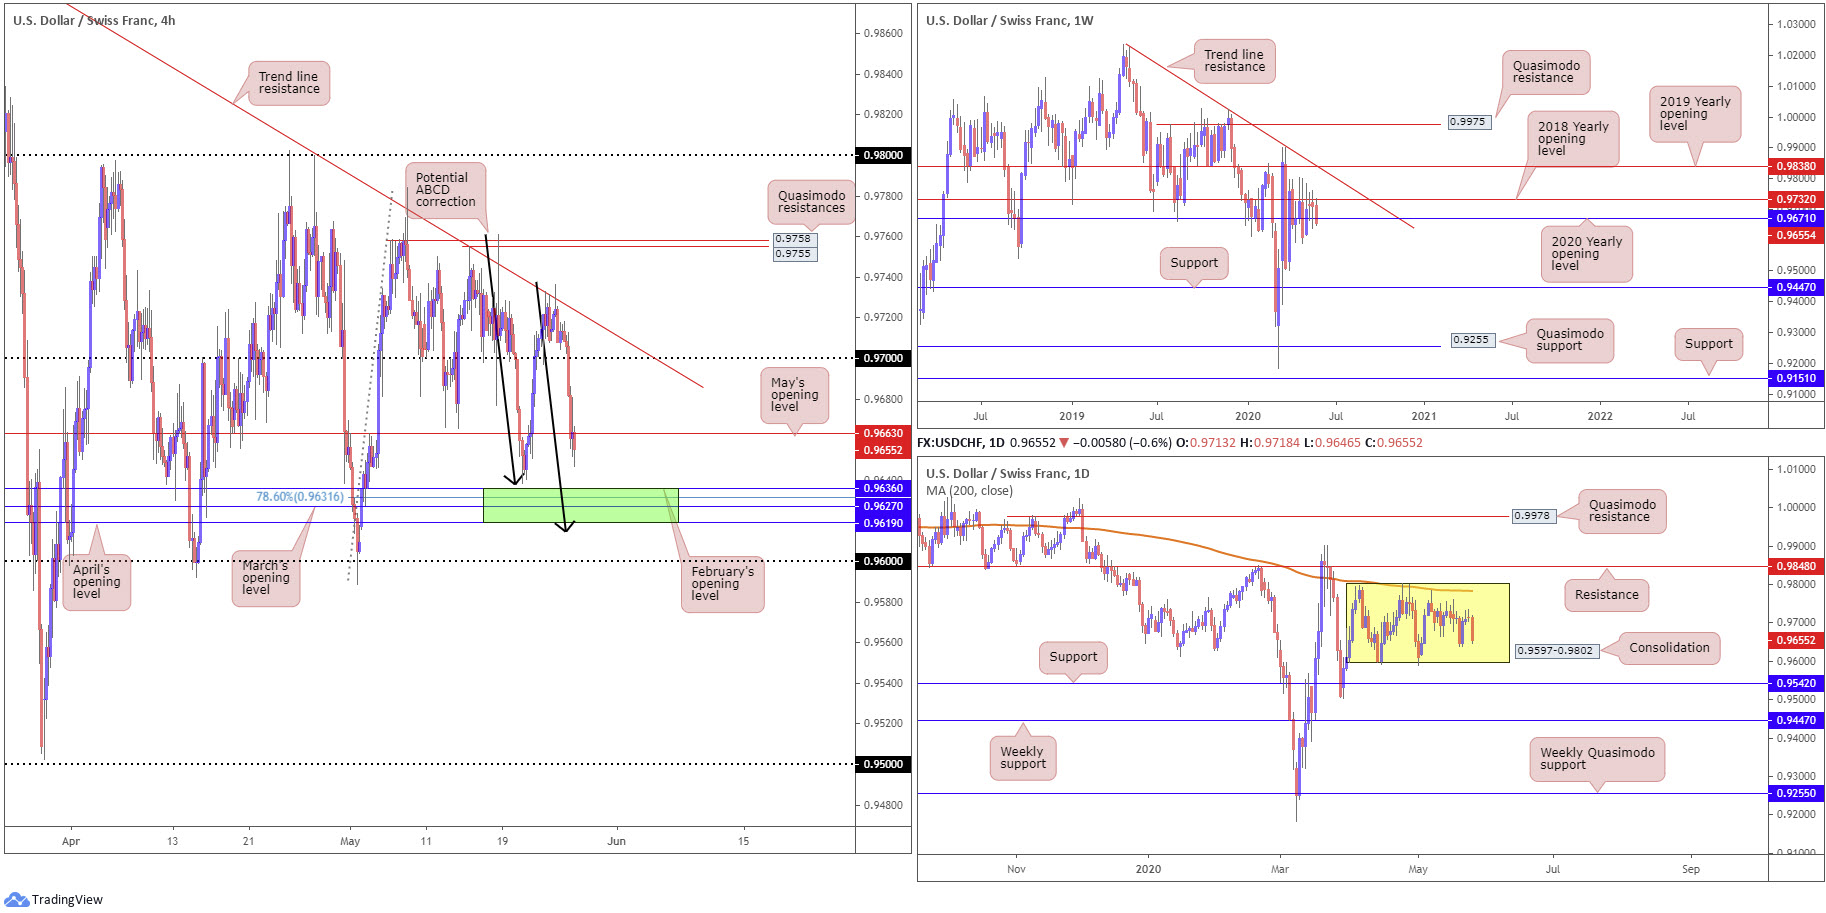
The US dollar spun off into a phase of selling vs. the Swiss franc Tuesday, defensive under H4 trend line resistance, taken from the high 0.99. The pair found thin air under 0.97 and, in recent hours, crossed through May’s opening level at 0.9663. Yesterday’s decline has thrown 0.9619/0.9636 (green) into the pan, an area made up of April, March and February’s opening levels, closely shadowed by a potential ABCD correction (black arrows) at 0.9614 and the 0.96 handle.
Moving up the curve, longer-term flow based on the weekly timeframe is attempting to elbow through the 2020 yearly opening level at 0.9671, though at this point it’s difficult to know whether sellers have the firepower to make a serious dent here. To the upside, traders face familiar resistance at 0.9732, the 2018 yearly opening level. Technical structure above 0.9732 is seen at the 2019 yearly opening level drawn from 0.9838 and trend line resistance, taken from the high 1.0226. Moves south of 0.9671 shifts focus to support at 0.9447.
Since early April, price action on the daily timeframe has seesawed between 0.9802/0.9597, with current price heading into the lower limits of the area. Traders may also want to acknowledge the 200-day SMA (orange – 0.9783) circling the upper border of the aforementioned range. Outside of the base, traders will note resistance rests at 0.9848 and support from 0.9542.
Areas of consideration:
0.9619/0.9636 (green) on the H4 timeframe is likely to appeal to buyers today, particularly as the area merges closely with a potential H4 ABCD correction (black arrows) at 0.9614. May’s opening level at 0.9663 stands as a logical take-profit level out of the noted base, with a break calling for 0.97.
Alternatively, buyers may find interest in 0.96, knowing the round number intersects with the lower edge of the daily range at 0.9597.
Dow Jones Industrial Average:
Global equities extended gains Tuesday, buoyed on the back of optimism concerning the development of coronavirus vaccines. The Dow Jones Industrial Average climbed 529.95 points, or 2.17%; the S&P 500 gained 36.32 points, or 1.23%, while the tech-heavy Nasdaq 100 concluded lower by 24.01 points, or 0.26%.
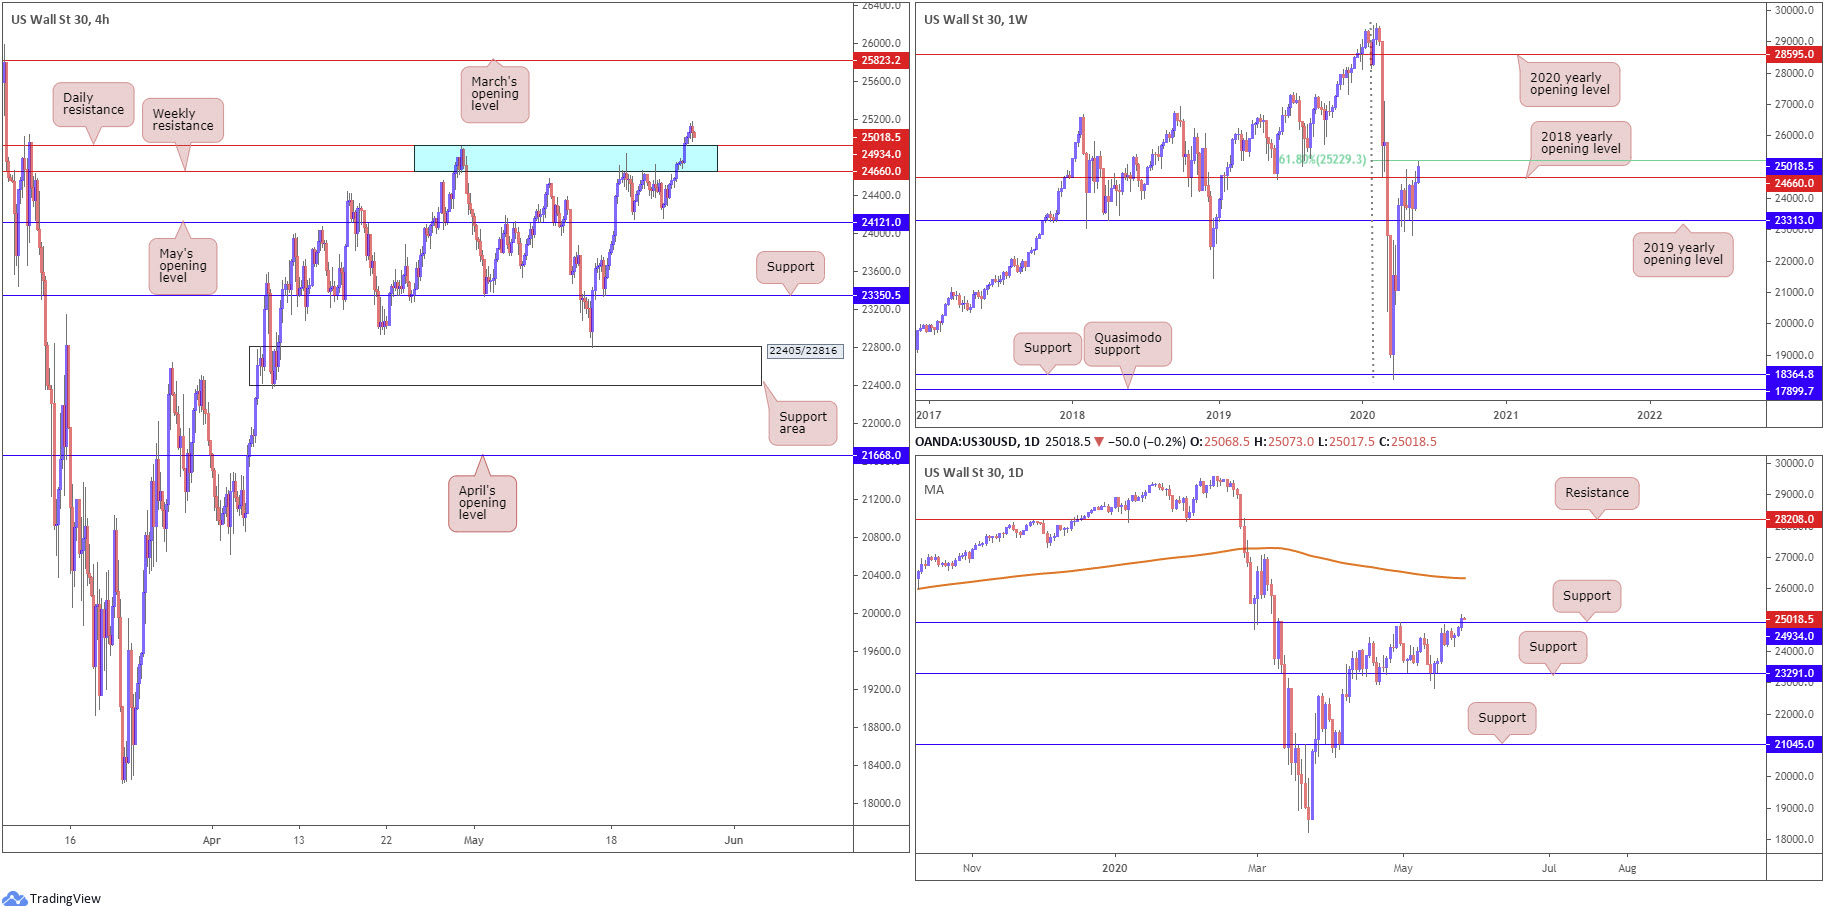
Recent demand lifted weekly price through the 2018 yearly opening level coming in at 24660, throwing a 61.8% Fibonacci retracement ratio at 25229 into the pot. The sky above 25229 is reasonably clear back to the 2020 yearly opening level at 28595.
A closer reading on the daily timeframe saw movement rush resistance at 24934 (now a serving support), a level capping downside since early March. Clearing this angle potentially clears the river north until reaching the 200-day SMA (orange – 26338).
A familiar area of resistance on the H4 timeframe worked its way into the spotlight in recent trading, a zone comprised of a daily resistance level at 24934 and weekly resistance, by way of the 2018 yearly opening level, at 24660 (blue). As evident from the chart, the area was consumed in recent trading, highlighting potential for a run to March’s opening level at 25823.
Areas of consideration:
With 24934/24660 giving way, breakout buyers are likely attempting to get involved. A successful retest of the zone may see additional buyers enter the frame. Although March’s opening level at 25823 calls for attention on the H4, the weekly 61.8% Fibonacci retracement ratio at 25229 could hamper upside, therefore this should be considered the initial upside target for any long positions.
XAU/USD (GOLD):
Demand for the yellow metal diminished Tuesday as investors dumped safe-haven assets amid broad risk-on sentiment.
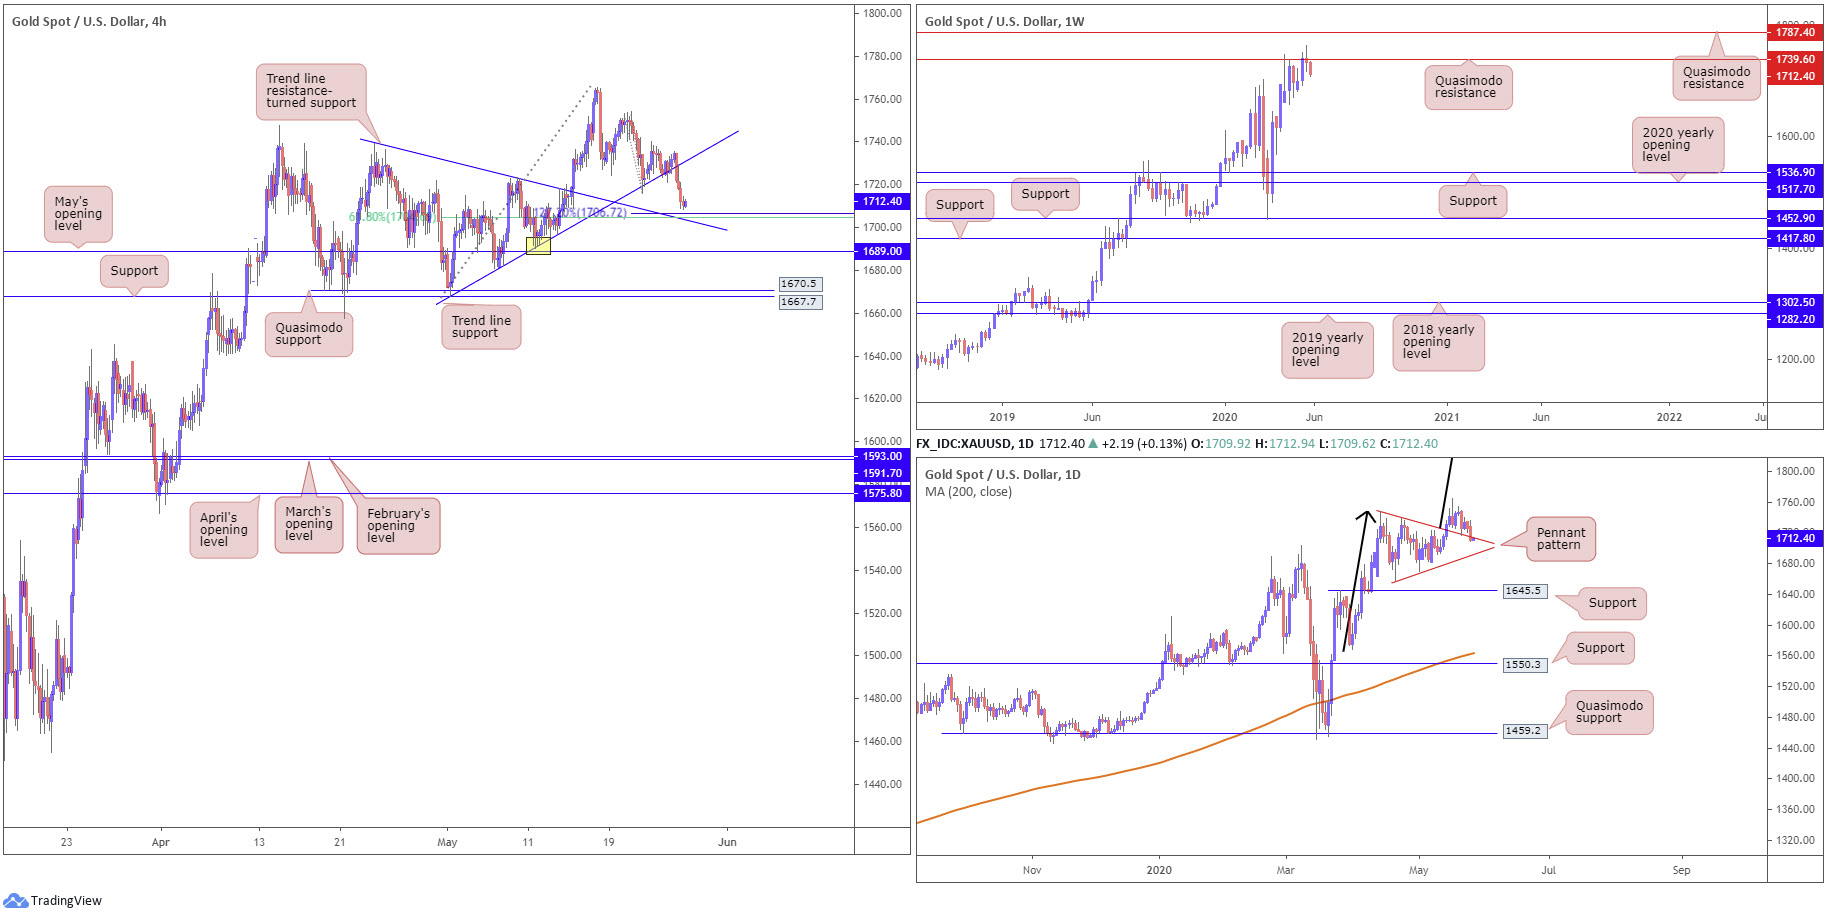
Selling guided H4 candles through trend line support, extended from the low 1668.0, landing bullion within striking distance of trend line resistance-turned support, taken from the high 1739.1. This level also comes with a 61.8% Fibonacci retracement ratio at 1704.7 and a 127.2% Fibonacci extension point at 1706.7. Beyond this area, however, it’s worth noting we have feasible support lurking off May’s opening level at 1689.0.
The technical landscape on the weekly timeframe has, from mid-April, seen buyers and sellers battle for position around the underside of Quasimodo resistance at 1739.6. Clearance of this base places another layer of Quasimodo resistance on the hit list at 1787.4. It may also interest some traders to note the trend on gold has faced a northerly trajectory since 2016.
The daily timeframe offers chart pattern enthusiasts a bullish pennant configuration to work with, established from a high of 1747.7 and a low coming in from 1658.1. As of current price, we are retesting the broken pennant resistance as support. Take-profit targets out of pennant patterns are measured by taking the preceding move (black arrows) and adding the value to the breakout point. This offers a sizeable take-profit, coming in at 1909.4.
Areas of consideration:
The combination of H4 trend line resistance-turned support, taken from the high 1739.1, a H4 61.8% Fibonacci retracement ratio at 1704.7, a H4 127.2% Fibonacci extension point at 1706.7 and the upper boundary of the daily pennant pattern perhaps offering support may be sufficient to entice buyers back into the market. The problem, of course, is weekly price holding Quasimodo resistance at 1739.6.
Conservative buyers, therefore, will likely wait and see if a H4 bullish candlestick formation emerges before pulling the trigger.
The accuracy, completeness and timeliness of the information contained on this site cannot be guaranteed. IC Markets does not warranty, guarantee or make any representations, or assume any liability regarding financial results based on the use of the information in the site.
News, views, opinions, recommendations and other information obtained from sources outside of www.icmarkets.com.au, used in this site are believed to be reliable, but we cannot guarantee their accuracy or completeness. All such information is subject to change at any time without notice. IC Markets assumes no responsibility for the content of any linked site.
The fact that such links may exist does not indicate approval or endorsement of any material contained on any linked site. IC Markets is not liable for any harm caused by the transmission, through accessing the services or information on this site, of a computer virus, or other computer code or programming device that might be used to access, delete, damage, disable, disrupt or otherwise impede in any manner, the operation of the site or of any user’s software, hardware, data or property.


