EUR/USD:
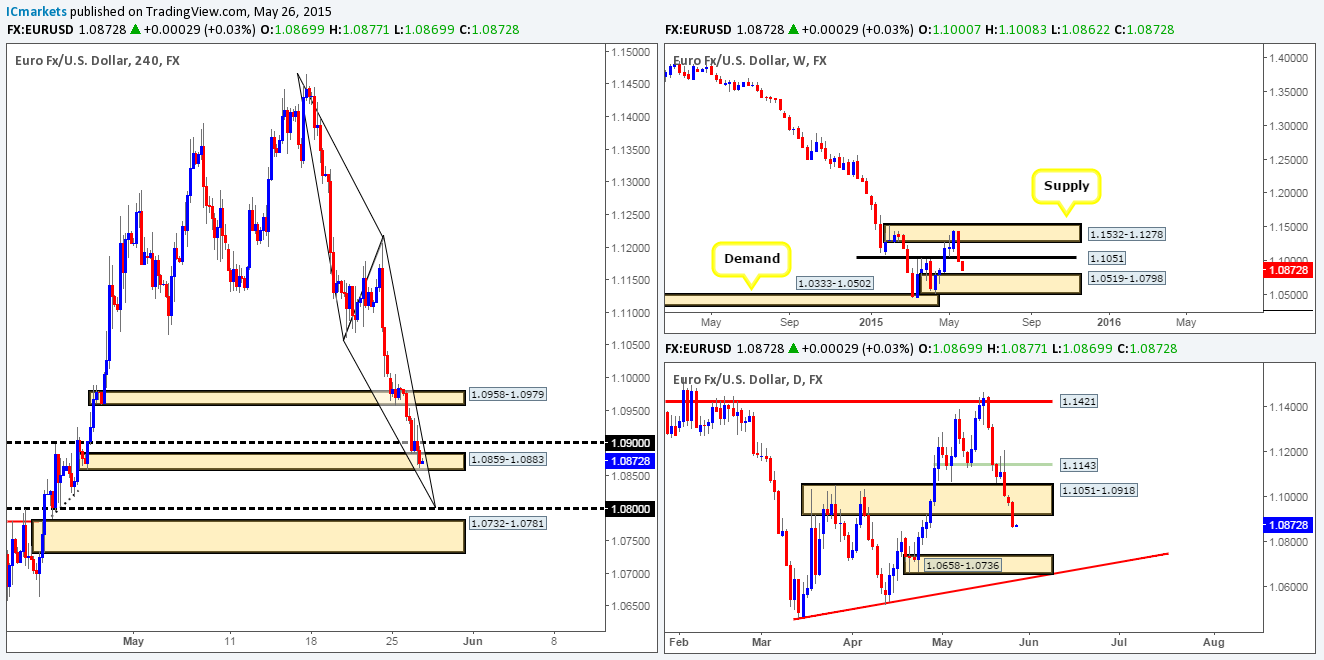
Weekly view: Following last week’s close below the weekly swap level 1.1051, the Euro has so far continued to fall this week. Provided that the sellers can remain strong here, there’s a good chance price will be shaking hands with the weekly demand area seen just below at 1.0519-1.0798 sometime soon.
Daily view: The daily timeframe shows that a strong close below the daily swap area coming in at 1.1051-1.0918 was seen during yesterday’s session. As far as we can see, this move has paved the way south for further downside to at least the daily demand area visible at 1.0658-1.0736, which, as you can probably see, is not only located within the aforementioned weekly demand area, but it also boasts daily trendline convergence from the low 1.0461.
4hr view: The recent selling on this pair saw price take out the 1.0900 handle and slam dunk itself into 4hr demand positioned just below it at 1.0859-1.0883. As you can see, the buyers have attempted to trade higher from here on two occasions, but each time price was forced to close back below 1.0900, suggesting weakness.
Our team has come to a general consensus that buying from this current 4hr demand area is not really high probability, unless a convincing close above 1.0900 is seen, which at this point in time, seems unlikely.
In the case that this 4hr demand zone is taken out later on today, this could set the stage for a continuation move south down towards the round number 1.0800, or even the 4hr demand area seen just below it at 1.0732-1.0781 (located just above the aforementioned daily demand area) . However, for us to be given the green light to short following a close below the 4hr demand area, we would need to see not only a very strong retest of this area as supply, but also supporting lower timeframe strength i.e. a trendline break, an engulf of demand etc… Should all of the above take place, 1.0800 would be where we’d take full profits, since this number also marks the completion point for an AB=CD pattern from the high 1.1465, thus making it a perfect area to cover any shorts you may have and begin looking for longs into the market.
Levels to watch/live orders:
- Buys: Flat (Predicative stop-loss orders seen at: N/A).
- Sells: Flat (Predicative stop-loss orders seen at: N/A).
GBP/USD:
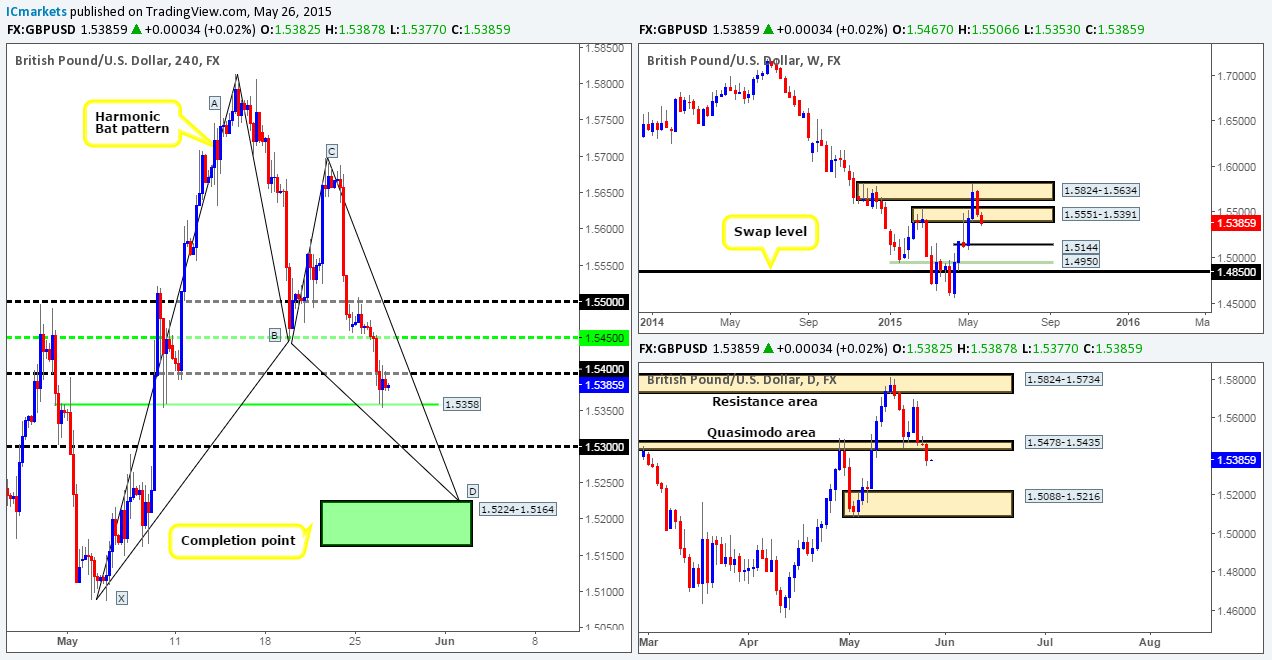
Weekly view: The weekly timeframe shows that price recently pushed below the weekly swap area coming in at 1.5551-1.5391. This has potentially opened the gates for further selling down to 1.5144 – a recent level where serious weekly buyers came into the market.
Daily view: Yesterday’s action saw price close below the ignored daily Quasimodo area seen at 1.5478-1.5435. Providing that the sellers can continue with this tempo into the week, we see very little reason why price will not cross swords with the daily demand seen at 1.5088-1.5216 (surrounds the weekly buy level 1.5144).
4hr view: The 4hr timeframe reveals that the recent decline on this pair took out both 1.5450 and 1.5400 before slamming into 1.5358 – a clearly respected 4hr Quasimodo swap level.
Everything being equal, buying from this Quasimodo barrier is not likely something we’ll be participating in today. The reason for why comes from the current higher-timeframe direction pointing south (see above), and also immediate round number resistance sitting just above current price at 1.5400, which appears to be holding firm at the moment.
Should this Quasimodo hurdle be taken out and respected as resistance today, we would then begin looking for confirmed (lower timeframe) shorts here, targeting 1.5300, and possibly, even the Harmonic Bat completion point seen in green at 1.5224-1.5164 (an area to look for buys when or if the time comes) given enough time.
Levels to watch/ live orders:
- Buys: Flat (Predicative stop-loss orders seen at: N/A).
- Sells: Flat (Predicative stop-loss orders seen at: N/A).
AUD/USD:
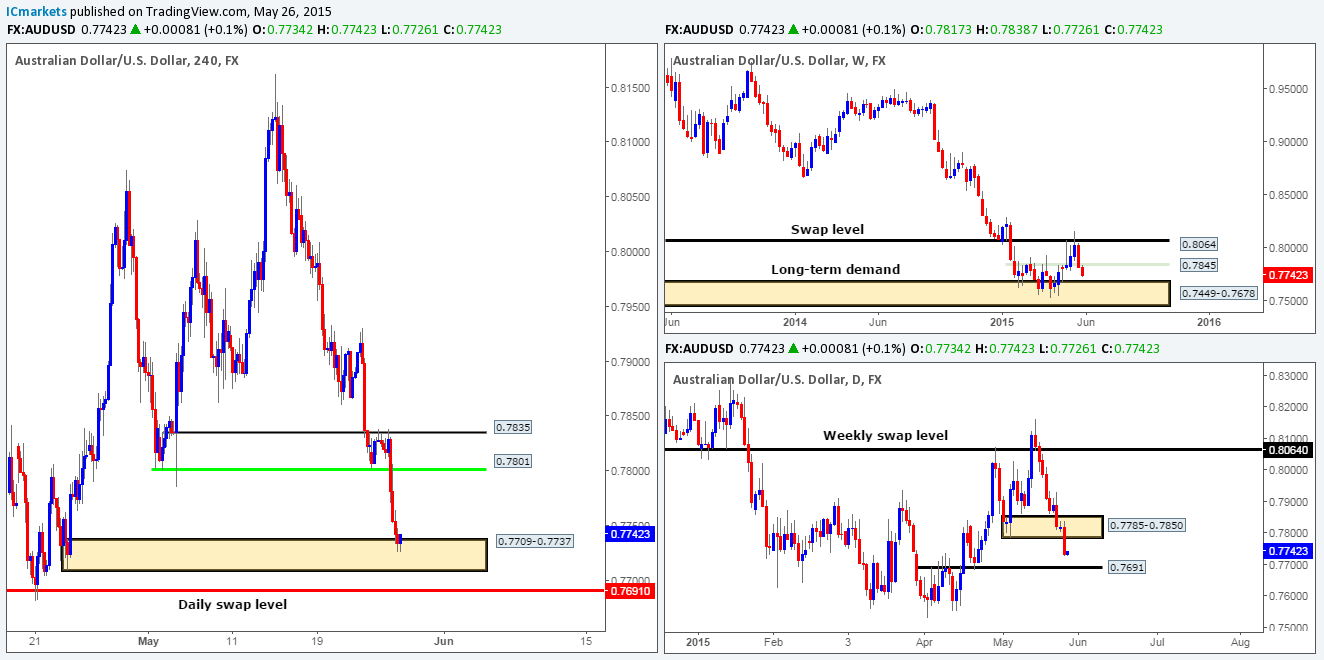
Weekly view: Following last week’s close below the weekly swap level 0.7845, the Aussie pair has so far continued to decline in value. Provided that the sellers can remain strong here, we see very little reason why price will not be shaking hands with the weekly demand area seen just below at 0.7449-0.7678 sometime soon.
Daily view: The daily timeframe shows that the daily demand area coming in at 0.7785-0.7850 was taken out during yesterday’s session. This move, as far as we can see, could potentially attract further sellers into the market, eventually forcing price to test the daily swap barrier seen at 0.7691 – located just above the aforementioned weekly demand area.
4hr view: From the 4hr timeframe, we can see that yesterday’s sell off began during Europe, which continued into London’s session right through in to the U.S session – clearly a sellers’ market! It is only once price collided with the 4hr demand zone positioned at 0.7709-0.7737 did price begin to stabilize.
The approach to this 4hr demand area was fast and clean – by clean, we mean little obvious supply is visible on this timeframe. As a result, buying from this zone is certainly something that interests our team today. However, with the daily swap level looming just below at 0.7691, we have to be prepared for price to fake below this 4hr demand zone into this higher timeframe structure. As such, we have opted to waiting for lower timeframe confirming price action before risking any capital to this idea, since there’s nothing worse than seeing a fakeout take your stop and then move in your originally anticipated direction!
Levels to watch/ live orders:
- Buys: 0.7709-0.7737 [Tentative – confirmation required] (Predicative stop-loss orders seen at: dependent on where one confirms this area).
- Sells: Flat (Predicative stop-loss orders seen at: N/A).
USD/JPY:
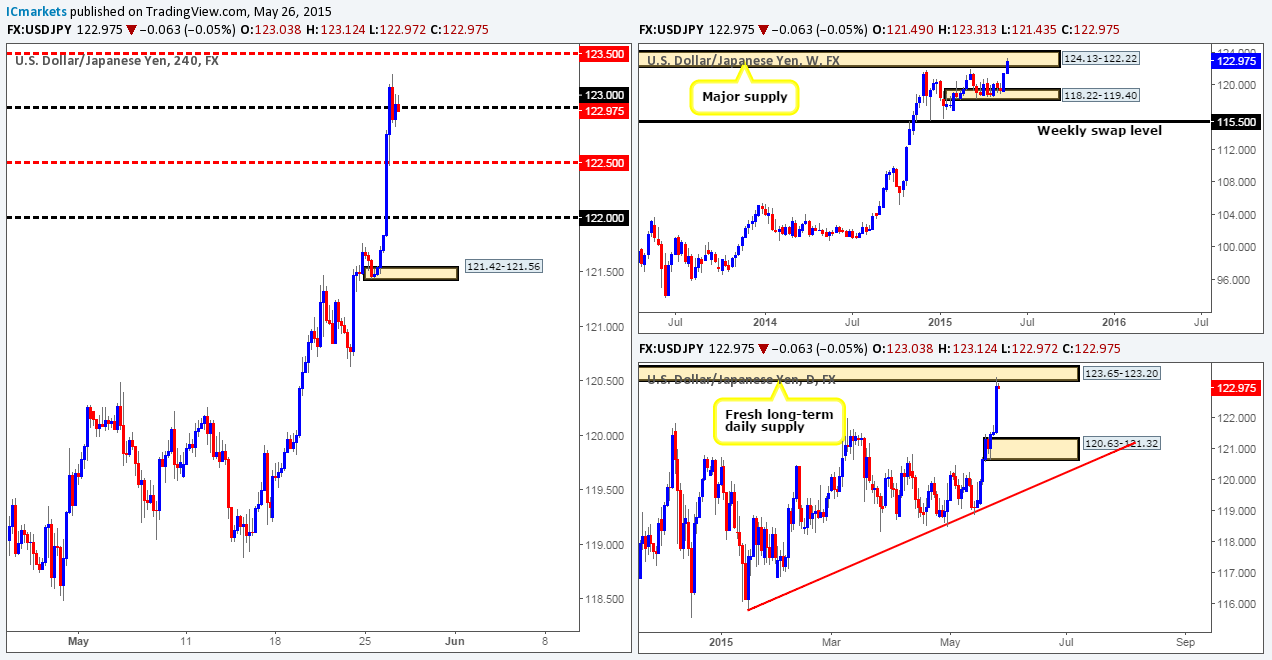
Weekly view: From this angle, we can see that the USD/JPY pair recently attacked a major weekly supply area coming in at 124.13-122.22. This could cause problems for anyone currently long the market…
Daily view: Yesterday’s violent push north took out several technical levels on this timeframe, and closed just below a very fresh long-term daily supply area at 123.65-123.20, which, from where we’re standing, will likely hold the market lower today and possibly into the week.
4hr view: This pair’s recent advance, as you can see, took out both 122.00 and 122.50 during its onslaught. It is only once the market collided with 123.00 have we seen price action attempt to stabilize.
Given that price is trading within very heavy higher timeframe supply zones (see above) at the moment, we believe this market will eventually sell off. Nonetheless, just to be clear here, we’re not predicting any type of reversal, all we’re saying is a bounce south will very likely take place. Whether this bounce will be seen from 123.00 is very difficult to tell at this point in time since just above this level obviously lurks 123.50, which sits deep within the aforementioned daily supply area.
With everything taken into consideration, our objective today is simple. Watch 123.00 for lower timeframe selling action, if this fails and price rallies; we’ll then shift our attention to 123.50.
Levels to watch/ live orders:
- Buys: Flat (Predicative stop-loss orders seen at: N/A).
- Sells: 123.00 [Tentative – confirmation required] (Predicative stop-loss orders seen at: dependent on where one finds confirmation) 123.50 [Tentative – confirmation required] (Predicative stop-loss orders seen at: dependent on where one finds confirmation).
USD/CAD:
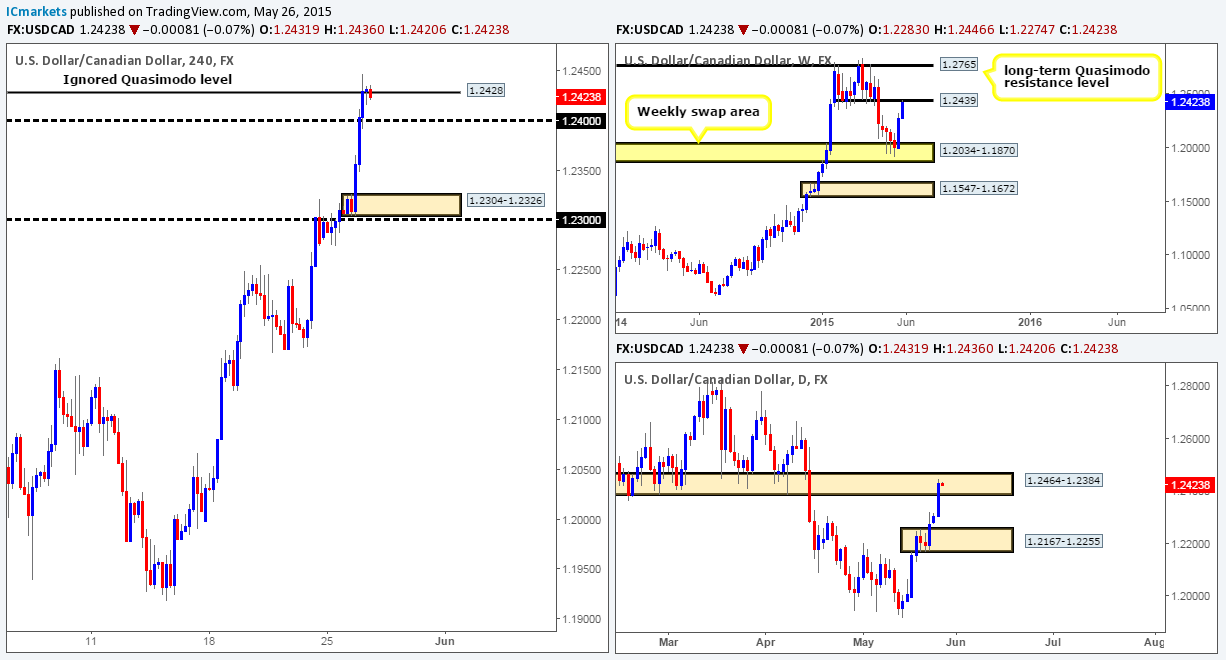
Weekly view: Last week’s rebound seen from the weekly swap area at 1.2034-1.1870 has so far seen the market extend further north, which as a result has forced price to punch into a weekly swap level seen at 1.2439.
Daily view: The daily timeframe shows that the buyers and sellers are currently battling for position within a daily swap area coming in at 1.2464-1.2384.
4hr view: The USD/CAD’s recent advance saw price take out 1.2400 and collide with an ignored 4hr Quasimodo level at 1.2428, which at the time of writing, seems to be holding the market lower.
Given that this market is trading around higher timeframe supply (see above) at the moment, selling this pair could be a possibility today. Be that as it may, shorting at 1.2428 on the 4hr timeframe is considered a risky trade due to potential support sitting just below at 1.2400. A more conservative approach to selling this market in our opinion would be to wait to see if price can close below this support (and with a little luck, retest it as resistance), as this would not only prove that selling strength exists here, but also potentially clear the path down towards the 4hr demand area seen at 1.2304-1.2326 – the risk/reward as you can see is quite favorable!
Levels to watch/ live orders:
- Buys: Flat (Predicative stop-loss orders seen at: N/A).
- Sells: Flat (Predicative stop-loss orders seen at: N/A).
USD/CHF:
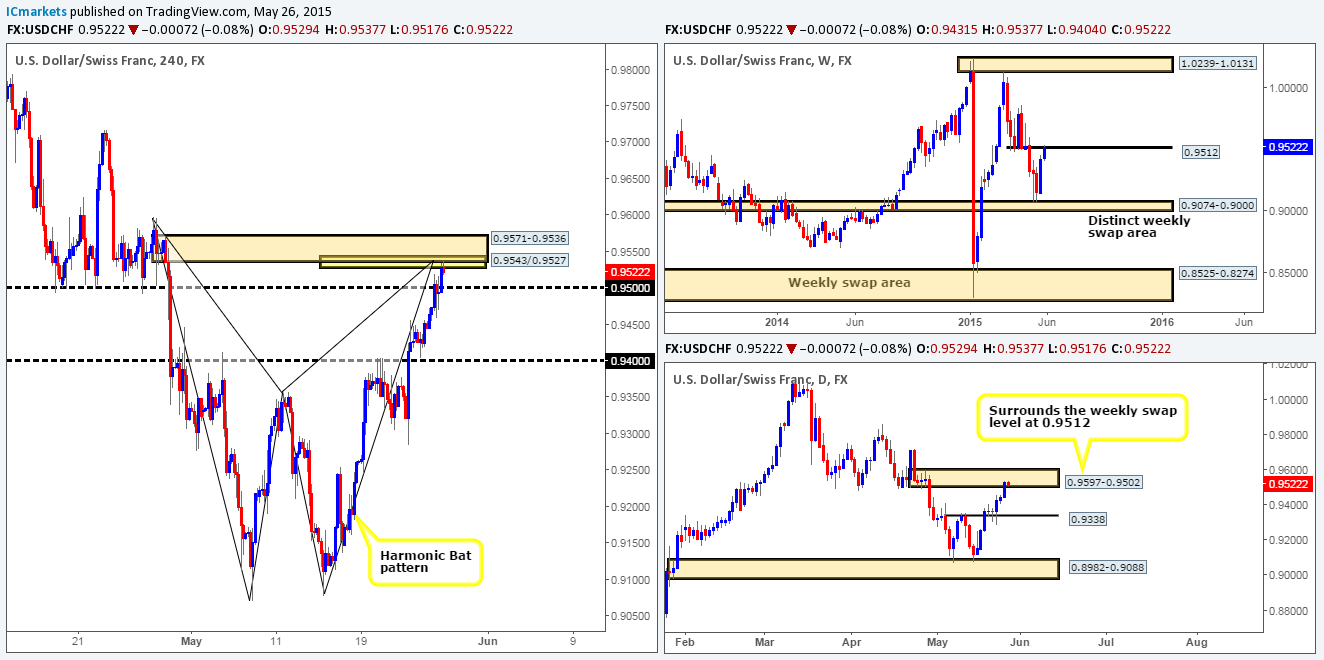
Weekly view: The weekly timeframe shows that this market has continued to press higher, resulting in price connecting with a weekly swap level seen at 0.9512.
Daily view: Following the recent buying seen on this pair yesterday, price is now trading within a fresh daily supply area coming in at 0.9597-0.9502 (encapsulates the aforementioned weekly swap level). Assuming that a sell off ensues from this zone, it is likely we’ll see this market head towards the daily swap level 0.9338.
4hr view: Yesterday’s sessions saw price strongly break through the 0.9500 level and attack a 4hr supply area seen at 0.9571-0.9536. This area of supply is particularly attractive for the following reasons:
- Converging Harmonic Bat reversal zone at 0.9543/0.9527.
- Weekly resistance located just below in the form of a weekly swap level at 0.9512.
- Located within an overall larger daily supply area at 0.9597-0.9502.
- Mid-level number resistance at 0.9550.
However, before hitting the sell button, traders may want to note that there is potential support looming just below at 0.9500. That being the case, one may want to wait for this level to be taken out first before considering shorting this area. Once, or indeed if 0.9500 is consumed, we see very little supportive structures until price reaches the 0.9400 region – depending on your stop placement of course, the risk/reward is quite good.
Levels to watch/ live orders:
- Buys: Flat (Predicative stop-loss orders seen at: N/A).
- Sells: 0.9571/0.9527 [Waiting for price to consume 0.9500 before looking for shorts] (Predicative stop-loss orders seen at: dependent on where one confirms this area once 0.9500 is taken out).
US 30:
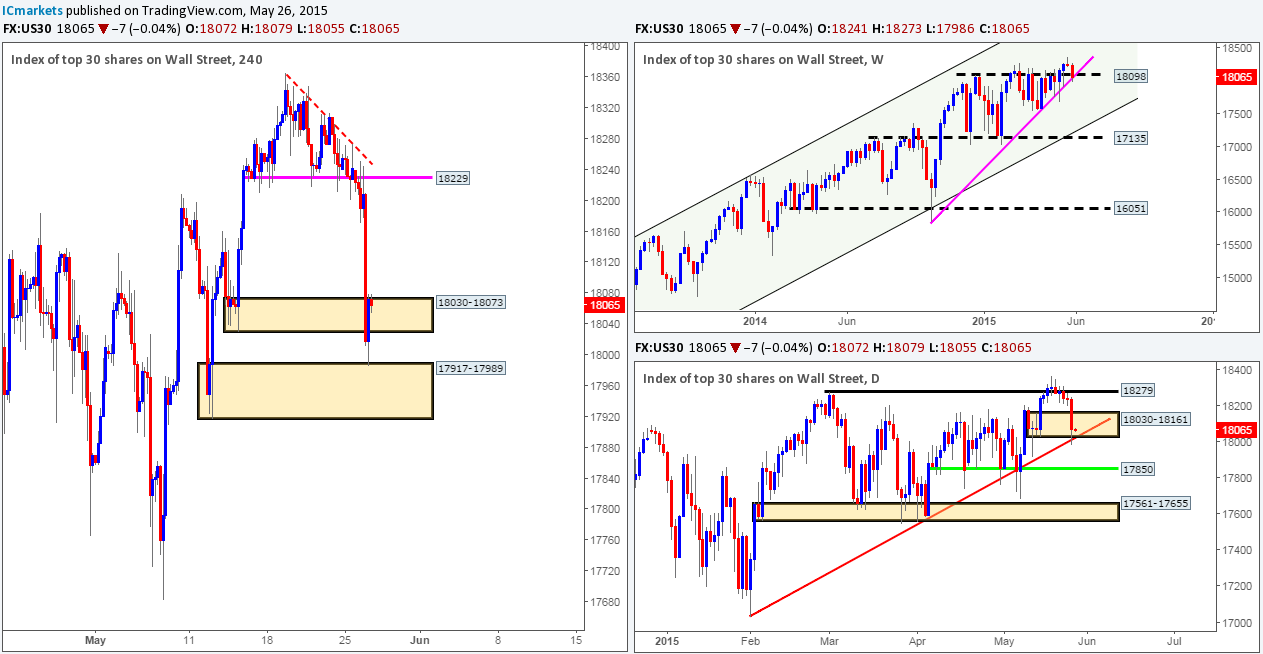
Weekly view: The weekly timeframe has seen price plow back below 18098 and hit the weekly trendline extended from the low 15849. As long as the market holds above this weekly trendline, price should eventually rally higher. If a close below this line is seen, however, it is very likely we may see this index drop down to test the weekly swap level coming in at 17135.
Daily view: From this viewpoint, we can see that price aggressively attacked the daily demand area seen at 18030-18161, which resulted in price spiking below this zone and tagging a daily trendline extended from the low 17033. Should this area be consumed, the next potential support to keep an eye will likely be the daily support level positioned at 17850.
4hr view: The 4hr timeframe shows that price absolutely obliterated the 4hr demand area at 18030-18073 during its recent selling onslaught, which shortly after saw the DOW hit and rebound from a 4hr demand area seen just below it at 17917-17989.
Taking into account that this 4hr demand zone is supported by higher timeframe structures (see above), it is likely further buying will be seen from here. In addition to this, we can see that price has recently jabbed above the broken 4hr demand – turned supply at 18030-18073, potentially opening the gates for further upside towards the 18229 region. Now all we need to see is confirming lower timeframe price action, and we’ll take a position long.
Levels to watch/ live orders:
- Buys: Watching for lower timeframe confirming price action above 4hr demand at 17917-17989 (Predicative stop-loss orders seen at: dependent upon where one confirms this area).
- Sells: Flat (Predicative stop-loss orders seen at: N/A).
XAU/USD (Gold)
Weekly view: Following last week’s fakeout above the weekly supply area seen at 1223.1-1202.6, the gold market has so far continued to sell off, consequently driving head first into a small weekly demand area at 1170.3-1188.4.
Daily view: Yesterday’s daily candle shows that the sellers were in full control of this market, resulting in price dropping down to test the daily trendline extended from the low 1142.5.
4hr view: From the 4hr timeframe, we can see that gold began to sell off around the European open, which, as you can see, continued into London’s morning session. It was only once the U.S session opened did price begin to calm down and stabilize just above a 4hr buy zone coming in at 1178.7-1184.6.
Considering the market’s overall position on both the weekly and daily timeframes (see above) at the moment, today’s spotlight will be firmly focused on the 4hr buy area just mentioned above at 1178.7-1184.6. This zone not only boasts deep Fibonacci support at 0.886, it also shows that pro money were clearly active within this area earlier this month – check out the very obvious buying tails at 1178.7 and 1180.6. Therefore, in the event that price manages to hit this 4hr buy zone today, we feel there is a very good chance a reaction will follow, since unfilled buy orders are likely still lurking within this region.
Seeing that this 4hr buy zone is backed with higher timeframe supportive structures, one could simply place a pending buy order at the limit of this 4hr area around the 1184.9 mark, and a stop loss below at 1177.9. However, if you’re conservative, like us, you may wish to wait for lower timeframe confirming price action before jumping in here and risking capital. This way you’re stop is usually much smaller and the risk/reward increases exponentially.
Levels to watch/ live orders:
- Buys: 1178.7-1184.6 [Tentative – confirmation required] (Predicative stop-loss orders seen at: dependent on where one confirms this area).
- Sells: Flat (Predicative stop-loss orders seen at: N/A).
