
EUR/USD:
A firm greenback across the board weighed on the single currency Tuesday, despite US consumer confidence reporting lower-than-expected numbers. The Conference Board Consumer Confidence Index declined in March, after increasing in February. The Index now stands at 124.1 down from 131.4 in February. The Present Situation Index – based on consumers’ assessment of current business and labour market conditions – declined, from 172.8 to 160.6. The Expectations Index – based on consumers’ short-term outlook for income, business and labour market conditions – decreased from 103.8 last month to 99.8 this month (The Conference Board Inc.).
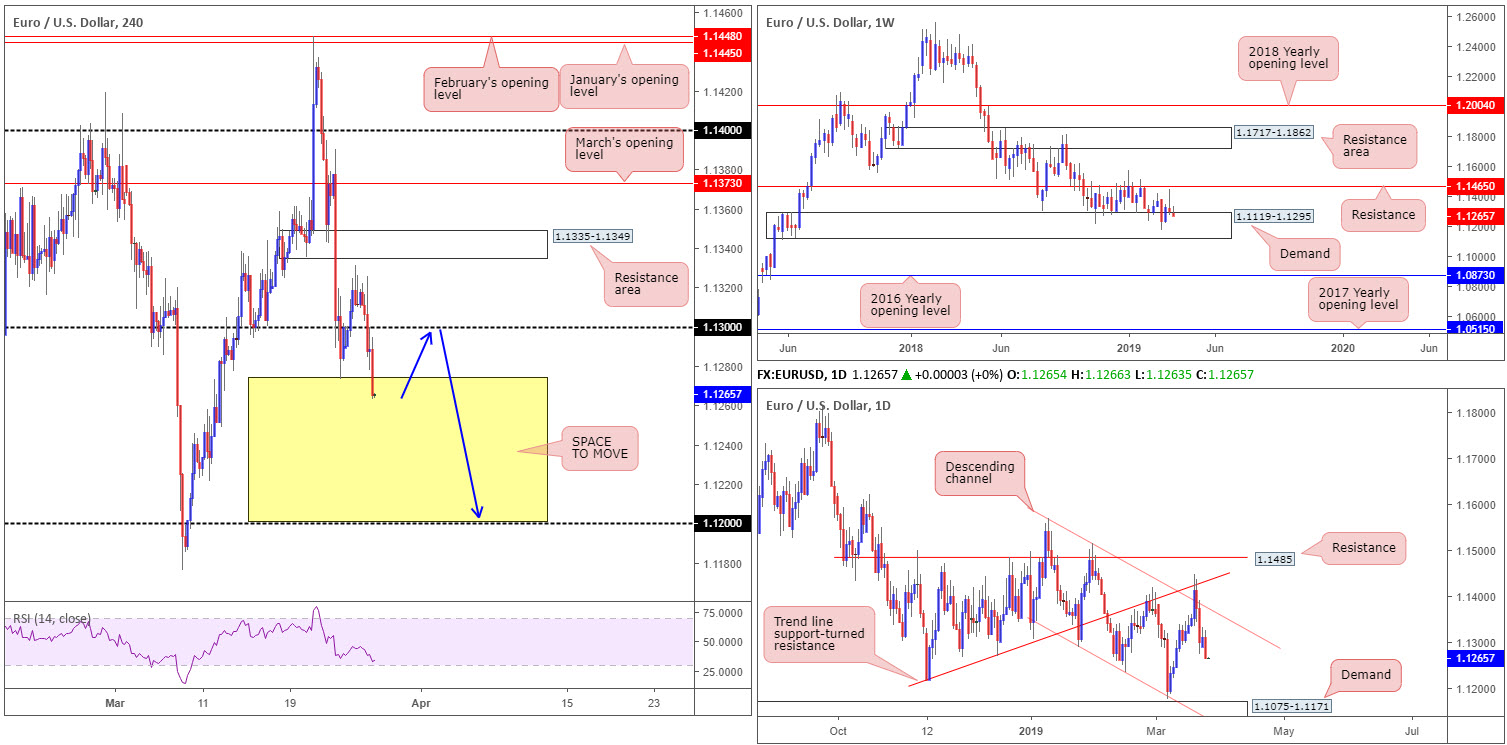
From a technical perspective, recent movement punctured Friday’s low at 1.1273 on the H4 timeframe in strong fashion. This, according to our studies, unbolts downside towards 1.12 (yellow). Note the unit also retested the underside of 1.13 following its voyage lower yesterday, which should now be viewed as viable resistance in this market.
The picture on the higher timeframes has the pair tunnelling deeper into weekly demand priced in at 1.1119-1.1295. Overall, the long-term trend on the weekly timeframe continues to face a southerly direction. The next area of interest beyond the current demand falls in around the 2016 yearly opening level priced in at 1.0873. The story on the daily timeframe shows price facing in the direction of demand coming in at 1.1075-1.1171, after fading (albeit following a minor fakeout north) the upper limit of a descending channel (high: 1.1569 low: 1.1289).
Areas of consideration:
With buyers off Friday’s low mentioned above at 1.1273 likely removed from the picture and downside cleared to 1.12, alongside daily price eyeing demand at 1.1075-1.1171, further selling is certainly a possibility today. The only caveat, of course, is weekly demand at 1.1119-1.1295 remains in motion.
On account of the above, the research team feels the H4 candles may either continue selling off from current price or pullback and retest 1.13 as resistance. The latter is the more attractive route as risk/reward from here to 1.12 is incredible (blue arrows). For traders looking to add additional confirmation to the mix, waiting for a H4 bearish candlestick signal to form off 1.13 prior to pulling the trigger is certainly worth considering (entry/risk levels can be determined according to the candlestick’s rules of engagement).
Today’s data points: ECB President Draghi Speaks; FOMC Member George Speaks.
GBP/USD:
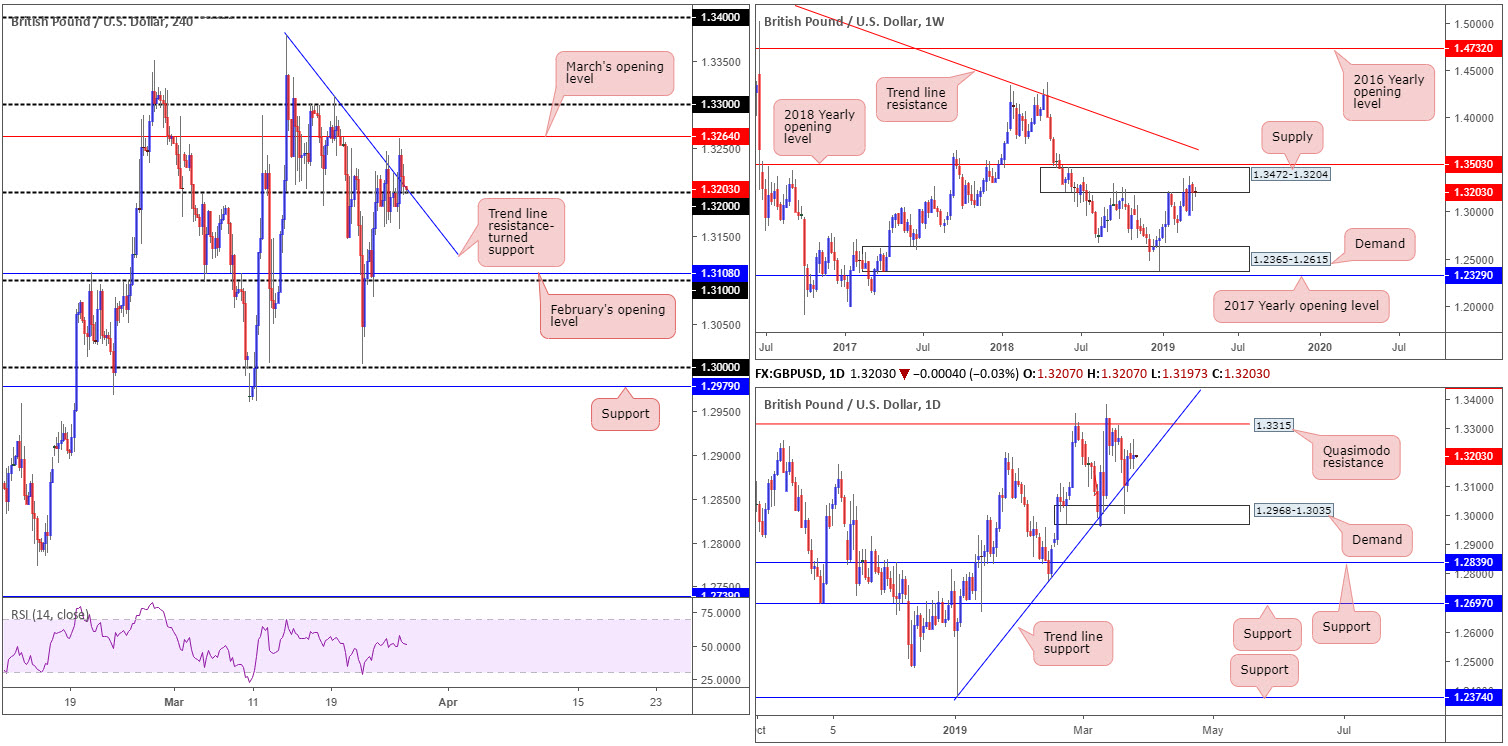
The British pound rallied against its US counterpart Tuesday, following two Eurosceptic lawmakers indicating they might agree to support PM Theresa May’s EU withdrawal deal. The pound, which had languished in negative territory below 1.32, advanced as high as 1.3261, missing March’s opening level at 1.3264 on the H4 timeframe by a hair before collapsing back to its 1.32 neighbourhood.
Heading into the Asia Pac session today, the GBP/USD not only has 1.32 as potential support to work with, it also has trend line resistance-turned support (extended from the high 1.3379). A break back beneath 1.32 could lead to an approach towards February’s opening level at 1.3108/the round number 1.31.
Decorating the weekly chart is supply drawn from 1.3472-1.3204. Since the end of February this has been home to many traders as price continues to flip between gains/losses. In view of the number of times this area has been tested since July 2018, the supply’s foundation is likely weakened, giving rise to a possible advance towards the 2018 yearly opening level at 1.3503.
The stop run through trend line support (extended from the low 1.2373) on the daily timeframe into nearby demand plotted at 1.2968-1.3035 last week provoked a round of buying Friday. Despite this, both Monday and Tuesday’s sessions have failed to print anything meaningful to the upside. In fact, two back-to-back indecision candles are visible.
Areas of consideration:
With weekly players potentially sending price action lower from supply; daily flow lingering a few points ahead of trend line support and H4 action currently testing 1.32 as support (and trend line support), continues to offer a mixed outlook. Therefore, the research team’s stance remains flat. Irrespective of the direction traders select, opposing structure is nearby.
Today’s data points: FOMC Member George Speaks.
AUD/USD:
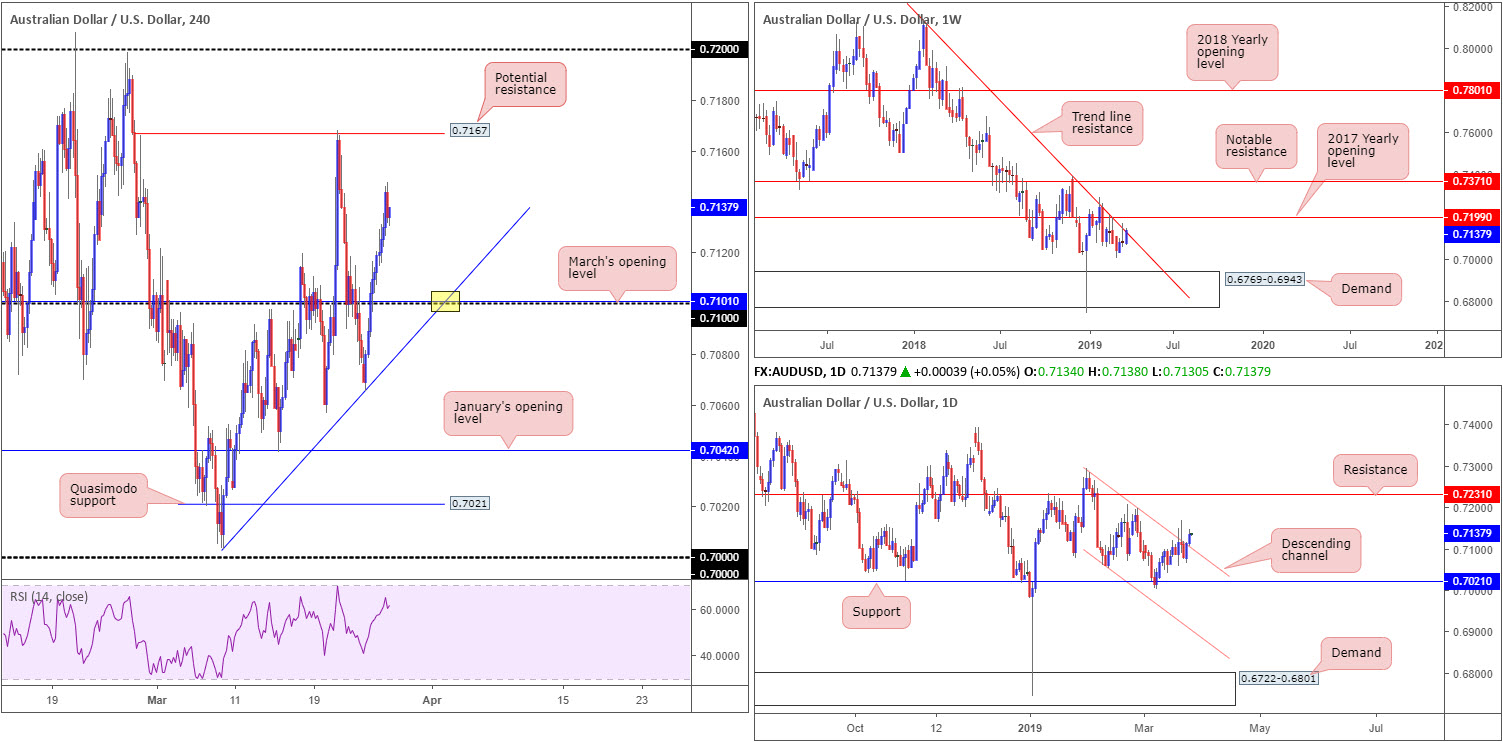
Beginning with a look on the weekly timeframe, traders may want to acknowledge a long-standing trend line resistance (etched from the high 0.8135). The market could observe additional selling take shape from here as downside appears reasonably free until connecting with demand pencilled in at 0.6769-0.6943.
Despite weekly price offering traders a platform of resistance, daily movement climbed through channel resistance (drawn from the high 0.7295) yesterday. Assuming traders attempt a move north on the back of this, tops around 0.72ish are in view, tailed closely by resistance parked at 0.7231.
A closer reading of price action on the H4 timeframe shows price extended gains beyond 0.71, with potential to continue exploring higher ground until shaking hands with resistance plotted at 0.7167 (essentially a double-top formation).
Areas of consideration:
The point at which 0.71, March’s opening level and a trend line support (taken from the low 0.7003) merge (yellow) on the H4 timeframe is of interest. Supported by the recent break of daily channel resistance, the market could witness a healthy bounce occur from here. Traders are, however, urged to keep in mind where we’re trading from on the weekly timeframe: trend line resistance. To help try and overcome this, waiting for additional confirmation to form off 0.71 before pulling the trigger is an option (entry/risk levels can be set based on the selected confirming technique).
A short from H4 resistance is also worthy of note, given it is placed a small distance above the current weekly trend line resistance. The only grumble, of course, is the fact daily buyers are looking to move higher at the moment. Like above, though, waiting for additional confirmation to form is an idea here, too.
Today’s data points: FOMC Member George Speaks.
USD/JPY:
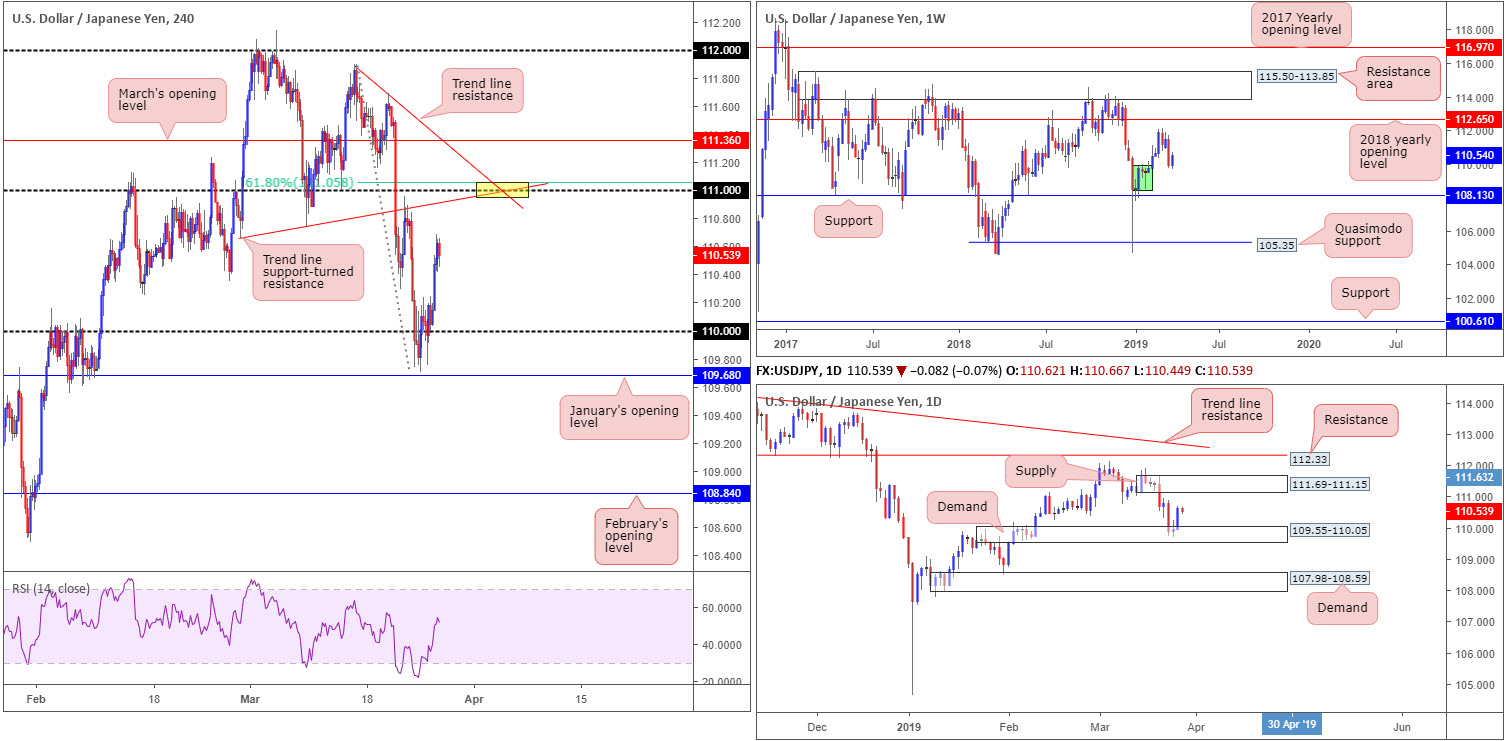
By way of a near-full-bodied bullish daily candle, the USD/JPY stamped in solid gains Tuesday, up 0.60%. From the upper edge of daily demand coming in at 109.55-110.05, the pair swept higher, with the next upside target not in view until reaching daily supply drawn from 111.69-111.15. Bolstering daily demand is a minor weekly demand (green) at 108.49/109.74. Do note, though, the research team still feels the more prominent support on the weekly timeframe remains at 108.13, a few points beneath the said demand.
Interestingly, on the H4 timeframe, yesterday’s advance parked the H4 candles within relatively close proximity to 111. This psychological number, marked yellow, also boasts a merging trend line support-turned resistance (drawn from the low 110.66), another trend line resistance (from the high 111.90) and a 61.8% Fibonacci resistance at 111.05. What’s also notable from 111 is the lower edge of daily supply seen above at 111.15.
In the event the pair draws lower prior to reaching 111, however, 110 is likely to be brought back into the mix, and quite possibly January’s opening level at 109.68.
Areas of consideration:
Keeping it simple this morning, the 111 handle is, according to our markings, a high probability sell zone with a healthy dose of H4 confluence and also the lower base of daily supply supporting the level at 111.15.
Entry at 111.00 and stop-loss order set at 20 points is an option, though some traders may prefer waiting for additional confirmation which will likely offer different entry and exit parameters. Ultimately, the research team feels the last demand formed on approach to 111 should be considered as a first port of call in terms of taking profit and reducing risk to breakeven.
Today’s data points: FOMC Member George Speaks.
USD/CAD:
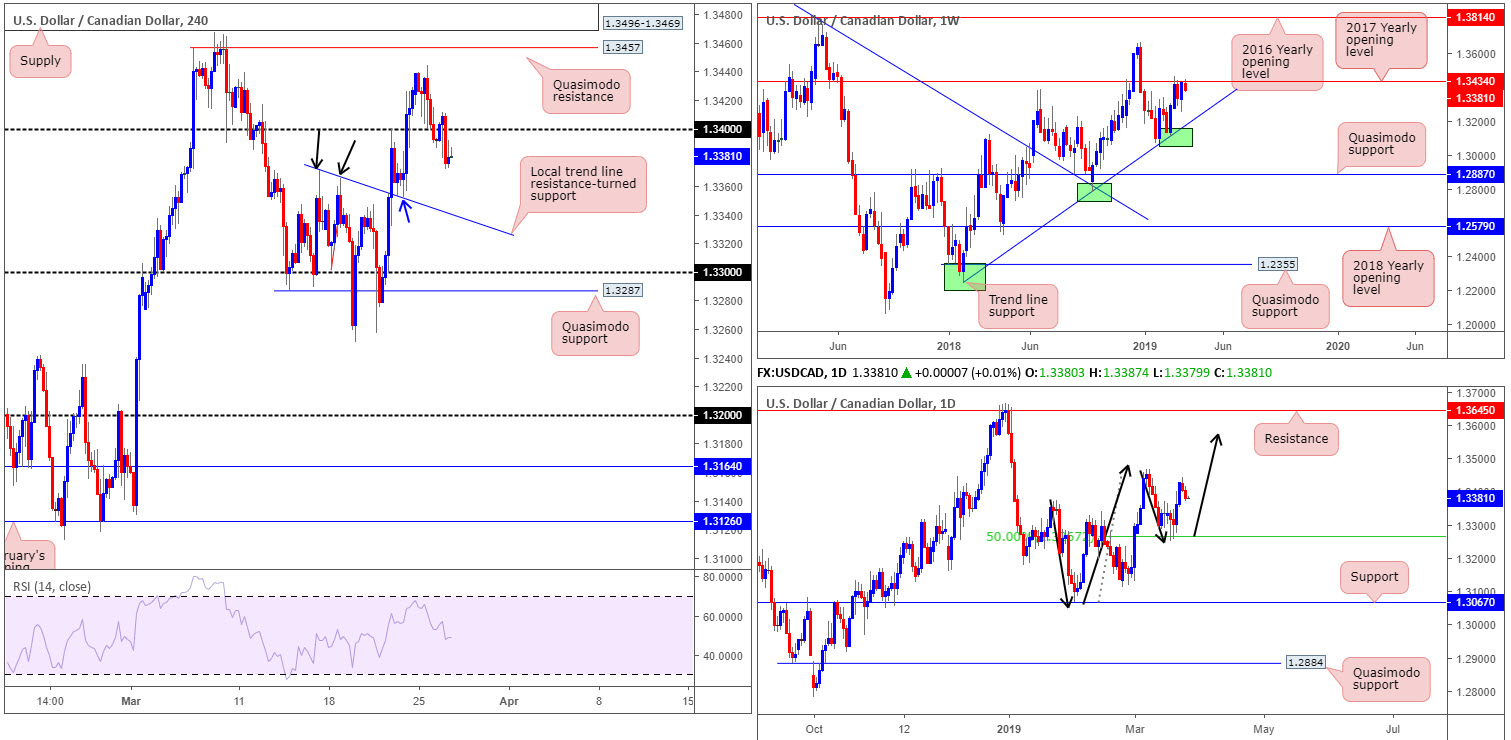
WTI exploring ground above its $60.00 mark saw Tuesday’s sessions overthrow the 1.34 handle on the H4 timeframe. Clearing buyers out from 1.34 and filling breakout sellers’ orders sees the next area of interest fall in around a local trend line resistance-turned support (taken from the high 1.3371). Beyond here, traders likely have their crosshairs fixed on the 1.33 handle, followed closely by Quasimodo support at 1.3287.
The odds of price pushing lower are strong, according to the weekly timeframe’s structure. In recent weeks, the USD/CAD has been engaging with notable resistance at 1.3434 (the 2017 yearly opening level) following an impressive rally from trend line support (taken from the low 1.2247). The next downside target from here can be seen at trend line support (extended from the low 1.2247).
On the other side of the spectrum, daily action indicates it may be poised to approach higher ground this week. The higher high sported on March 7th at 1.3467 followed by a 50.0% retracement to 1.3265 which held firm, places the buyers in good stead to overthrow the said high and discover higher levels. With that being said, though, selling is being seen which could, fuelled by weekly resistance mentioned above at 1.3434, potentially drag price action towards 1.3265 for a second retest.
Areas of consideration:
Following yesterday’s break of 1.34, a retest to the underside of this barrier (preferably in the shape of a H4 bearish candlestick signal as this provides entry/risk levels to work with) opens up a possible intraday sell today (black arrows) back to the local trend line resistance-turned support highlighted above as an initial first take-profit target.
Today’s data points: FOMC Member George Speaks; Canadian Trade Balance.
USD/CHF:
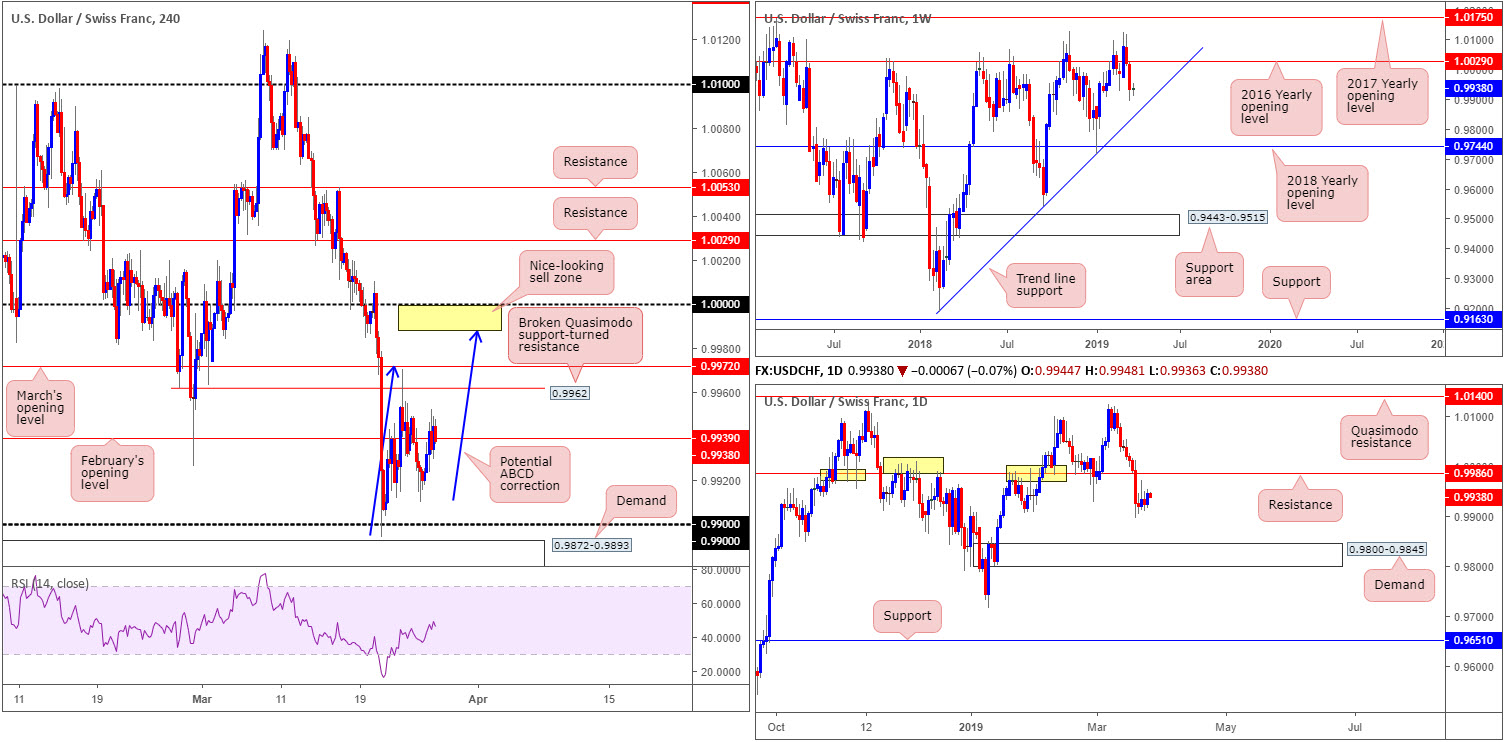
By all counts, it was a somewhat subdued session Tuesday, ranging no more than forty points on the day (+0.21%). February’s opening level at 0.9939 on the H4 timeframe, as you can see, served as reasonably strong resistance. Overhead, we have a nearby resistance (broken Quasimodo support-turned resistance) at 0.9962, shadowed closely by March’s opening level at 0.9972. Sub 0.9939, round number support at 0.99 is in sight, as is nearby demand plotted at 0.9872-0.9893. It might also interest some traders to note a potential ABCD (blue arrows) correction pattern that tops around 0.9988.
In terms of where the market stands on the weekly timeframe this morning, price action remains poised to approach trend line support (taken from the low 0.9187) after having seen the unit push lower from the 2016 yearly opening level at 1.0029. Daily flow, aside from the 0.9905 Jan 28 low that’s holding as temporary support, also demonstrates potential to charge as far south as demand plotted at 0.9800-0.9845. Another possibility, of course, is a retest of resistance coming in at 0.9986.
Areas of consideration:
The daily resistance mentioned above at 0.9986 is of interest today/this week as a possible sell zone. Traders may also like the fact it merges, assuming H4 price continues to push higher, with a ABCD bearish pattern at 0.9988. Between 1.0000 (parity) and 0.9988 (yellow), therefore, is a reasonably solid sell zone. As round numbers are prone to fakeouts, though, entering on additional confirmation is a point worth considering.
Entry and risk levels can be determined according to your chosen confirming method.
Today’s data points: FOMC Member George Speaks.
Dow Jones Industrial Average:
The DJIA initially took on an offensive phase Tuesday, led by the energy and financial sector, though swiftly turned sour after housing and consumer-confidence data weighed on sentiment.
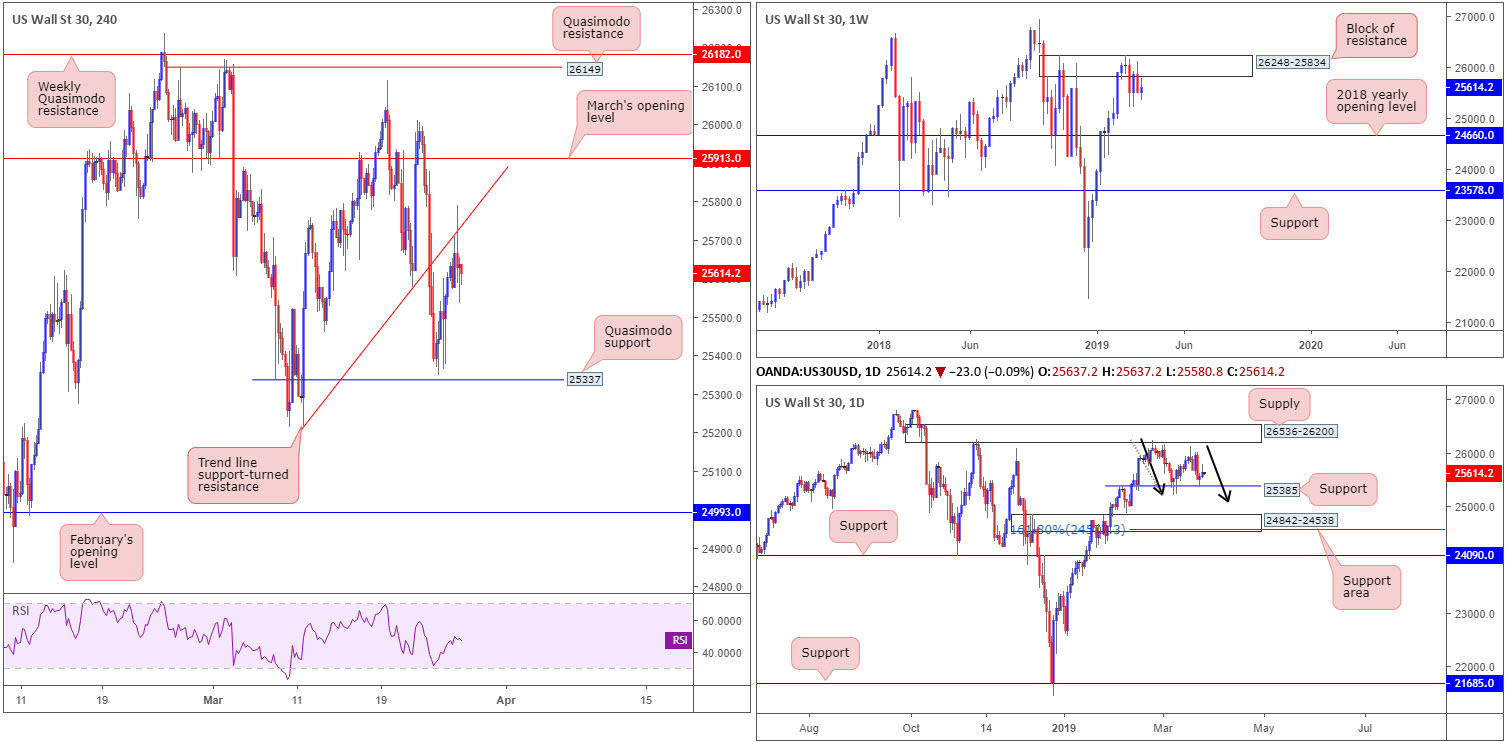
The technical picture reveals H4 movement crossed swords with a trend line support-turned resistance (taken from the low 25215) and, as is evident from the chart, held ground into the close. Price could continue to grind higher, clinging to the underside of this trend line, until we connect with March’s opening level at 25913. Another alternative is for a push to the downside from current price, targeting Quasimodo support at 25337.
Since early February, traders have called a block of resistance at 26248-25834 home on the weekly timeframe. Last week’s response from this barrier was of notable strength, closing not too far off its lows. Further downside from this point could eventually see the index knocking on the door of its 2018 yearly opening level at 24660.
Support at 25385 on the daily timeframe elbowed its way into the fight Monday and extended gains Tuesday, which has hindered weekly selling. A push beneath this number, nonetheless, will likely bring in a possible daily ABCD bullish motion (black arrows) terminating around 25112. Traders may also want to acknowledge a nearby daily support area seen at 24842-24538 which holds within it a 161.8% Fibonacci extension at 24588 (an addition to the aforesaid ABCD formation).
Areas of consideration:
Entering short from the aforementioned H4 trend line support-turned resistance could be something to consider, given how close we’re trading from the underside of the current weekly resistance area at 26248-25834. Though do bear in mind, selling entails potentially going up against daily buyers from support at 25385.
Should we test the H4 Quasimodo support underlined above at 25337, the research team believes a bounce higher could be in the offing, due to the level fusing closely with daily support priced in at 25385. The only caveat here, of course, is the threat of selling on the weekly timeframe towards 24660. As such, trading 25337 with additional confirmation, be it on the H4 or lower timeframes, is recommended. Not only will this help identify buyer interest, it’d also provide entry and risk levels to work with.
Today’s data points: FOMC Member George Speaks.
XAU/USD (GOLD):
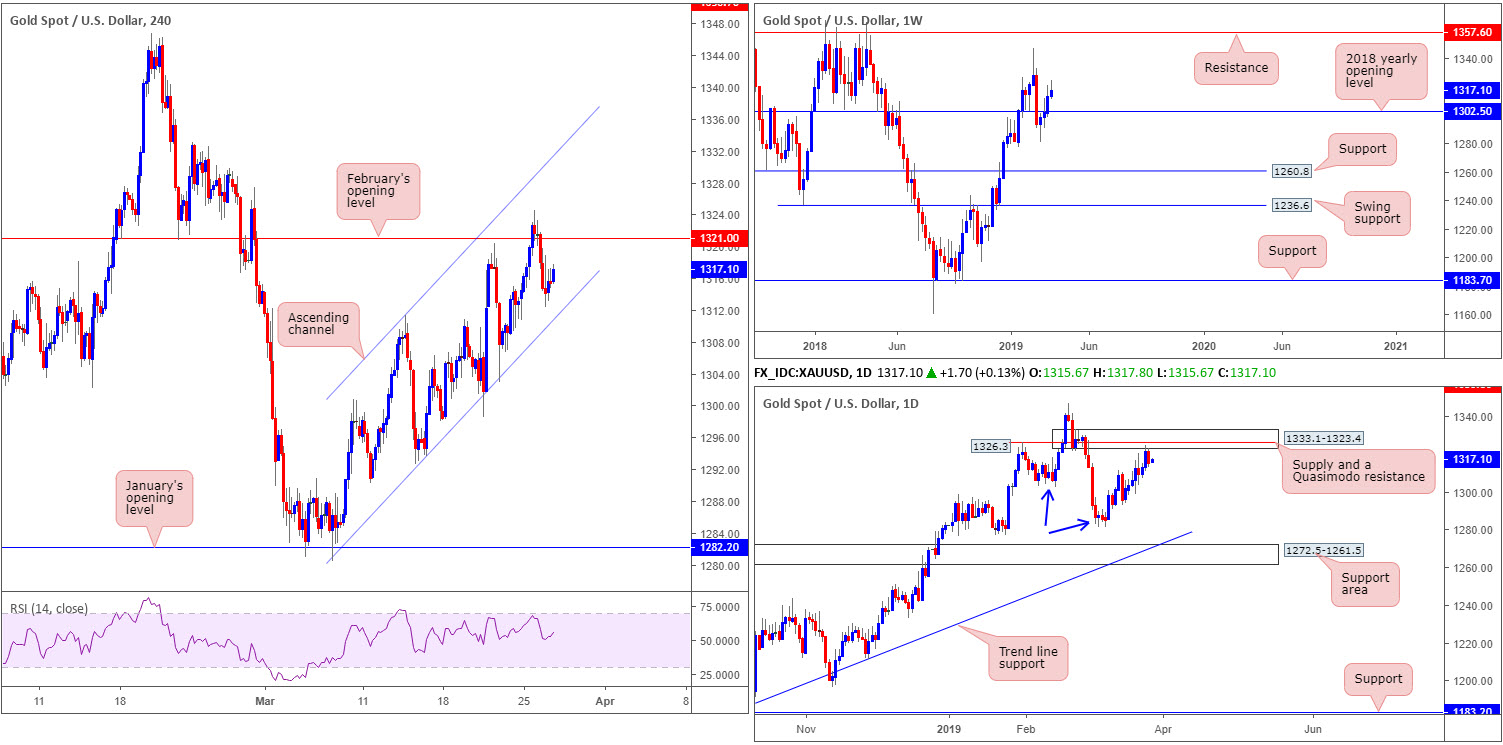
XAU/USD bulls, as you can see, lost their flavour at highs of 1324.5 Monday, peaks not seen since late February. Erasing 0.48% Tuesday, the price of gold fell sharply from the underside of a daily supply zone coming in at 1333.1-1323.4, which houses within it a Quasimodo resistance level at 1326.3. This supply commands additional weight in that we printed a lower low at 1281.0 (March 7), breaking the 1302.4 Feb 14 low (blue arrows), potentially signalling a shift to the downside.
Contrary to daily flow, however, the technical landscape on the weekly timeframe, after clearing its 2018 yearly opening level at 1302.5, displays a reasonably clear run towards the 1346.7 Feb 18 high, as well as nearby resistance parked at 1357.6.
A closer reading of price action on the H4 timeframe saw the candles fail to sustain gains beyond February’s opening level at 1321.0, likely helped by the fact daily supply mentioned above at 1333.1-1323.4 recently entered the fray. In addition to this, price has also been compressing within an ascending channel pattern (low: 1280.4 high: 1311.3) since March 7.
Areas of consideration:
While the threat of further buying on the weekly timeframe is there, the daily supply area currently in motion is appealing. To confirm downside presence, traders are urged to wait for a H4 close to print beyond the current channel support. This, given we’re coming from daily supply, is likely enough to encourage further selling.
Ultimately, a retest to the underside of the broken channel support as resistance is favoured, targeting the 2018 yearly opening level underlined above on the weekly timeframe at 1302.5. An added bonus would be H4 price chalking up a candlestick signal at the retest, consequently identifying seller intent and also serving as a base to determine entry and risk levels.
The accuracy, completeness and timeliness of the information contained on this site cannot be guaranteed. IC Markets does not warranty, guarantee or make any representations, or assume any liability with regard to financial results based on the use of the information in the site.
News, views, opinions, recommendations and other information obtained from sources outside of www.icmarkets.com.au, used in this site are believed to be reliable, but we cannot guarantee their accuracy or completeness. All such information is subject to change at any time without notice. IC Markets assumes no responsibility for the content of any linked site. The fact that such links may exist does not indicate approval or endorsement of any material contained on any linked site.
IC Markets is not liable for any harm caused by the transmission, through accessing the services or information on this site, of a computer virus, or other computer code or programming device that might be used to access, delete, damage, disable, disrupt or otherwise impede in any manner, the operation of the site or of any user’s software, hardware, data or property.


