
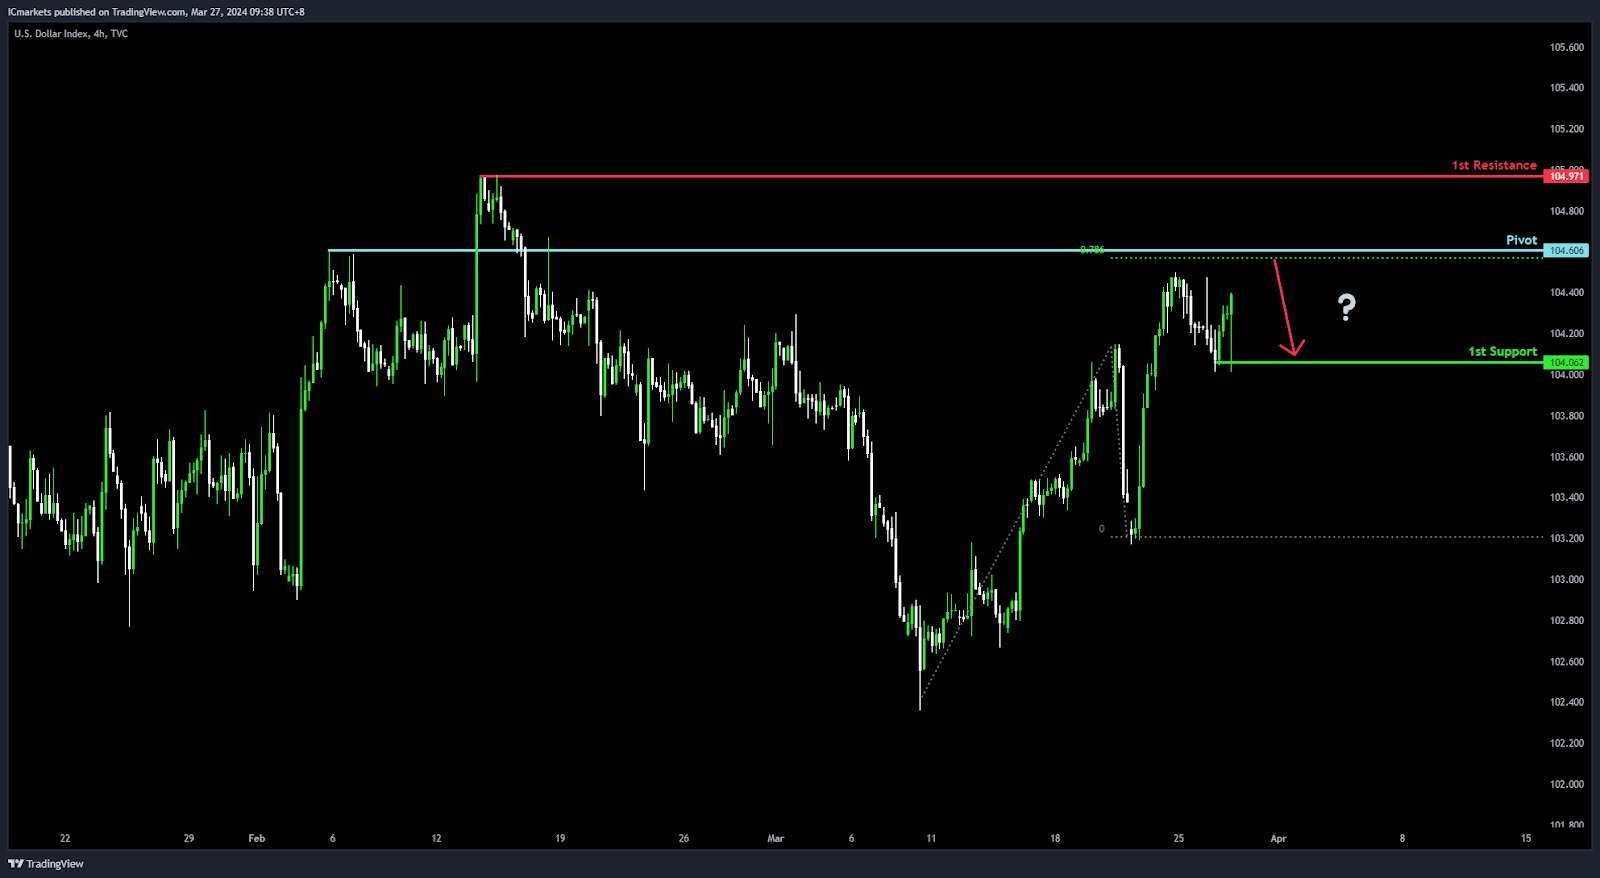
DXY:
Potential Direction: Bearish
Overall momentum of the chart: Bullish
Price could potentially make a bearish reaction off pivot and drop to 1st support
Pivot: 104.60
Supporting reasons: Acts as an Overlap resistance, a key level where selling pressure may increase, suggesting a pivotal spot for potential downturns in price movement.
1st support: 104.06
Supporting reasons: Known as Multi-swing low support, indicating a strong area that could halt further declines, showing its importance as a base for potential price stabilization or a rebound.
1st resistance: 104.97
Supporting reasons: Identified as Multi-swing high resistance, marking a significant barrier that has previously limited upward movements, highlighting its role as a crucial threshold for price action
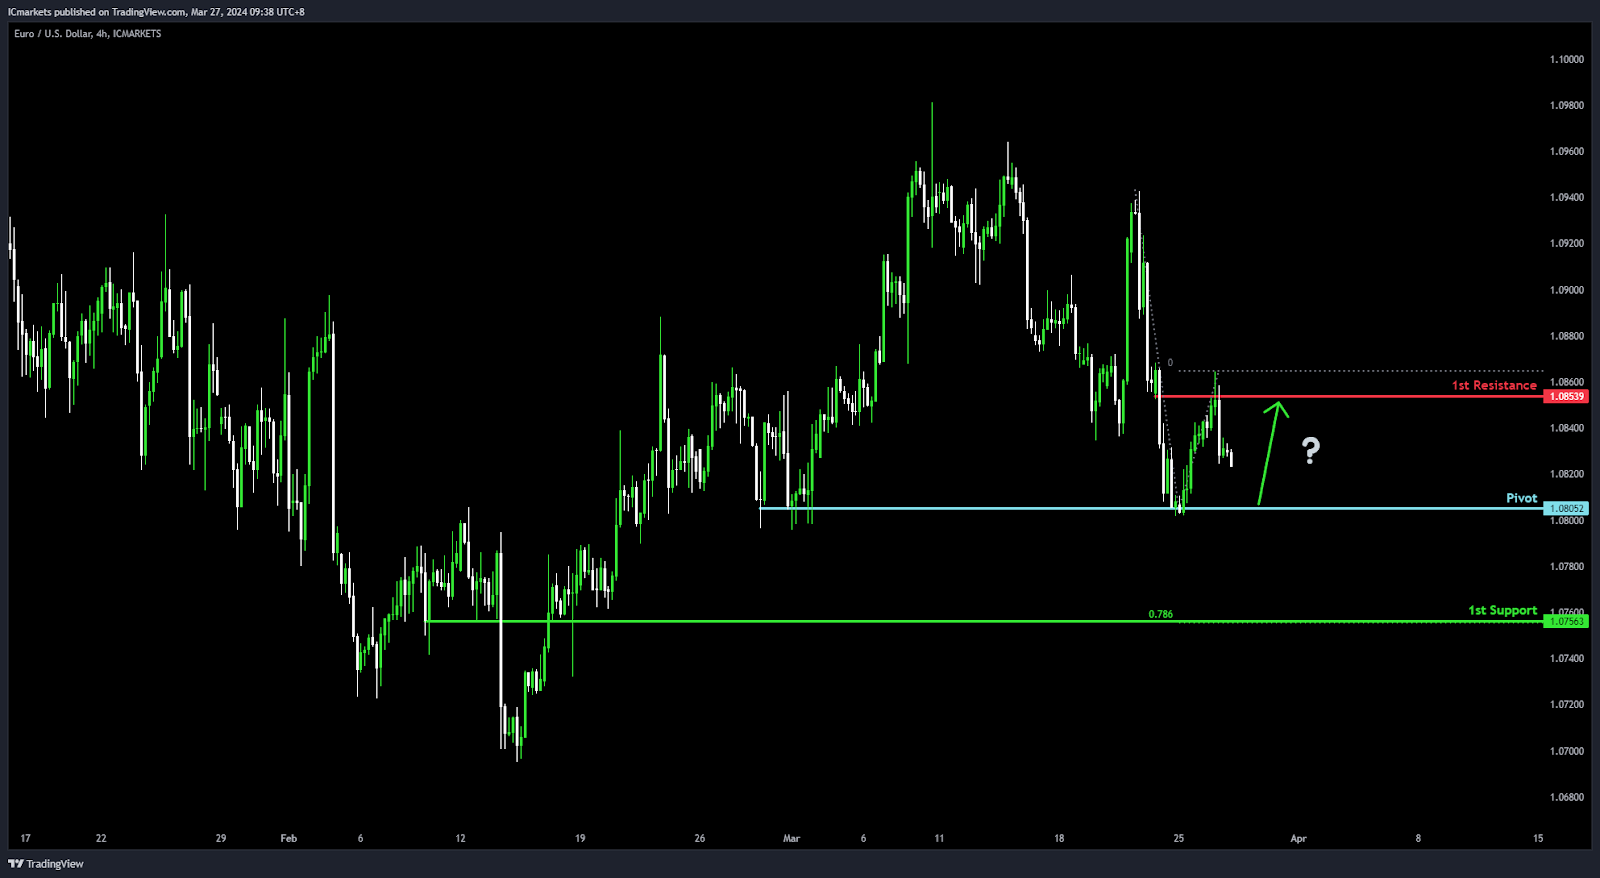
EUR/USD:
Potential Direction: Bullish
Overall momentum of the chart: Bearish
Price could potentially make a bullish bounce-off pivot and head toward 1st resistance
Pivot: 1.0805
Supporting reasons: Serves as Multi-swing low support, a critical area where buying pressure has historically been strong enough to initiate upward movements, indicating its significance as a launchpad for potential rallies.
1st support: 1.0756
Supporting reasons: Known as Pullback support with a 78.60% Fibonacci Projection, marking a significant level where the market has found support in the past, offering a solid foundation for buyers and potentially halting further declines.
1st resistance: 1.0853
Supporting reasons: Acts as an Overlap resistance, a key level where selling pressure may emerge, suggesting it’s an important threshold for price action, possibly capping upward momentum as traders watch for a reversal or continuation of the trend.
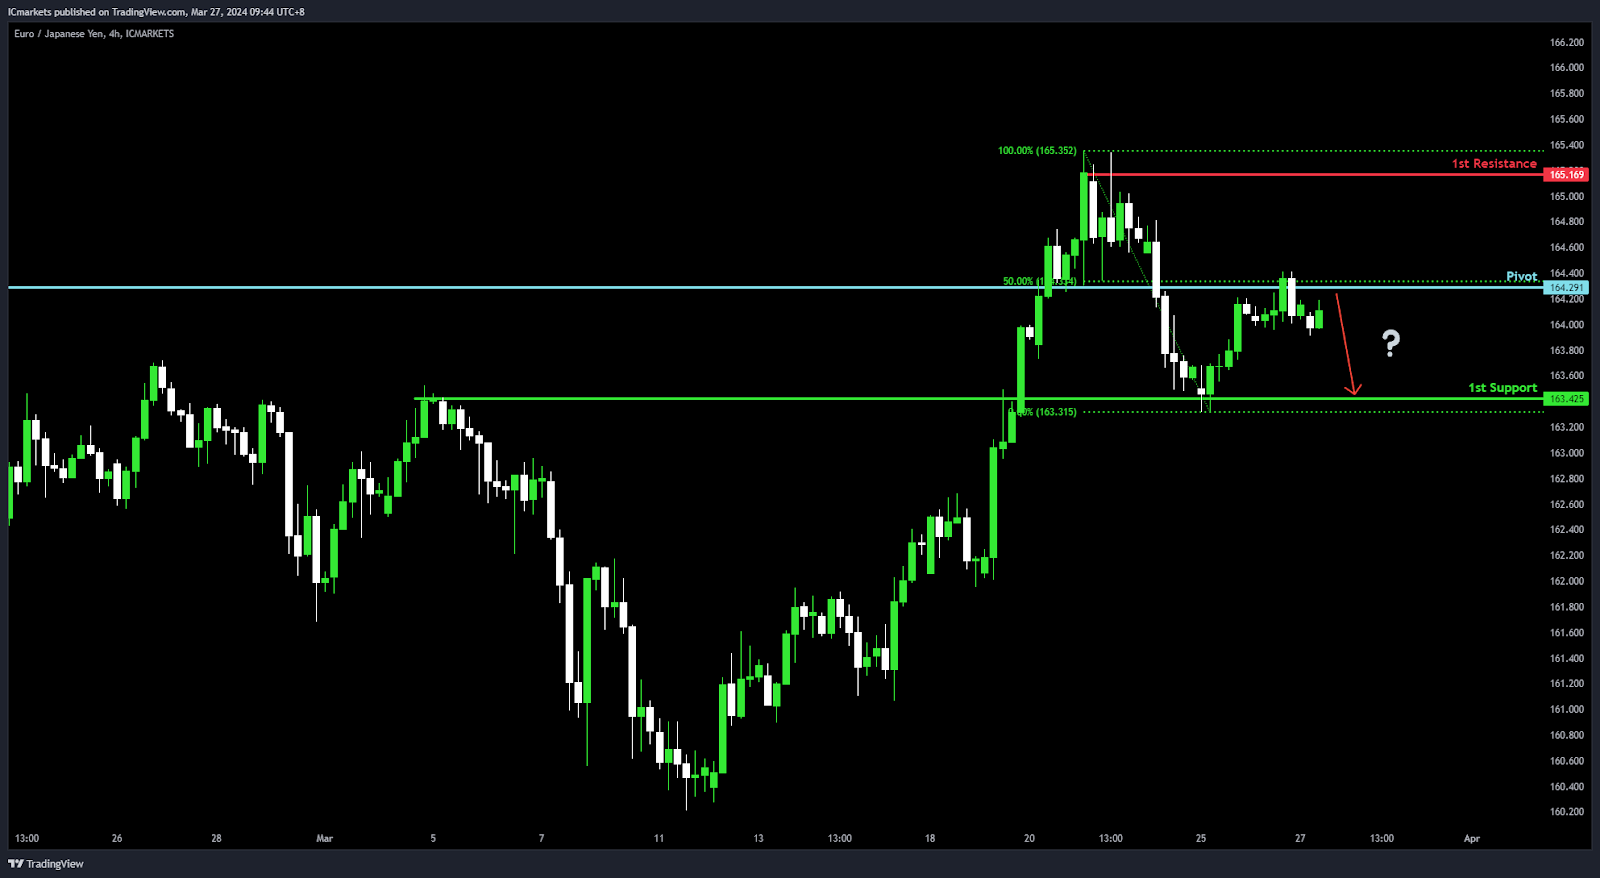
EUR/JPY:
Potential Direction: Bearish
Overall momentum of the chart: Bullish
Price could potentially make a bearish continuation towards 1st support
Pivot: 164.29
Supporting reasons: Acts as Pullback resistance with a 50% Fibonacci Retracement, marking a key level where sellers might gain strength, suggesting a potential shift in price direction downward.
1st support: 163.42
Supporting reasons: Known as an Overlap support, indicating a significant area where the market has historically found support, offering a base for potential price stabilization or a rebound.
1st resistance: 165.16
Supporting reasons: Characterized by Multi-swing high resistance, a major barrier that has previously limited upward movements, highlighting its role as a crucial threshold for bullish efforts to overcome.
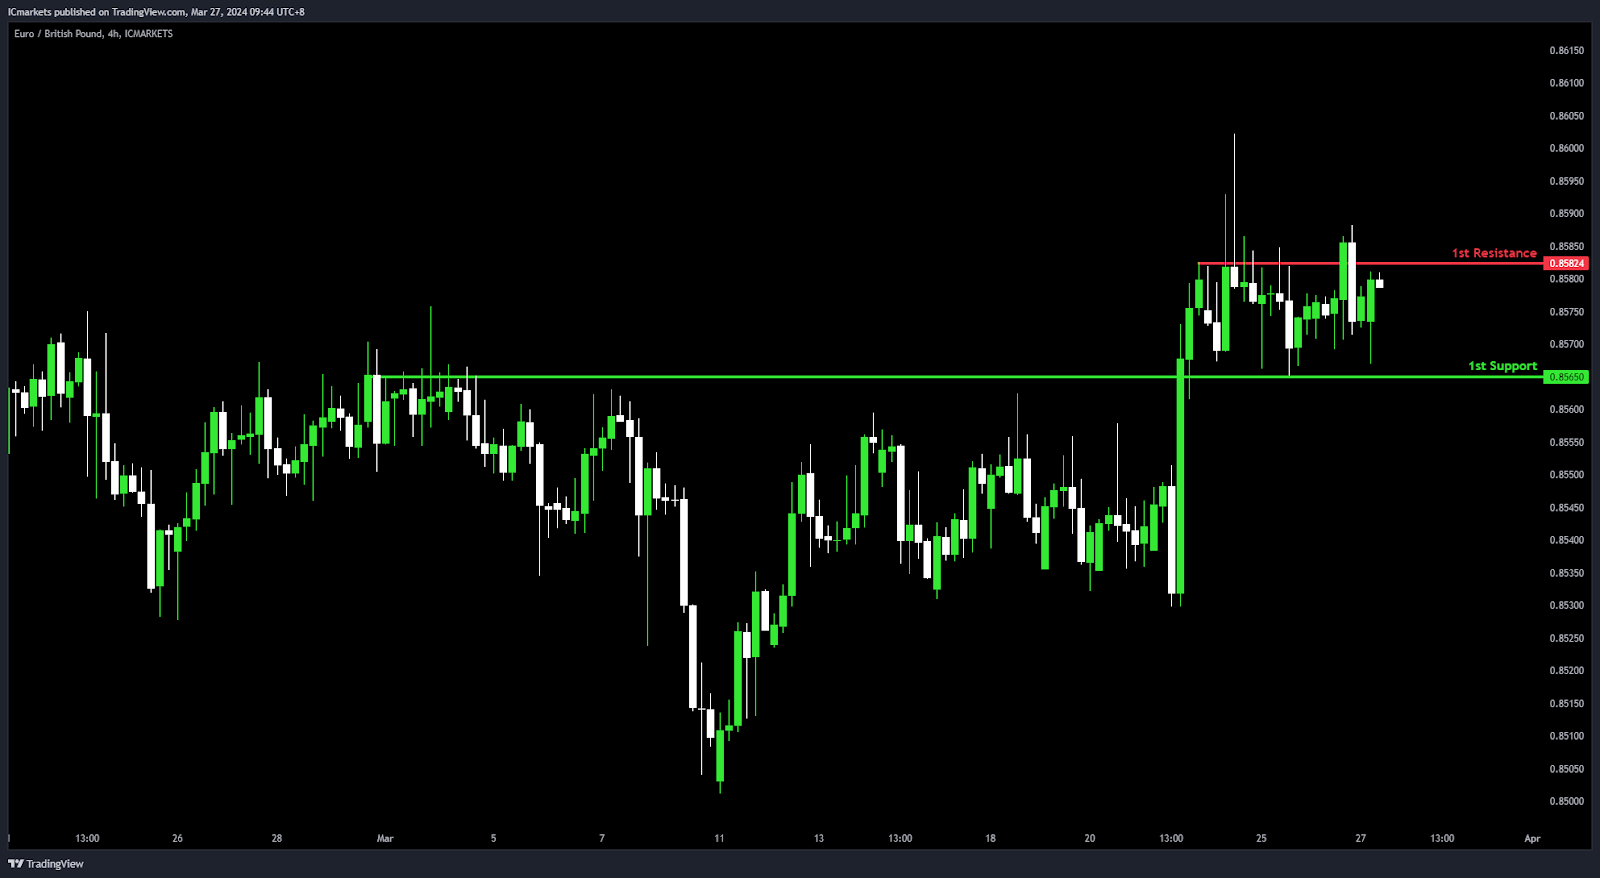
EUR/GBP:
Potential Direction: Neutral
Overall momentum of the chart: Neutral
Price could potentially fluctuate between the 1st resistance and 1st support level.
1st support: 0.8565
Supporting reasons: Acts as an Overlap support, indicating a strong area where buying interest has historically been present, offering a foundation for price stabilization or potential upward movement.
1st resistance: 0.8582
Supporting reasons: Characterized by Multi-swing high resistance, a key barrier that has capped previous attempts to move higher, highlighting its significance as a threshold for price action, possibly limiting further advances.
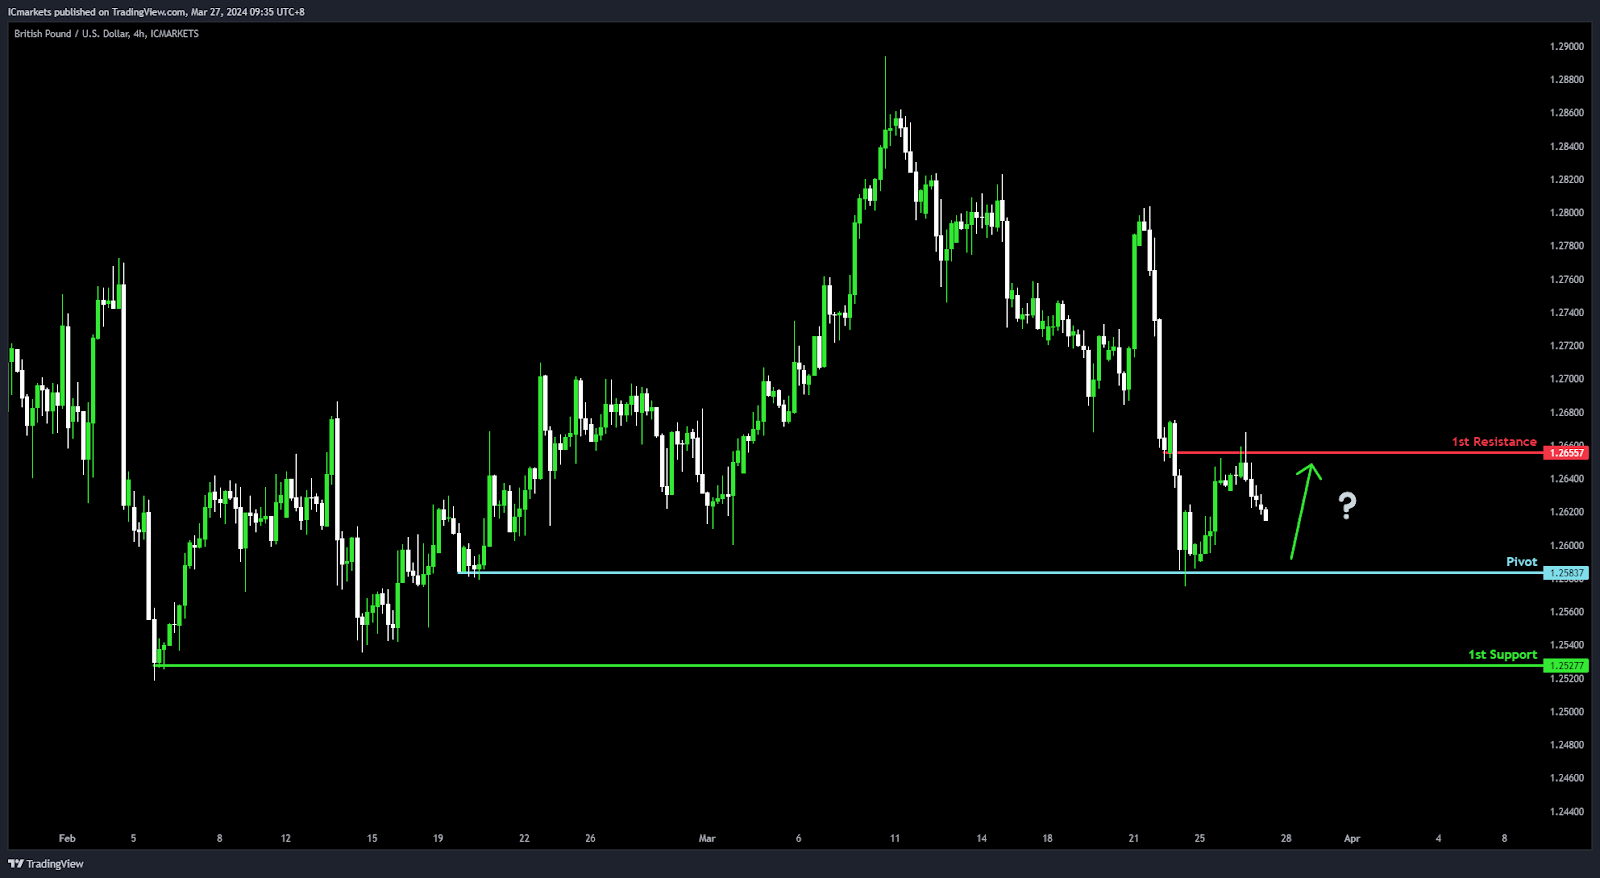
GBP/USD:
Potential Direction: Bullish
Overall momentum of the chart: Bearish
Price could potentially make a bullish bounce-off pivot and head toward 1st resistance
Pivot: 1.2527
Supporting reasons: Acts as Multi-swing low support, indicating a strong base where buying pressure has historically mounted, suggesting a key level for potential upward movement.
1st support: 1.2475
Supporting reasons: Multi-swing low support, reinforcing the pivot as a critical area for buyers, potentially offering a double layer of support to initiate a bullish reversal.
1st resistance: 1.2655
Supporting reasons: Known as an Overlap resistance, a significant level that could limit further advances, marking a crucial point for the price to overcome for continued bullish momentum.
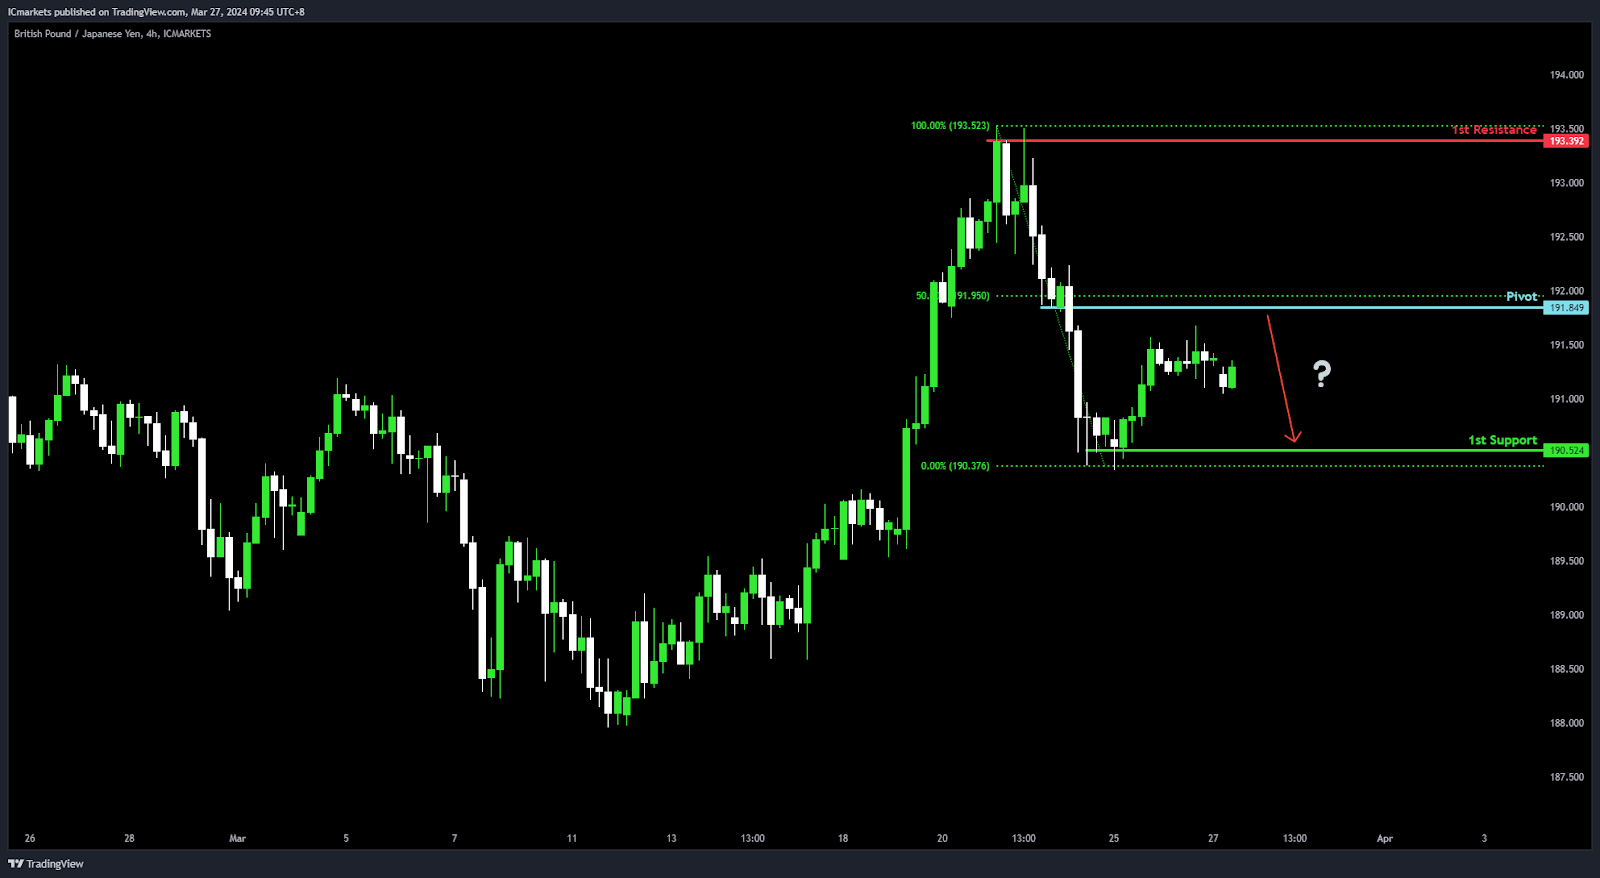
GBP/JPY:
Potential Direction: Bearish
Overall momentum of the chart: Bullish
Price could potentially make a bearish reaction off pivot and drop to 1st support
Pivot: 191.84
Supporting reasons: Acts as Pullback resistance with a 50% Fibonacci Retracement, marking a significant level where selling pressure could intensify, leading to a potential downward movement in price.
1st support: 190.52
Supporting reasons: Known as Multi-swing low support, indicating a strong area where buying interest has previously been significant, offering a foundation for potential stabilization or a rebound in price.
1st resistance: 193.39
Supporting reasons: Characterized by Multi-swing high resistance, a major barrier that has capped previous upward movements, highlighting its importance as a threshold for the price to overcome for bullish continuation.
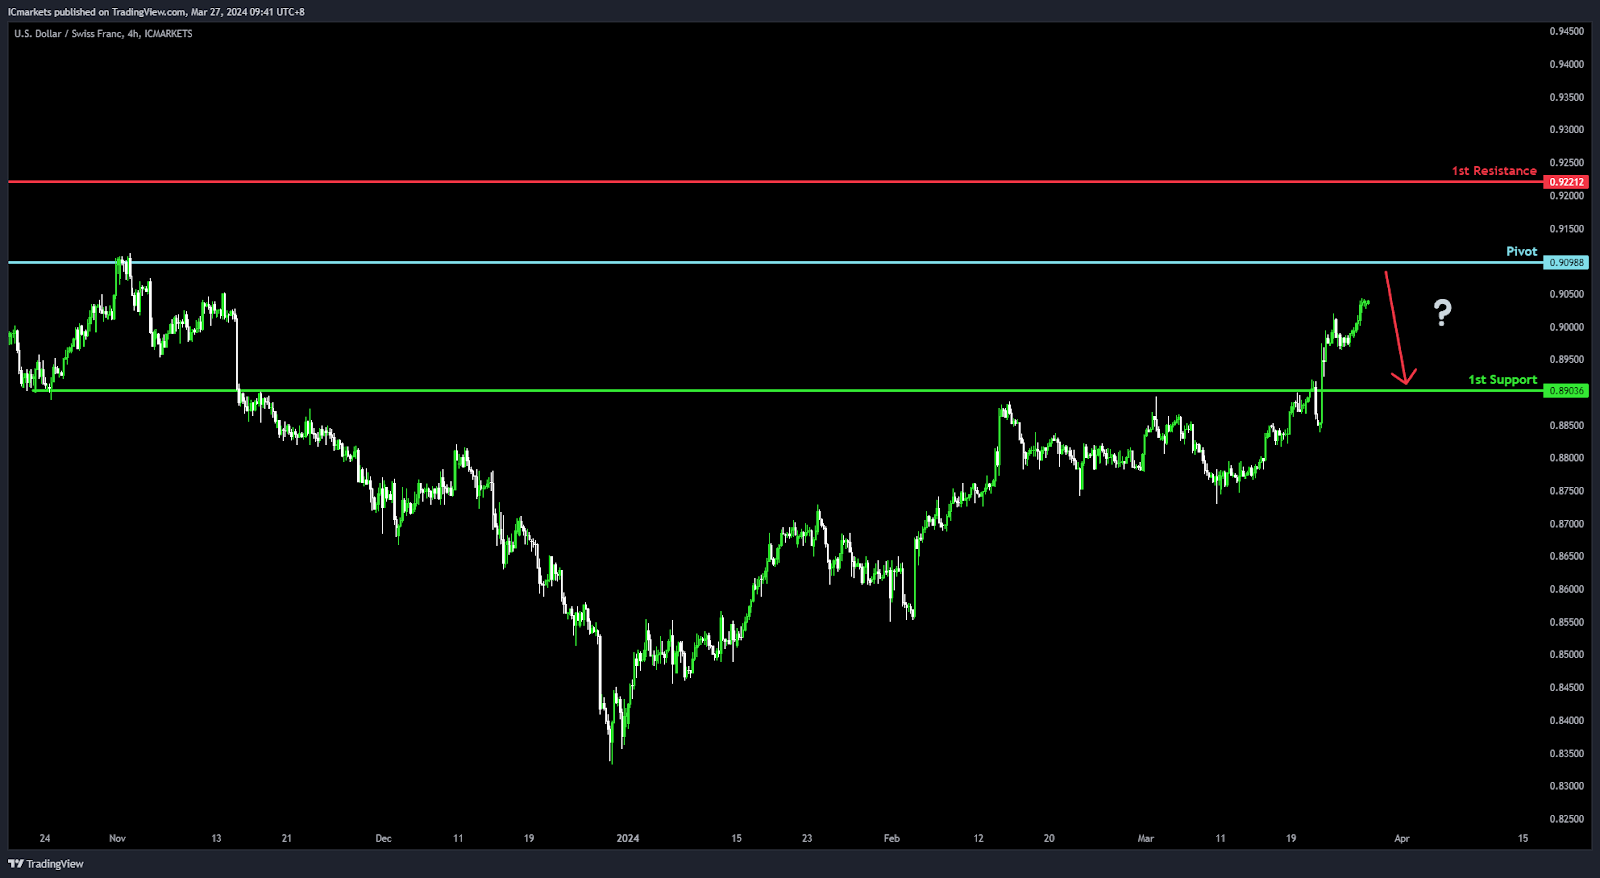
USD/CHF:
Potential Direction: Bearish
Overall momentum of the chart: Bullish
Price could potentially make a bearish reaction off pivot and drop to 1st support
Pivot: 0.9098
Supporting reasons: Acts as an Overlap resistance, a crucial level where selling pressure could intensify, suggesting a potential turning point for price to head downwards.
1st support: 0.8903
Supporting reasons: Known as Pullback support, indicating a significant area where the market has found support previously, offering a foundation for potential stabilization or a rebound in price.
1st resistance: 0.9221
Supporting reasons: Identified as Multi-swing high resistance, marking a key barrier that has previously capped upward movements, highlighting its importance as a critical threshold for the bullish trend to overcome.
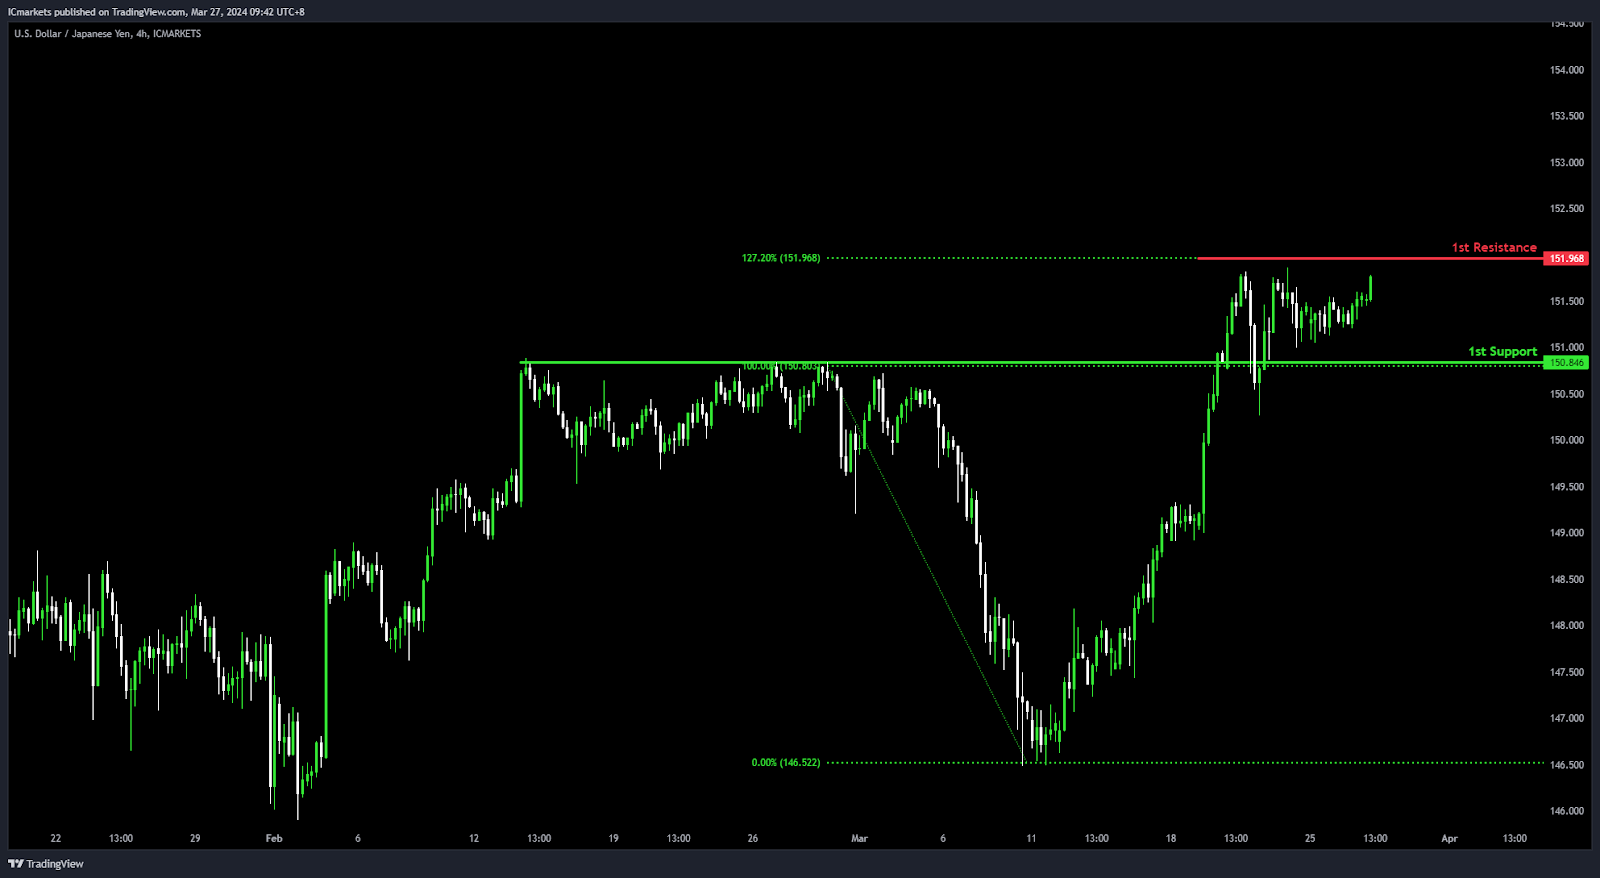
USD/JPY:
Potential Direction: Neutral
Overall momentum of the chart: Neutral
Price could potentially: Fluctuate between the 1st resistance and 1st support level.
1st support: 150.84
Supporting reasons: Acts as an Overlap support, a key level where buyers have historically stepped in, suggesting it could serve as a strong foundation to prevent further declines and potentially trigger upward movements.
1st resistance: 151.96
Supporting reasons: Marked by a 127.20% Fibonacci Projection, indicating a significant barrier that could cap upward movements, making it a pivotal point for potential reversals or pauses in price action
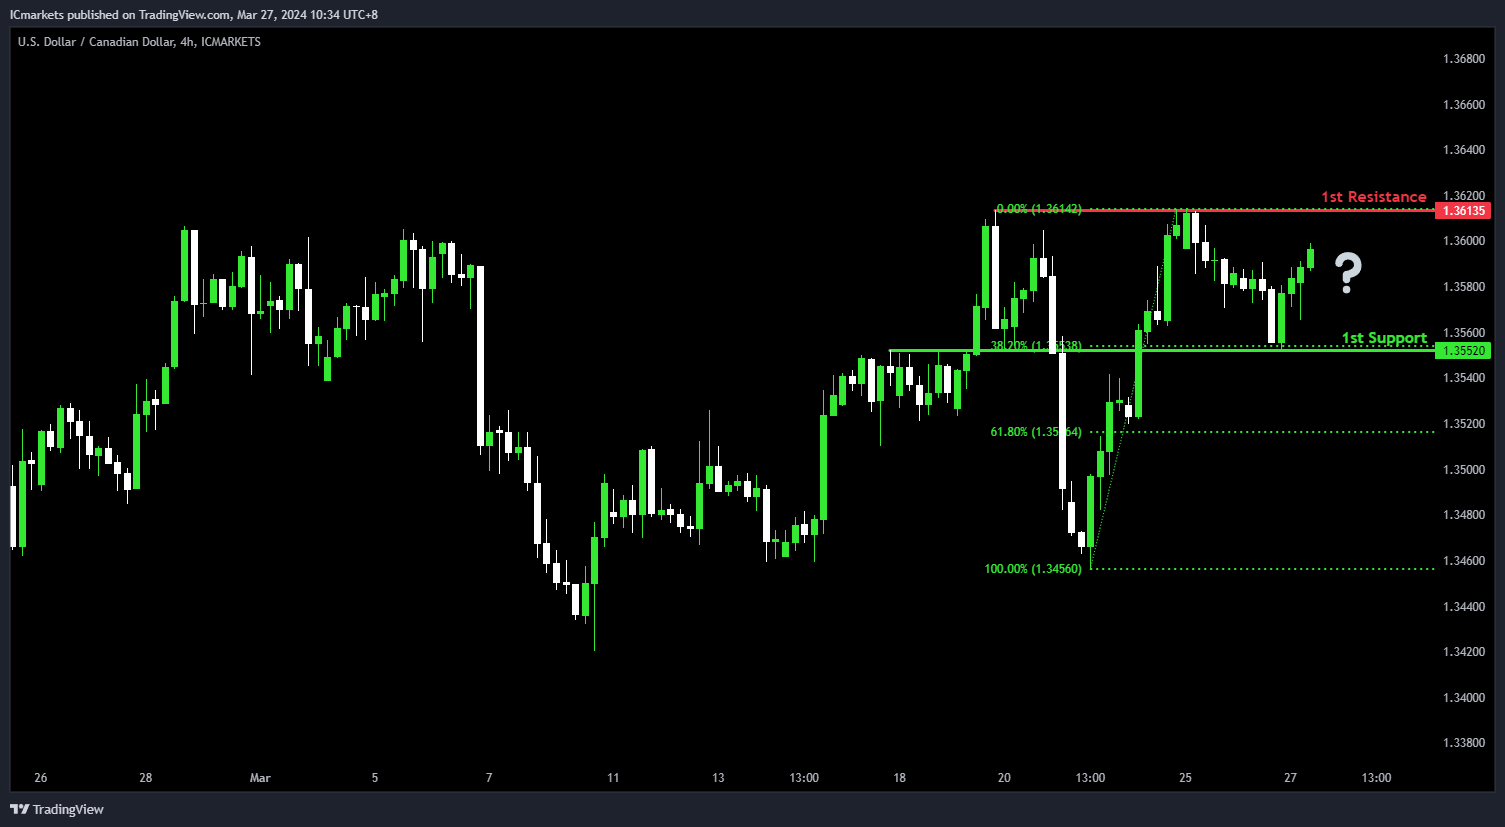
USD/CAD:
Potential Direction: Bullish
Overall momentum of the chart: Neutral
Price could potentially rise towards the 1st resistance and make a bearish reversal to drop towards the 1st support.
1st Support: 1.3552
Supporting reasons: This level acts as an overlap support that aligns close to a 38.2% Fibonacci retracement, indicating a level where the price has found strong support in the past.
1st Resistance: 1.3613
Supporting reasons: This level is identified as a multi-swing-high resistance, marking it as a critical threshold for bullish momentum to overcome; resistance at this level could cap further upside movements.
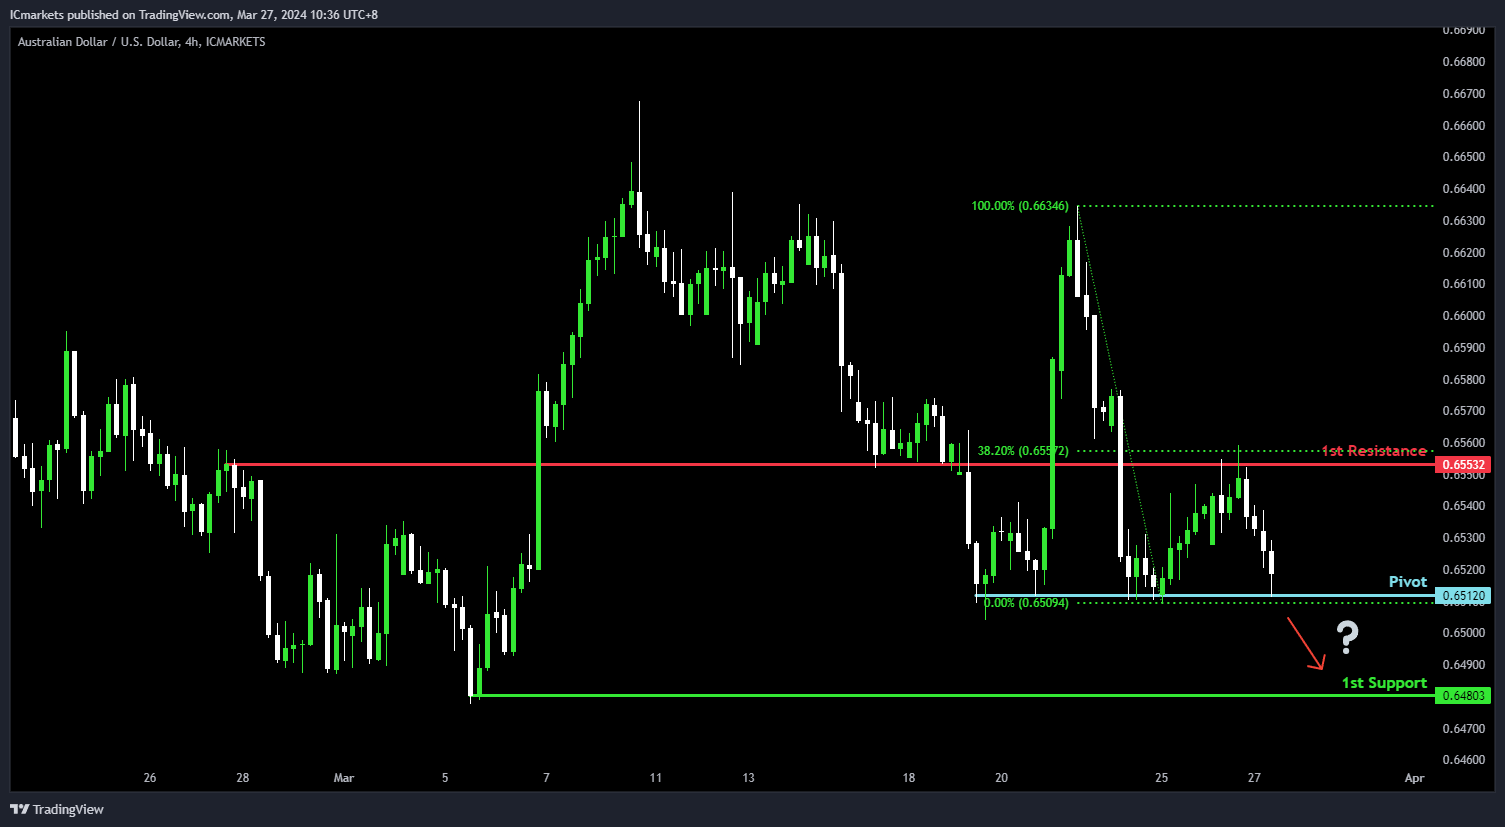
AUD/USD:
Potential Direction: Bearish
Overall momentum of the chart: Bearish
Price could potentially fall towards the pivot to make a bearish breakout and then drop towards the 1st support.
Pivot: 0.6512
Supporting reasons: This level acts as a pullback support. However, there is a potential scenario for price to break below this level today.
1st Support: 0.6480
Supporting reasons: This level acts as a pullback support, indicating a level where price has found strong support in the past.
1st Resistance: 0.6553
Supporting reasons: This level is identified as an overlap resistance that aligns close to a 38.2% Fibonacci retracement, marking it as a critical threshold for bullish momentum to overcome; resistance at this level could cap further upside movements.
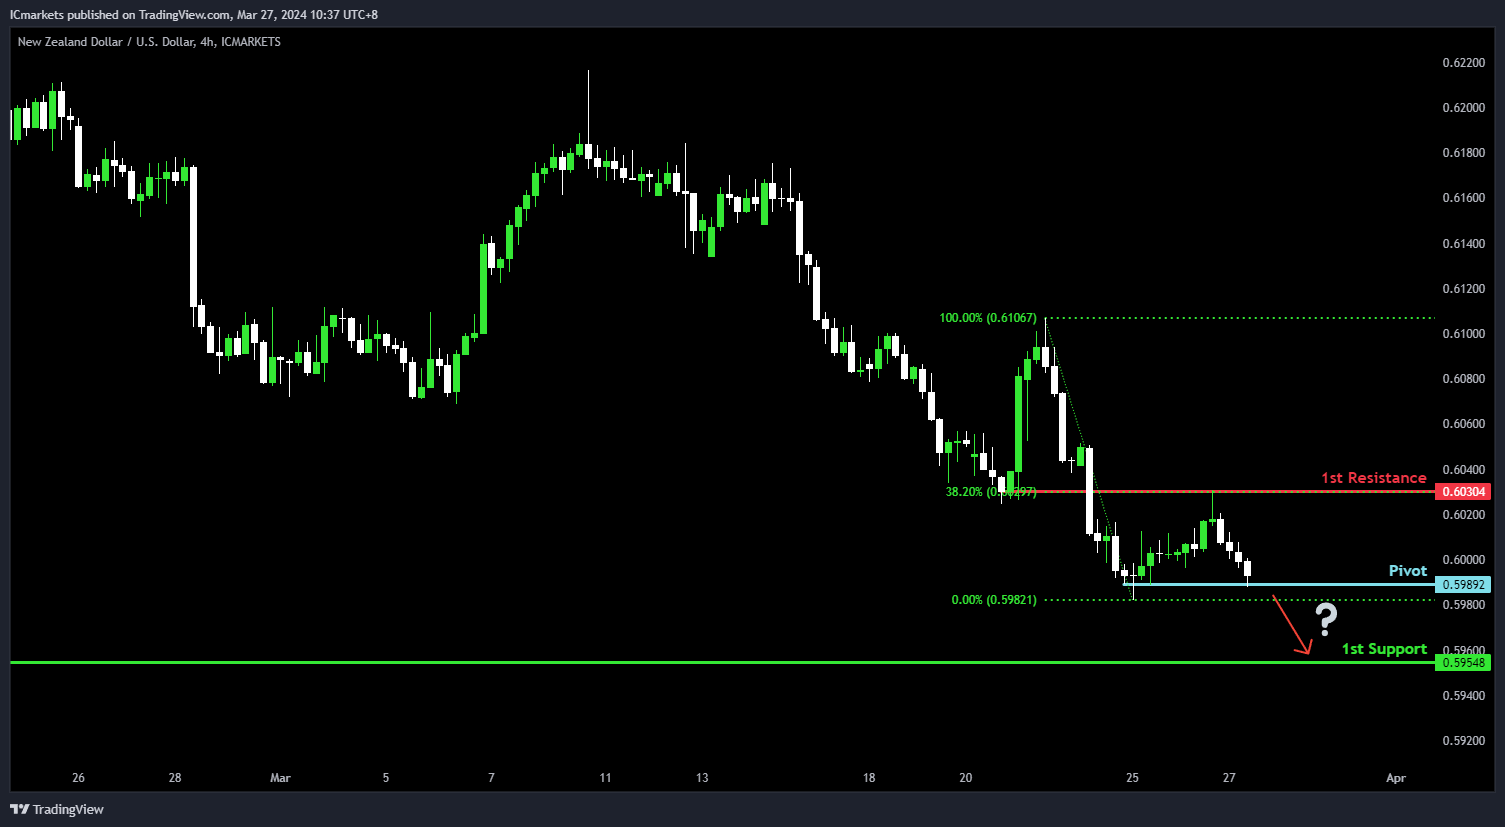
NZD/USD
Potential Direction: Bearish
Overall momentum of the chart: Bearish
Price could potentially fall towards the pivot to make a bearish breakout and then drop towards the 1st support.
Pivot: 0.5989
Supporting reasons: This level acts as a pullback support. However, there is a potential scenario for price to break below this level today.
1st Support: 0.5954
Supporting reasons: This level acts as an overlap support, indicating a level where price has found strong support in the past.
1st Resistance: 0.6030
Supporting reasons: This level is identified as an overlap resistance that aligns with a 38.2% Fibonacci retracement, marking it as a critical threshold for bullish momentum to overcome; resistance at this level could cap further upside movements.
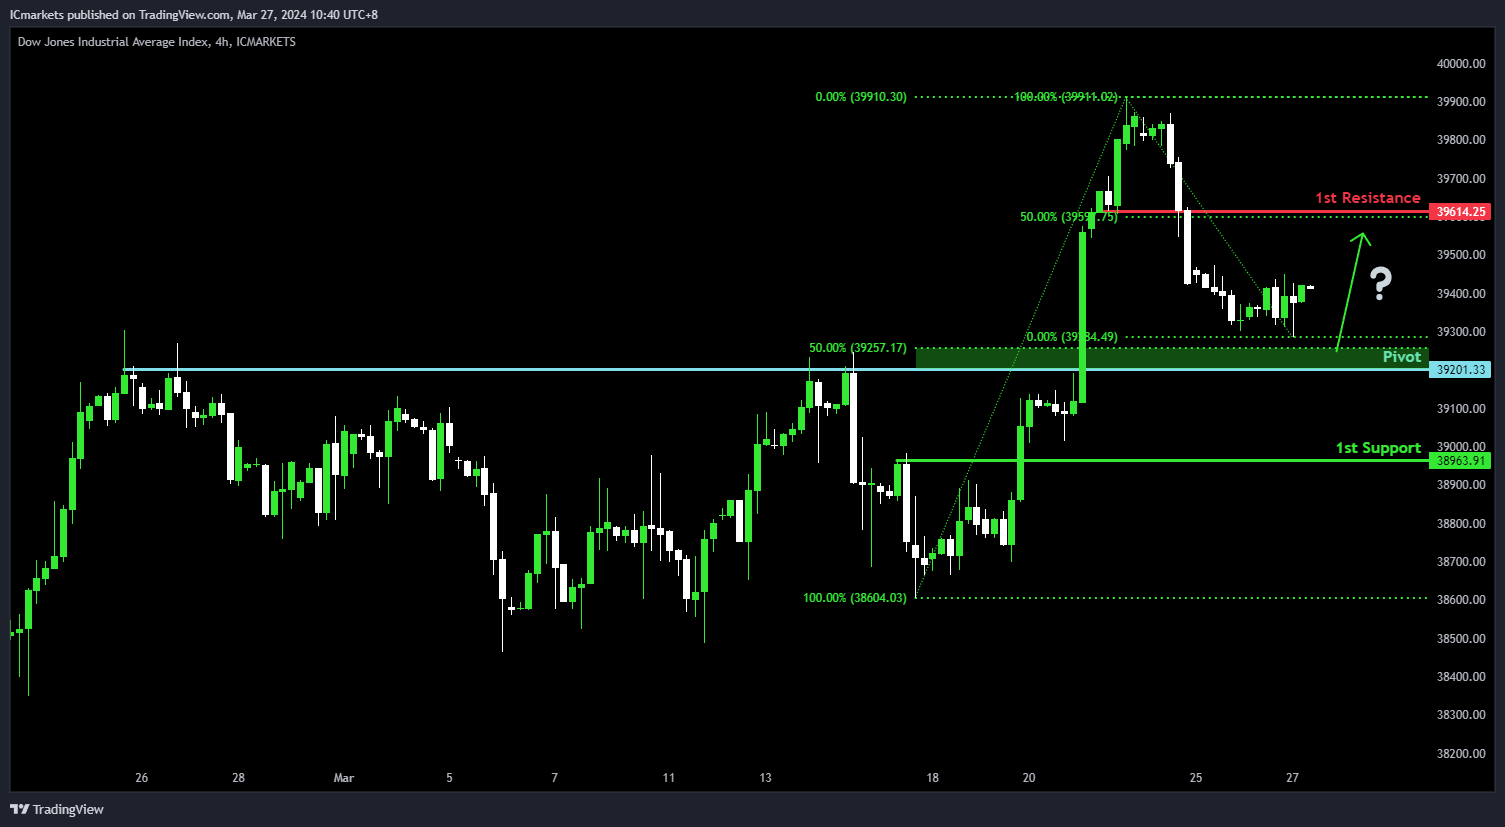
DJ30:
Potential Direction: Weak Bullish
Overall momentum of the chart: Neutral
Price could potentially make a bullish reaction off the pivot and rise toward the 1st resistance
Pivot: 39,201.33
Supporting reasons: This level acts as a pullback support that aligns with a 50% Fibonacci retracement, potentially initiating a bullish reversal if the level holds as support.
1st Support: 38,963.91
Supporting reasons: This level acts as a pullback support, indicating a level where the price has found strong support in the past.
1st Resistance: 39,614.25
Supporting reasons: This level is identified as a pullback resistance that aligns with a 50% Fibonacci retracement, marking it as a critical threshold for bullish momentum to overcome; resistance at this level could cap further upside movements.
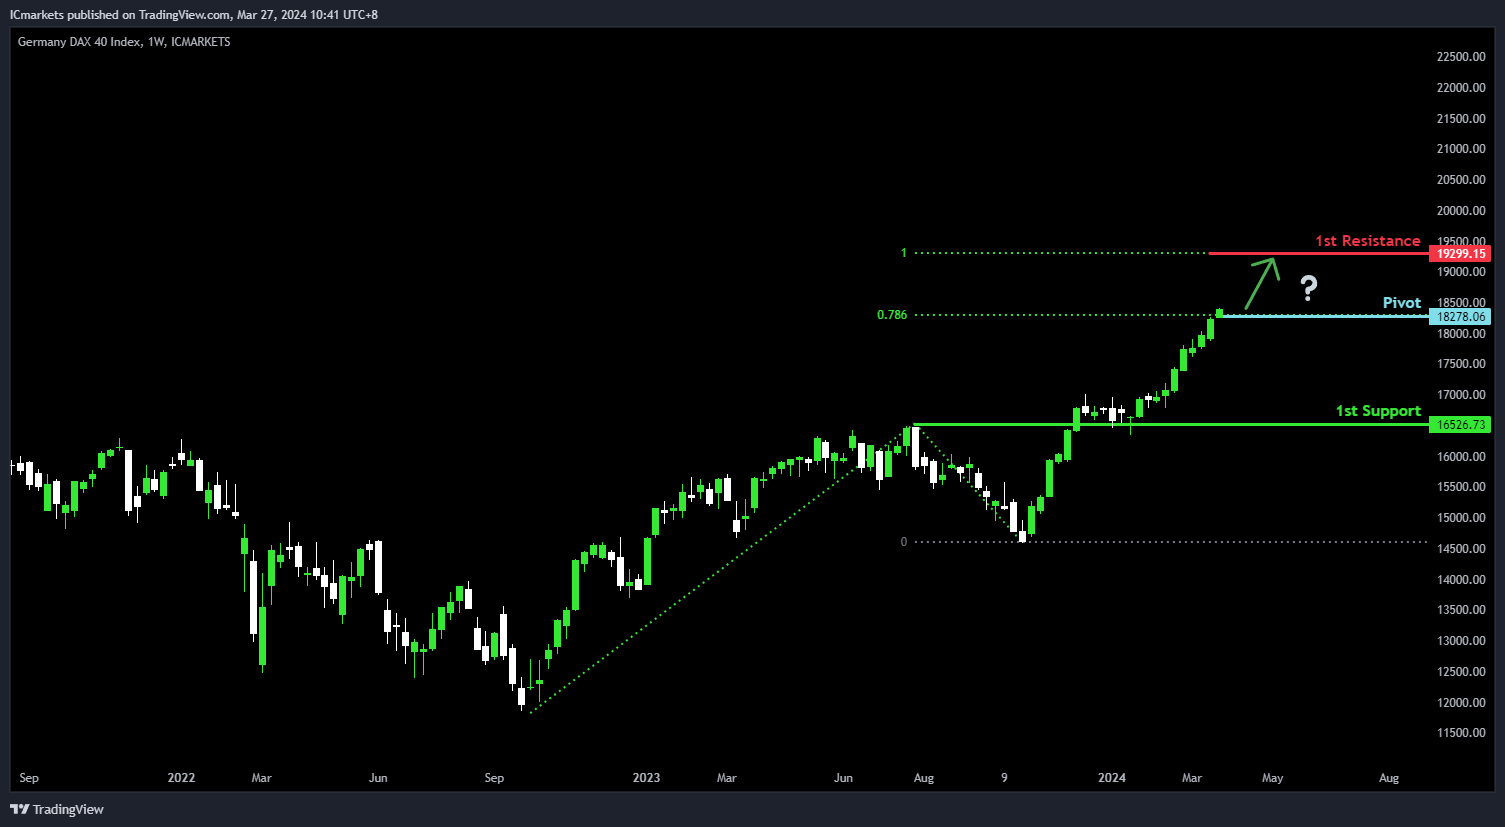
GER40:
Potential Direction: Bullish
Overall momentum of the chart: Bullish
Price could potentially rise toward the pivot to make a bullish breakout and rise towards the 1st resistance.
Pivot: 18,278.06
Supporting reasons: This level acts as a resistance level that aligns with a 100% Fibonacci projection. However, there is a potential scenario for price to break above this level today.
1st Support: 16,526.73
Supporting reasons: This level acts as an overlap support, indicating a level where price has found strong support in the past.
1st Resistance: 19,299.15
Supporting reasons: This level is identified as a resistance level that aligns with a 100% Fibonacci projection, marking it as a critical threshold for bullish momentum to overcome; resistance at this level could cap further upside movements.
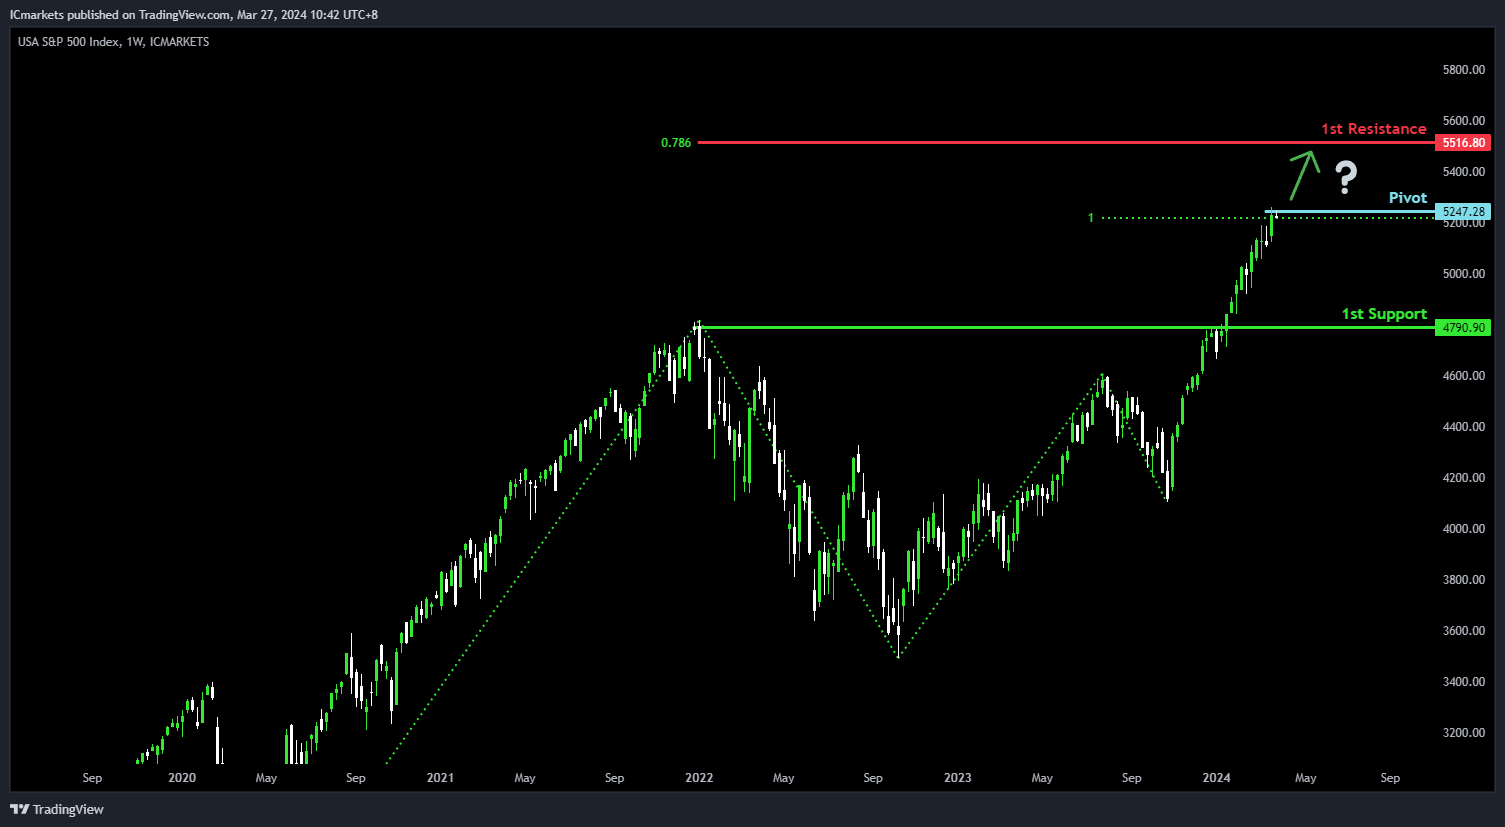
US500:
Potential Direction: Bullish
Overall momentum of the chart: Bullish
Price could potentially rise toward the pivot to make a bullish breakout and rise towards the 1st resistance.
Pivot: 5,247.28
Supporting reasons: This level acts as a resistance level that aligns with a 100% Fibonacci projection. However, there is a potential scenario for price to break above this level today.
1st Support: 4,790.90
Supporting reasons: This level acts as a pullback support, indicating a level where price has found strong support in the past.
1st Resistance: 5,516.80
Supporting reasons: This level is identified as a resistance level that aligns with a 78.6% Fibonacci projection, marking it as a critical threshold for bullish momentum to overcome; resistance at this level could cap further upside movements.
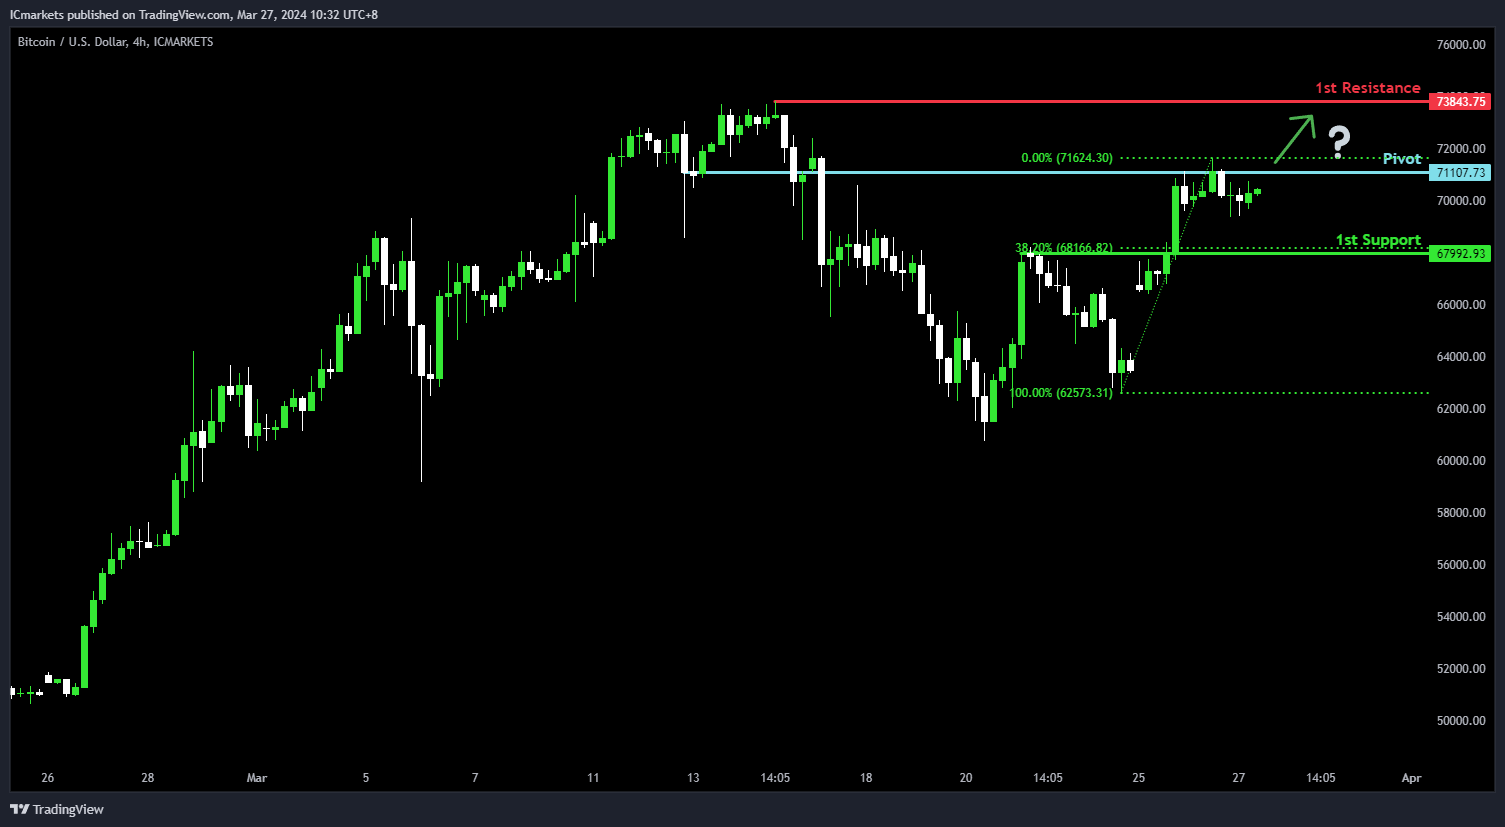
BTC/USD:
Potential Direction: Bullish
Overall momentum of the chart: Bullish
Price could potentially rise toward the pivot to make a bullish breakout and then rise towards the 1st resistance.
Pivot: 71,107.73
Supporting reasons: This level acts as an overlap resistance. However, there is a potential scenario for price to break above this level today.
1st Support: 67,992.93
Supporting reasons: This level acts as a pullback support that aligns close to a 38.2% Fibonacci retracement, indicating a level where price has found strong support in the past.
1st Resistance: 73,843.75
Supporting reasons: This level is identified as a swing-high resistance at the all-time high, marking it as a critical threshold for bullish momentum to overcome; resistance at this level could cap further upside movements.
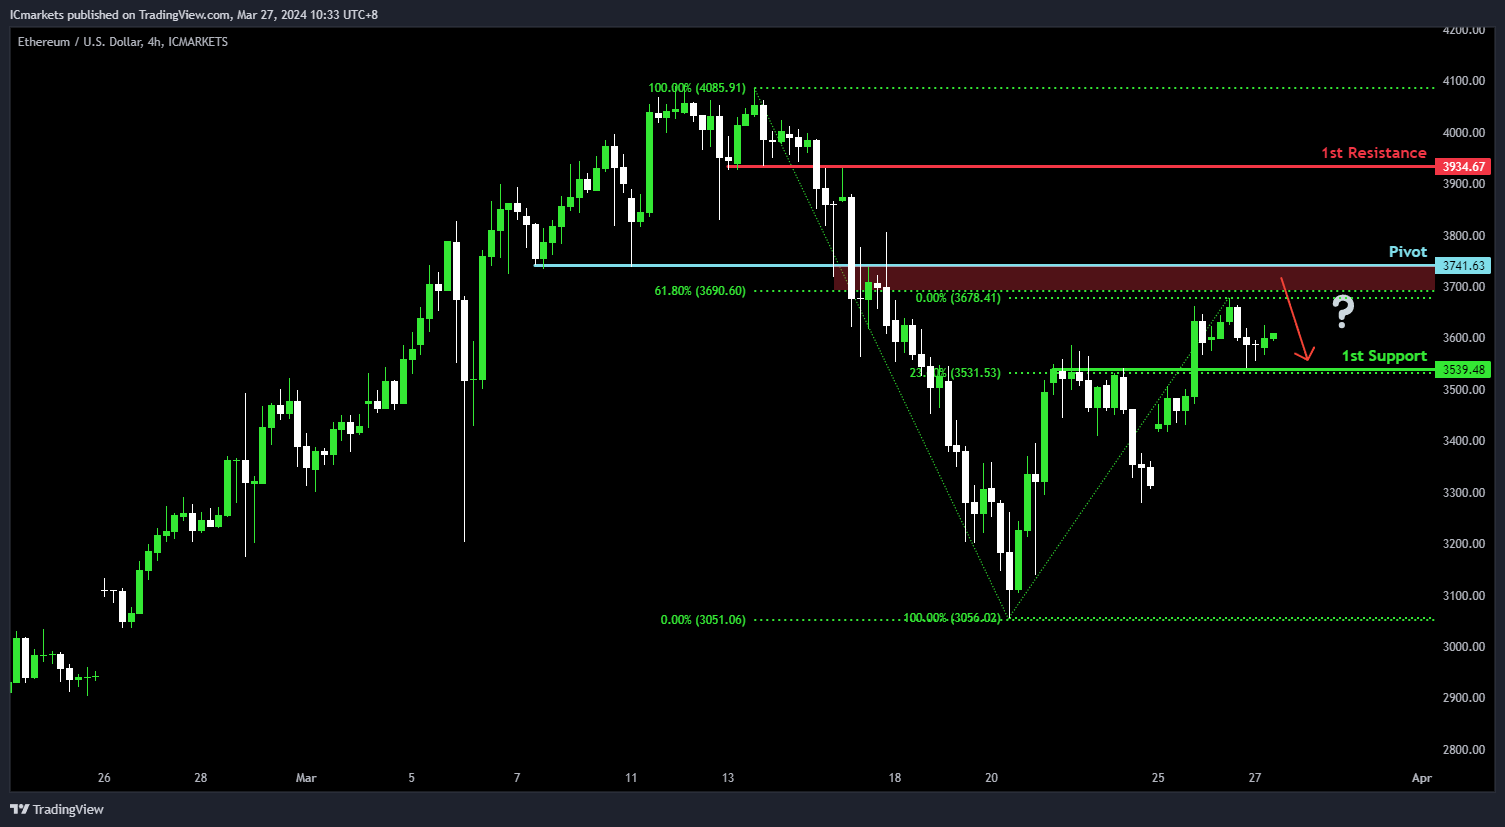
ETH/USD:
Potential Direction: Bullish
Overall momentum of the chart: Bullish
Price could potentially rise toward the pivot to make a bearish reaction and pull back towards the 1st support.
Pivot: 3,741.63
Supporting reasons: This level acts as an overlap resistance that aligns close to a 61.8% Fibonacci retracement, potentially initiating a bearish reversal if the level holds as resistance.
1st Support: 3,539.48
Supporting reasons: This level acts as an overlap support that aligns close to a 23.6% Fibonacci retracement, indicating a level where price has found strong support in the past.
1st Resistance: 3,934.67
Supporting reasons: This level is identified as an overlap resistance, marking it as a critical threshold for bullish momentum to overcome; resistance at this level could cap further upside movements.
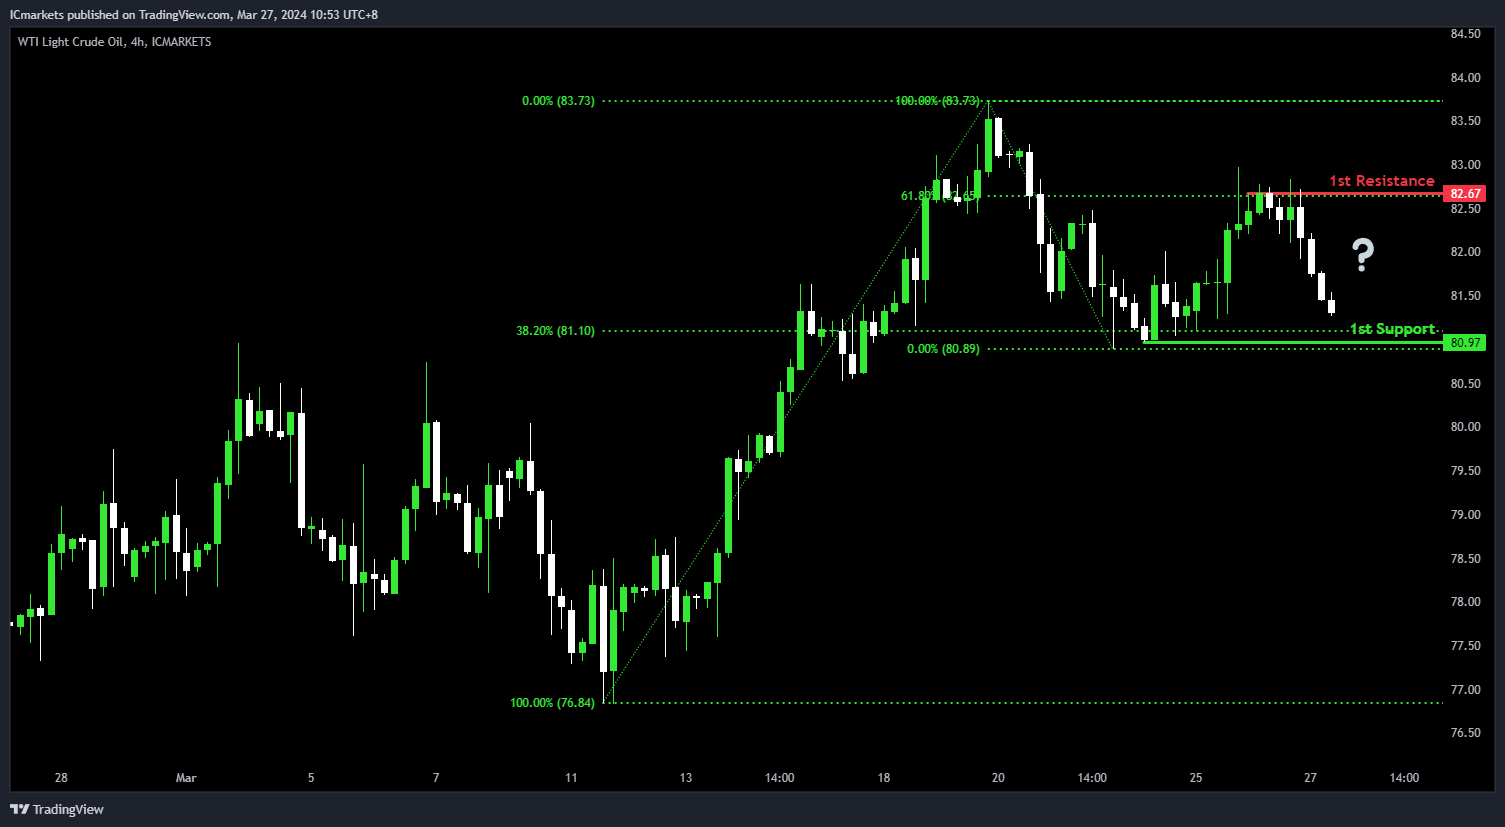
WTI/USD (Oil):
Potential Direction: Bearish
Overall momentum of the chart: Neutral
Price could potentially make a bullish reaction off the 1st support and rise towards the 1st resistance.
1st Support: 80.97
Supporting reasons: This level acts as a pullback support that aligns with a 38.2% Fibonacci retracement, indicating a level where price has found strong support in the past.
1st Resistance: 82.67
Supporting reasons: This level is identified as a pullback resistance that aligns with a 61.8% Fibonacci retracement, marking it as a critical threshold for bullish momentum to overcome; resistance at this level could cap further upside movements.
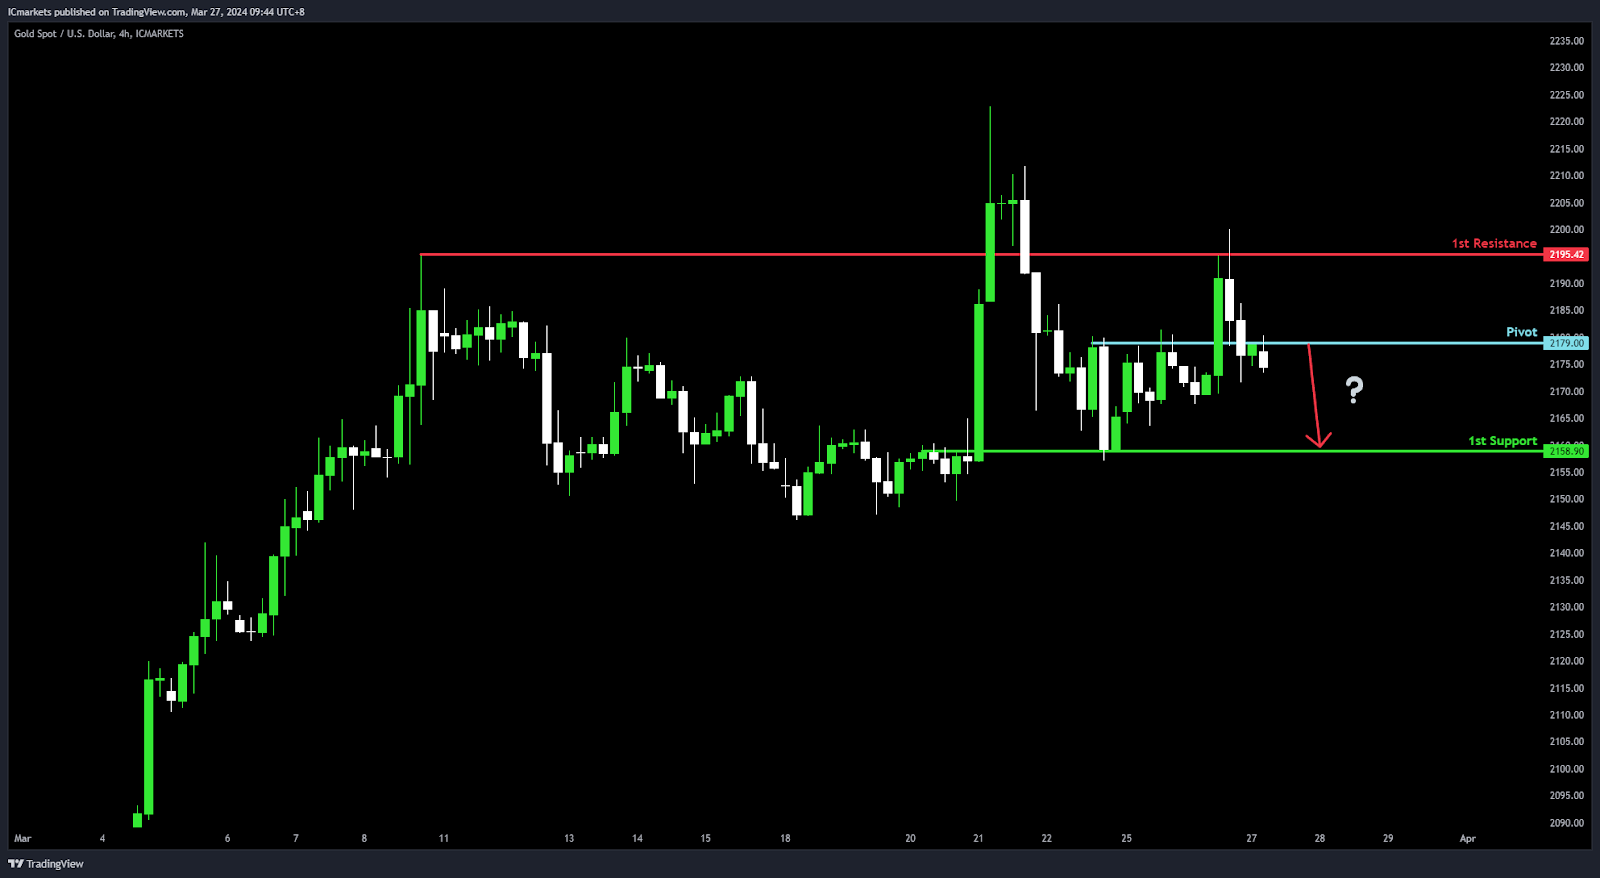
XAU/USD (GOLD):
Potential Direction: Bearish
Overall momentum of the chart: Bullish
Price could potentially make a: Bearish continuation towards 1st support
Pivot: 2179.00
Supporting reasons: Acts as an Overlap resistance, a crucial point where selling pressure could increase, suggesting a potential turning point for price to head downwards.
1st support: 2158.90
Supporting reasons: Known as an Overlap support, indicating a significant area where the market has previously found buyers, offering a foundation for potential stabilization or a rebound in price.
1st resistance: 2195.00
Supporting reasons: Marked as an Overlap resistance, a key barrier that could cap upward movements, highlighting its importance as a critical threshold for the bullish trend to overcome.
The accuracy, completeness and timeliness of the information contained on this site cannot be guaranteed. IC Markets does not warranty, guarantee or make any representations, or assume any liability regarding financial results based on the use of the information in the site.
News, views, opinions, recommendations and other information obtained from sources outside of www.icmarkets.com, used in this site are believed to be reliable, but we cannot guarantee their accuracy or completeness. All such information is subject to change at any time without notice. IC Markets assumes no responsibility for the content of any linked site.
The fact that such links may exist does not indicate approval or endorsement of any material contained on any linked site. IC Markets is not liable for any harm caused by the transmission, through accessing the services or information on this site, of a computer virus, or other computer code or programming device that might be used to access, delete, damage, disable, disrupt or otherwise impede in any manner, the operation of the site or of any user’s software, hardware, data or property.


